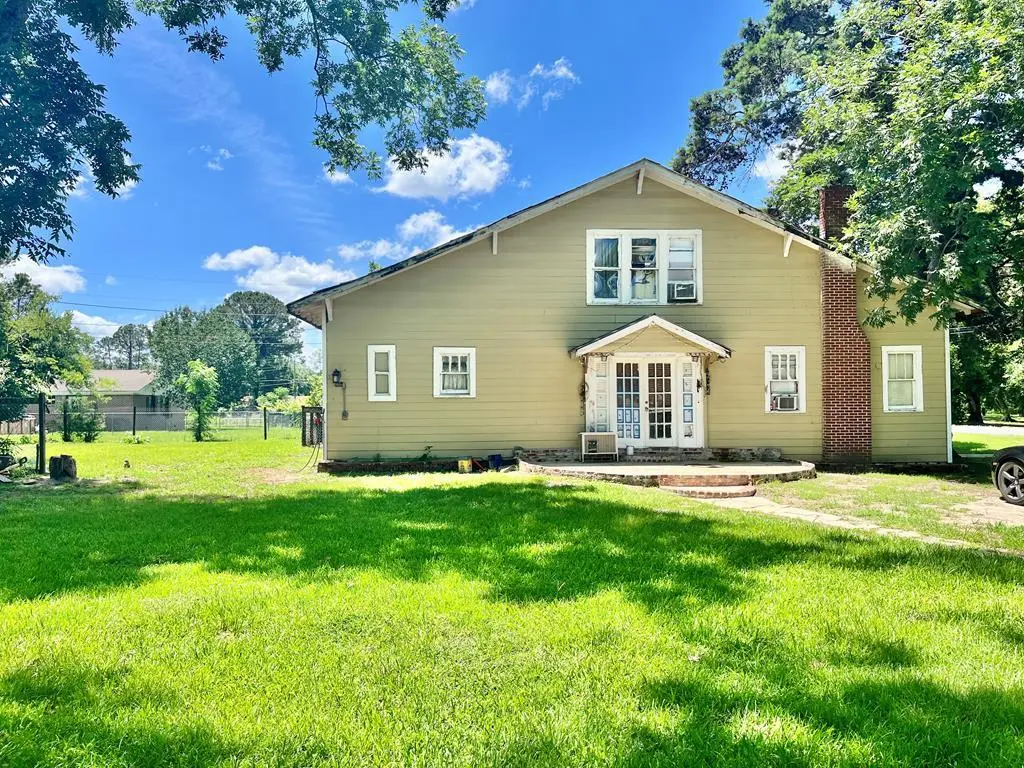
103 Tomberlin Ct · Fitzgerald, GA
Flood risk 1/10 · Minimal
- FEMA flood zone
- X (unshaded)
- Chance of flooding over 30 yrs
- 0.0%
- Est. flood insurance / yr
- $507 – $1,088
Fire risk 7/10 · Major
- Est. fire insurance / yr
- $963 – $1,789
Heat risk 7/10 · Major
- Hot days now (above 108°F)
- 7 days/yr
- Hot days in 30 yrs
- 19 days/yr
Wind risk 8/10 · Major
- Chance of severe wind over 30 yrs
- 96.0%
Air-quality risk 3/10 · Minor
- Unhealthy air days now
- 3 days/yr
- Unhealthy air days in 30 yrs
- 3 days/yr
Risk factors via First Street. Map © Google.
Why this score? — see what drove the C+ grade
The composite is a weighted blend of 9 inputs, each scored 0–100. Each bar is that input's sub-score; the figure is the points it added to the 100-point composite (weight × sub-score).
- Cash flow +30.0/30.0
- DSCR +10.0/10.0
- 1% rule +7.8/10.0
- ARV discount +7.5/15.0
- Livability +2.8/5.0
- Rent growth +2.5/5.0
- Condition / age +2.5/5.0
- Schools +1.6/10.0
- Appreciation +0.0/10.0
$95,000
🖨 Deal sheet (PDF) 📄 Offer letter ✓ Due diligence
Listing remarks MLS
2 Story, 4 Bedroom, 2 bath .
Key facts
- 0.46 acre lot
- Built 1950
- Listed 11 days
Property features AI
Exterior
- Home design: Single-family residential; Residential property
- Construction: Frame construction; Metal roof
- Exterior features: Deck; Patio; Wood fencing
Interior
- Kitchen: Dishwasher; Electric oven
- Bedrooms: Total rooms: 7
- Flooring: Vinyl flooring; Wood flooring
- Bathrooms: 1 full bathroom
- Heating & cooling: Central heating; Central air; Window unit(s); Ceiling fan(s)
- Interior features: Wood-burning fireplace; French doors
- Laundry & utility: Electric water heater
Neighborhood map
What this means for you Summary
Snapshot
- This is a 4-bed/2.0-bath single-family listed at $95k.
Deal economics
- At list price, monthly cash flow is $354 ($4k/yr) — positive.
- The deal already cash-flows at list — no discount required.
- Meets the 1% rule at list price ($1k rent vs $95k).
- Cap rate 10.8% vs local median 5.0% in Fitzgerald — top-decile yield for the area; either an underpriced asset or a hidden risk that comps aren't pricing in. Stress-test before assuming the spread holds.
Location & tenants
- Location reads 55/100 on livability (#513 in GA) — a working-class tenant base; expect higher turnover. Strengths: cost of living A+, housing B+; Watch: health & safety C-, schools F, crime F.
- Ben Hill County (rural): math 19% / reading 22% proficiency, ranked #145 of 174 in GA (top 83%) — low school quality limits family demand, transient renter base, plan for 1-2y turnover; 72% free/reduced lunch — lower-income household profile, screen leases tightly.
- Market conditions: 124 active listings in the ZIP; 6 units permitted in Ben Hill County in 2024 (0 in 5+ unit buildings).
Forward outlook
- Local home prices are declining (-3.0%/yr); year-one equity from $657 of loan paydown is wiped out by about $3k of value loss. Plan a longer hold.
- Ben Hill County population projected at -19% by 2050 — secular population decline; favor cash flow + early exit over multi-decade hold.
- At projected returns (-3.0% appreciation + 3.0% rent growth), your $27k cash investment doubles in ~8 years — after that, you're playing with house money.
Negotiation context
- Only 11 days on market — expect competitive offers; lowballing is unlikely to land.
- 2 sale attempts since 4y ago with the ask held roughly flat each time — persistent listings suggest the price (not the market) is what's stuck; bring a comps-based counter.
- Current owner paid $70k; 36% above their basis — modest negotiation headroom, anchor on the comps not their cost.
Risks & watch-outs
- Watch-outs: built in 1950 — expect roof / HVAC / electrical / plumbing capex.
- Climate carrying-cost: severe wind risk, 96% chance of damaging wind over 30y; major wildfire risk; extreme-heat days projected 7→19/yr by 2055 (HVAC capex compounding) — expect insurance premiums to compound above CPI over the hold.
Questions for the listing agent
- Built in 1950 — when were the roof, HVAC, electrical panel, plumbing, and water heater last replaced?
- Is there a deadline driving the sale (1031 exchange, divorce, estate, relocation)? That informs how much negotiation room exists.
- Schools are F-rated, which usually means shorter tenancies and higher turnover. Who's the typical renter profile here, and what's been the actual vacancy rate?
- Crime grade is F in this area — have there been break-ins, vandalism, or insurance claims at this property in the last 3 years? What carrier currently insures it and at what premium?
- What's the average days-on-market for RENTAL listings here right now (not sales)? A rising rental-DOM trend means longer vacancies and softer asking-rent achievability than the comps imply.
- What's the recent tenant-quality profile in this submarket — average credit score on applications, eviction rate, late-payment / NSF rate, and stable-employment percentage? A property-management company in the area should have these aggregated.
- How much new for-sale + rental construction is in the pipeline within 1–3 miles? Heavy new supply typically softens prices + rents 12–24 months out; constrained supply supports both.
Investment metrics
- 1% rule
- 1.28% ✓
- Cap rate
- 10.77%
- Cash-on-cash
- 15.98%
- DSCR
- 1.71
- GRM
- 6.5
CMA / ARV
- ARV (on-the-fly)
- $273,558
- Comps found
- 2
Show comp detail 2 sales within ~0.75 mi
| Address | Dist | Beds/Ba | Sqft | Sold | Price | $/sf | Match |
|---|---|---|---|---|---|---|---|
| 1095 N Merrimac Drive Ext | 0.24mi | 4/2.0 | 2,338 (+8%) | 1mo | $297,000 | $127 | 74 |
| 1041 N Merrimac Drive Ext | 0.38mi | 4/2.5 | 2,052 (-5%) | 22mo | $230,000 | $112 | 54 |
Match score weights: distance 35% · size 25% · config 20% · recency 20%. Top-matched comps best support the ARV.
Projected returns pro-forma
-3.0% appreciation · 3.0% rent growth · sell at horizon
- IRR
- 6.9%
- Equity multiple
- 1.27×
- Total profit
- $7,160
- Equity at exit
- $14,165
- IRR
- 16.2%
- Equity multiple
- 2.32×
- Total profit
- $35,240
- Equity at exit
- $8,214
Cash invested: $26,600 (down + closing). Projections, not guarantees.
Landlord ↔ Tenant lean methodology
- Overall (STATE)
- 90 Strongly Landlord-Friendly
- State Georgia
- 90 Strongly Landlord-Friendly · R+3
- County
- — inherits STATE
- City
- — inherits STATE
ZIP-level market 31750
- Home prices YoY
- -8.0%
- Active inventory
- 124
- Price-to-rent
- 6.5×
Monthly cashflow live
- Estimated rent
- $1,214 medium interval (Pro) →
- Mortgage (P&I)
- −$498
- Tax from tax record
- −$67 /mo · $807/yr
- Insurance
- −$40
- HOA
- −$0
- Vacancy / Maint / Mgmt
- −$255
- Net cashflow
- $354
Break-even live
Sensitivity live
| Price | -10% $408 | -5% $381 | +0% $354 | +5% $327 | +10% $301 |
|---|---|---|---|---|---|
| Rent | -10% $258 | -5% $306 | +0% $354 | +5% $402 | +10% $450 |
| Rate | -1.0pp $402 | -0.5pp $378 | base $354 | +0.5pp $330 | +1.0pp $305 |
UW: 25.0% down · 7.5% · 30yr · 1.5% tax · 5.0% vac · 8.0% maint · 8.0% mgmt
Financing live
Cash to close
- Down payment
- $23,750
- Closing costs
- $2,850
- Reserves months
- —
- Total cash needed
- —
Loan-product check · same deal, 3 products live
Conventional
25% down · 7.5% · 30yr
- Down + closing
- —
- Monthly P&I
- —
- Monthly cashflow
- —
- DSCR
- —
- Eligible?
- —
Personal DTI + credit; lowest rate.
DSCR
20% down · 8.5% · 30yr
- Down + closing
- —
- Monthly P&I
- —
- Monthly cashflow
- —
- DSCR
- —
- Eligible?
- —
No personal income docs; deal must DSCR.
Hard money
10% down · 12.0% · 12mo
- Down + closing
- —
- Monthly P&I
- —
- Monthly cashflow
- —
- DSCR
- —
- Eligible?
- —
Short-term bridge; refi at stabilization.
Listing history 9 events
-
2026-06-21days on market $95,000 Active 11 DOM
-
2026-06-18days on market $95,000 Active 9 DOM
-
2026-06-17days on market $95,000 Active 8 DOM
-
2026-06-16days on market $95,000 Active 7 DOM
-
2026-06-15days on market $95,000 Active 6 DOM
-
2026-06-13days on market $95,000 Active 4 DOM
-
2026-06-12days on market $95,000 Active 3 DOM
-
2026-06-09remarks 435-char remark
-
2026-06-09$95,000 Active 1 DOM
ⓘ Source: listings_history table (triggers on properties + properties_extension) + one-shot
backfill from property_details.listing_events for pre-trigger history.
Tax reassessment forecast GA · Resets to sale price
- Current annual tax
- $807 · $67/mo
- Projected year-2 tax
- $874 · $73/mo
- Expected delta
- +$67/yr (+$6/mo · 8.3%)
ⓘ Screening estimate from a state-policy table — verify with the county assessor before closing.
Climate risk First Street
- Flood 1/10 Low FEMA zone X (unshaded) · 0% chance over 30 yrs
- Wildfire 7/10 Severe
- Heat 7/10 Severe 7 d/yr ≥108°F today · 19 d/yr by 30 yrs out
- Wind 8/10 Severe 96% chance of damaging wind over 30 yrs
- Air quality 3/10 Moderate 3 unhealthy d/yr today · 3 by 30 yrs out
Nearby sold comps map
Loading sold comps map…
Walkable amenities ~0.75 mi
Loading nearby amenities…
Taxation est. · year 1
- Rental income
- $14,573
- − Mortgage interest
- −$5,321
- − Property taxes
- −$807
- − Insurance
- −$475
- − Repairs & maintenance
- −$1,166
- − Management
- −$1,166
- − Depreciation
- −$2,764
- Taxable income
- $2,874
- Est. tax owed @ 24.0%
- −$690
- After-tax cash flow
- $3,562/yr
For passive investors: Depreciation is non-cash, so a rental often shows a tax loss while cash-flowing — sheltering income. Rental losses are passive: they offset passive income freely, and up to $25,000/yr can offset ordinary (W-2) income if you actively participate and your MAGI is under $100k (phasing out to $0 by $150k); unused losses carry forward. On sale, claimed depreciation is recaptured at up to 25%, and gains may owe capital-gains tax (a 1031 exchange can defer both). Figures are a year-1 estimate at your 24.0% rate — not tax advice; consult a CPA.
Schools (NCES district)
- District
- Ben Hill County
- NCES district ID
- 1300360
- Math proficiency
- 19% ▼ -6.00%
- Reading proficiency
- 22% ▼ -2.00%
- Median HH income
- $30,617
- Composite
- 16.47/100
- National rank
- #9186
- State rank
- #145 of 174 in GA
Livability — Fitzgerald
- Score
- 55/100
- State rank
- #513
- US rank
- #23277
Category grades
Schools grade is shown separately in the Schools card above.
Census & demographics
- Population (ZIP)
- 18,582
Population outlook (Ben Hill County) Hauer SSP2
- Today (2025)
- 16,426 people
- By 2030
- 15,788 · -3.9%
- By 2040
- 14,582 · -11.2%
- By 2050
- 13,351 · -18.7%
- By 2075
- 10,301 · -37.3%
- By 2100
- 7,652 · -53.4%
Race, ethnicity, and origin ACS 2023
- Neighborhood character
- Diverse neighborhood (Simpson 0.57)
- Race & ethnicity
- White 54% Black 35% Hispanic / Latino 9% Two or more races 2%
- Hispanic origin (detail)
- Mexican 7%
- Common ancestry
- Slovak 1% Italian 1% Lithuanian 1%
- Foreign-born
- 3% · Canada
- Languages at home
- 91% English-only · Spanish 8% Other Indo-European 1%
Political lean MEDSL · Ben Hill
- 2024 margin
- Solid R (+32.0) · D 33.8% · R 65.8%
- 2008→2024 swing
- -18.3pp toward R · 2008: -13.7pp · 2024: -32.0pp
- All cycles
- 2024: R+32.0 2020: R+26.2 2016: R+27.6 2012: R+14.9 2008: R+13.7
Not yet ingested
- Civics
- —
Market trends
- HPI YoY
- ▼ -17.36%
- Current HPI
- 200.1257
- Rent YoY
- —
- Metro
- —
- State GDP YoY
- ▲ 2.66%
- F500 in state
- 28
Industry mix (Fortune 500 HQ in GA)
| Industry | F500 HQs | Revenue |
|---|---|---|
| Paper / Packaging | 2 | $29B |
|
||
| Retail | 1 | $160B |
|
||
| Transportation / Logistics | 1 | $91B |
|
||
| Airlines | 1 | $62B |
|
||
| Consumer Goods | 1 | $47B |
|
||
| Utilities | 1 | $25B |
|
||
Price history
+287.8% since first listed7 events — show timeline
- 2026-06-09 Listed $95,000 TBOR
- 2023-01-09 Sold (MLS) $70,000 TBOR
- 2022-12-27 Sold (Public Records) $70,000 Public Records
- 2022-10-10 Listed $75,000 TBOR
- 2009-12-03 Sold (Public Records) $15,000 Public Records
- 2006-12-07 Sold (Public Records) $23,000 Public Records
- 1992-12-04 Sold (Public Records) $24,500 Public Records
Property tax history
+9.4%/yrLatest (2025): $807 · -1.3% YoY. Source: county tax records.
Cash-flow waterfall
monthlySold comps — $/sqft
last 12 mo · ≤1 miLoading sold comps…