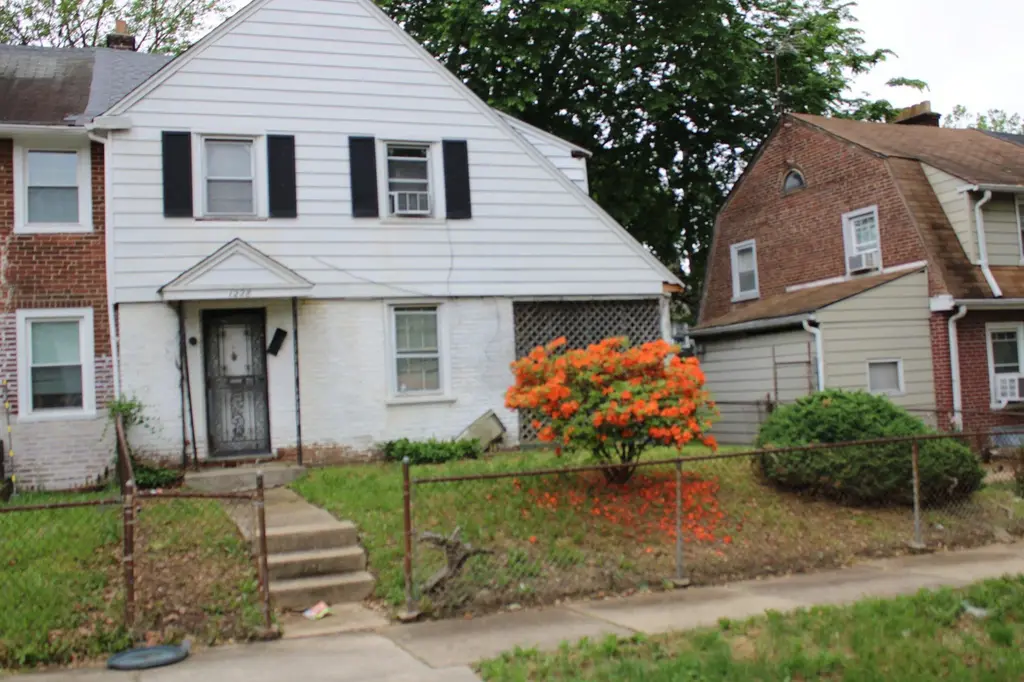
1228 Clover Ln · Chester, PA
Flood risk 1/10 · Minimal
- FEMA flood zone
- X (unshaded)
- Chance of flooding over 30 yrs
- 0.0%
- Est. flood insurance / yr
- $473 – $860
Fire risk 1/10 · Minimal
- Est. fire insurance / yr
- $511 – $949
Heat risk 7/10 · Major
- Hot days now (above 104°F)
- 7 days/yr
- Hot days in 30 yrs
- 15 days/yr
Wind risk 6/10 · Moderate
- Chance of severe wind over 30 yrs
- 27.0%
Air-quality risk 4/10 · Minor
- Unhealthy air days now
- 4 days/yr
- Unhealthy air days in 30 yrs
- 7 days/yr
Risk factors via First Street. Map © Google.
Why this score? — see what drove the B+ grade
The composite is a weighted blend of 9 inputs, each scored 0–100. Each bar is that input's sub-score; the figure is the points it added to the 100-point composite (weight × sub-score).
- Cash flow +30.0/30.0
- ARV discount +15.0/15.0
- 1% rule +10.0/10.0
- DSCR +10.0/10.0
- Rent growth +4.2/5.0
- Livability +3.7/5.0
- Condition / age +2.5/5.0
- Schools +0.8/10.0
- Appreciation +0.0/10.0
$82,500
🖨 Deal sheet (PDF) 📄 Offer letter ✓ Due diligence
Listing remarks
This end-of-row townhouse is a great investment opportunity with strong value-add potential. Offering 1,114 sq. ft. , this 3-bedroom, 1-bathroom home is ready for renovation and customization. The solid brick construction provides lasting durability, and a brand-new roof installed in 2025 adds major value and peace of mind for future owners or tenants. The enclosed patio offers additional outdoor space, while the low-maintenance exterior helps keep ongoing costs down. Located in a growing neighborhood with strong rental demand, this property is ideal for investors looking to generate cash flow and build equity through strategic updates. Don’t miss the chance to unlock this property&rs
Key facts
- Built 1930
- Listed 38 days
Property features AI
Finance
- Other: Pets allowed with no pet restrictions
- Financial info: Fee simple ownership; Property listed as needing major rehabilitation
- HOA & community:
Exterior
- Parking: On-street parking
- Security:
- Utilities: Public water; Public sewer; Natural gas available; Sewer available; Water available
- Home design: End of row townhouse; Estimated year built
- Construction: Brick construction; Brick/mortar foundation; Shingle roof
- Exterior features: Enclosed patio or porch; Patio(s)
Interior
- Kitchen:
- Bedrooms: Three bedrooms on the main level
- Flooring:
- Bathrooms: One full bathroom (main level)
- Heating & cooling: 90% forced air heating; Natural gas heating fuel; 60+ gallon hot water tank; 100 amp electric service
- Interior features: Drywall walls and ceilings; Unfinished basement; Two total levels; Six total rooms; Not in a federal flood zone; Accessible with 2+ access exits
- Laundry & utility:
Neighborhood map
What this means for you Summary
Snapshot
- This is a 3-bed/1.5-bath townhouse listed at $82k.
Deal economics
- At list price, monthly cash flow is $477 ($6k/yr) — positive.
- The deal already cash-flows at list — no discount required.
- Meets the 1% rule at list price ($1k rent vs $82k).
- Recommended offer: $80k (3.0% below list) — sets the bar for market timing.
- Cap rate 13.2% vs local median 7.5% in Chester — top-decile yield for the area; either an underpriced asset or a hidden risk that comps aren't pricing in. Stress-test before assuming the spread holds.
Location & tenants
- Location reads 73/100 on livability (#540 in PA) — a middle-class / working-renter tenant base. Strengths: amenities A+, commute A+, cost of living A+; Watch: schools F, crime F, employment F.
- Chester-Upland SD (suburban): math 4% / reading 17% proficiency, ranked #533 of 539 in PA (top 99%) — low school quality limits family demand, transient renter base, plan for 1-2y turnover; 81% free/reduced lunch — lower-income household profile, screen leases tightly.
- Market conditions: Rents rising fast (+6.9%/yr); 138 active listings in the ZIP; 16 comparable units currently listed for rent nearby; rentals at typical pace (median 21d on market — plan ~3-4 weeks tenant-placement turnaround); lower-income renter base — watch delinquency; 299 units permitted in Delaware County in 2024 (5 in 5+ unit buildings).
- This rent runs 42% of the median local income ($41k/yr) — at the standard rent-burdened threshold; future hikes will face affordability resistance.
Forward outlook
- Local home prices are declining (-3.0%/yr); year-one equity from $570 of loan paydown is wiped out by about $2k of value loss. Plan a longer hold.
- At projected returns (-3.0% appreciation + 6.9% rent growth), your $23k cash investment doubles in ~5 years — after that, you're playing with house money.
Negotiation context
- It's been on market 39 days — a 3% lower offer ($80k) is reasonable based on typical stale-listing flexibility.
- Current owner paid $26k; list at $82k implies a 211% gain — meaningful room to come down on a strong offer.
Risks & watch-outs
- Watch-outs: property tax is 3.0% of price; built in 1930 — expect roof / HVAC / electrical / plumbing capex.
- Climate carrying-cost: major wind risk, 27% chance of damaging wind over 30y; extreme-heat days projected 7→15/yr by 2055 (HVAC capex compounding) — expect insurance premiums to compound above CPI over the hold.
Questions for the listing agent
- It's been on market 39 days. Have you received any prior offers? Is the seller open to a 3% concession, seller financing, or rate buy-down credit?
- Built in 1930 — when were the roof, HVAC, electrical panel, plumbing, and water heater last replaced?
- Property tax is high relative to price — has the assessment been appealed recently, and will the sale trigger a re-assessment?
- Is there a deadline driving the sale (1031 exchange, divorce, estate, relocation)? That informs how much negotiation room exists.
- Schools are F-rated, which usually means shorter tenancies and higher turnover. Who's the typical renter profile here, and what's been the actual vacancy rate?
- Crime grade is F in this area — have there been break-ins, vandalism, or insurance claims at this property in the last 3 years? What carrier currently insures it and at what premium?
- What's the average days-on-market for RENTAL listings here right now (not sales)? A rising rental-DOM trend means longer vacancies and softer asking-rent achievability than the comps imply.
- What's the recent tenant-quality profile in this submarket — average credit score on applications, eviction rate, late-payment / NSF rate, and stable-employment percentage? A property-management company in the area should have these aggregated.
- How much new for-sale + rental construction is in the pipeline within 1–3 miles? Heavy new supply typically softens prices + rents 12–24 months out; constrained supply supports both.
Investment metrics
- 1% rule
- 1.77% ✓
- Cap rate
- 13.24%
- Cash-on-cash
- 24.80%
- DSCR
- 2.10
- GRM
- 4.7
CMA / ARV
- ARV (median comp)
- $137,770
- List price
- $82,500
- Delta
- -40.12%
- Verdict
- UNDERPRICED
- Comps
- 20 within 1.0 mi
Show comp detail 12 sales within ~0.75 mi
| Address | Dist | Beds/Ba | Sqft | Sold | Price | $/sf | Match |
|---|---|---|---|---|---|---|---|
| 3011 W 7th St | 0.36mi | 3/1.0 | 1,088 (-2%) | 3mo | $120,000 | $110 | 75 |
| 3339 Carter Ln | 0.07mi | 3/1.5 | 1,216 (+9%) | 11mo | $170,000 | $140 | 73 |
| 1200 Pine Ln | 0.08mi | 3/1.0 | 1,013 (-9%) | 10mo | $189,148 | $187 | 71 |
| 1305 Highland Ave | 0.20mi | 3/1.0 | 1,210 (+9%) | 4mo | $125,000 | $103 | 70 |
| 1326 Renshaw Rd | 0.16mi | 3/1.5 | 1,216 (+9%) | 11mo | $172,000 | $141 | 68 |
| 1405 Highland Ave | 0.21mi | 4/1.0 (+1) | 1,210 (+9%) | 4mo | $60,000 | $50 | 65 |
| 2611 W 6th St | 0.54mi | 3/1.0 | 1,172 (+5%) | 1mo | $72,000 | $61 | 63 |
| 2624 Mccarey St | 0.37mi | 3/1.0 | 1,210 (+9%) | 6mo | $75,000 | $62 | 62 |
| 2603 Swarts St | 0.36mi | 3/1.0 | 1,196 (+7%) | 11mo | $140,000 | $117 | 60 |
| 2719 Bethel Rd | 0.42mi | 3/1.0 | 1,210 (+9%) | 9mo | $71,500 | $59 | 56 |
| 2610 W 7th St | 0.49mi | 3/1.0 | 1,280 (+15%) | 2mo | $81,000 | $63 | 49 |
| 715 Engle St | 0.73mi | 3/2.0 | 1,268 (+14%) | 10mo | $130,000 | $103 | 33 |
Match score weights: distance 35% · size 25% · config 20% · recency 20%. Top-matched comps best support the ARV.
Projected returns pro-forma
-3.0% appreciation · 6.88% rent growth · sell at horizon
- IRR
- 23.0%
- Equity multiple
- 2.00×
- Total profit
- $23,047
- Equity at exit
- $12,301
- IRR
- 33.6%
- Equity multiple
- 4.72×
- Total profit
- $85,912
- Equity at exit
- $7,133
Cash invested: $23,100 (down + closing). Projections, not guarantees.
Landlord ↔ Tenant lean methodology
- Overall (STATE)
- 62 Landlord-Friendly
- State Pennsylvania
- 62 Landlord-Friendly · EVEN
- County
- — inherits STATE
- City
- — inherits STATE
ZIP-level market 19013
- Rents YoY
- 6.9%
- Active inventory
- 138
- Price-to-rent
- 4.7×
Monthly cashflow live
- Estimated rent
- $1,461 high interval (Pro) →
- Mortgage (P&I)
- −$433
- Tax from tax record
- −$210 /mo · $2,516/yr
- Insurance
- −$34
- HOA
- −$0
- Vacancy / Maint / Mgmt
- −$307
- Net cashflow
- $477
Break-even live
Sensitivity live
| Price | -10% $524 | -5% $501 | +0% $477 | +5% $454 | +10% $431 |
|---|---|---|---|---|---|
| Rent | -10% $362 | -5% $420 | +0% $477 | +5% $535 | +10% $593 |
| Rate | -1.0pp $519 | -0.5pp $498 | base $477 | +0.5pp $456 | +1.0pp $434 |
UW: 25.0% down · 7.5% · 30yr · 1.5% tax · 5.0% vac · 8.0% maint · 8.0% mgmt
Financing live
Cash to close
- Down payment
- $20,625
- Closing costs
- $2,475
- Reserves months
- —
- Total cash needed
- —
Loan-product check · same deal, 3 products live
Conventional
25% down · 7.5% · 30yr
- Down + closing
- —
- Monthly P&I
- —
- Monthly cashflow
- —
- DSCR
- —
- Eligible?
- —
Personal DTI + credit; lowest rate.
DSCR
20% down · 8.5% · 30yr
- Down + closing
- —
- Monthly P&I
- —
- Monthly cashflow
- —
- DSCR
- —
- Eligible?
- —
No personal income docs; deal must DSCR.
Hard money
10% down · 12.0% · 12mo
- Down + closing
- —
- Monthly P&I
- —
- Monthly cashflow
- —
- DSCR
- —
- Eligible?
- —
Short-term bridge; refi at stabilization.
Rent comps 16 comps
| Address | Beds | Baths | Sqft | Rent | $/sqft | DOM | Units | Dist |
|---|---|---|---|---|---|---|---|---|
| 3312 W 13th St Chester, PA | 2.0 | 1.0 | 936 | $1,499 | $1.60 | 22d | 1 | 0.09mi |
| 1107-1115 Keystone Rd Chester, PA | 2.0 | 1.0 | 700 | $1,250 | $1.79 | 44d | 1 | 0.17mi |
| 1006 Keystone Rd Chester, PA | 2.0 | 1.0 | 750 | $1,200 | $1.60 | 25d | 1 | 0.21mi |
| 908 Keystone Rd Chester, PA | 2.0 | 1.0 | 750 | $1,200 | $1.60 | 44d | 1 | 0.23mi |
| 906 Keystone Rd Chester, PA | 2.0 | 1.0 | 800 | $1,200 | $1.50 | 22d | 1 | 0.23mi |
| 906 Keystone Rd Unit 1 Chester, PA | 2.0 | 1.0 | 800 | $1,200 | $1.50 | 25d | 1 | 0.23mi |
| 2832 W 6th St Unit 306 Chester, PA | 3.0 | 1.0 | 1428 | $1,500 | $1.05 | 5d | 1 | 0.40mi |
| 1127 Ward St Chester, PA | 2.0 | 1.0 | 800 | $1,250 | $1.56 | 8d | 1 | 0.44mi |
| 425 Highland Ave Apt A Chester, PA | 2.0 | 1.5 | 990 | $1,000 | $1.01 | 21d | 1 | 0.54mi |
| 151 Chadwick Ave Marcus Hook, PA | 3.0 | 1.5 | 1080 | $1,600 | $1.48 | 11d | 1 | 1.18mi |
| 130 Harvey Ave Unit 1 Linwood, PA | 3.0 | 1.0 | 1173 | $1,750 | $1.49 | 10d | 1 | 1.23mi |
| 119 E Laughead Ave Marcus Hook, PA | 3.0 | 1.5 | 1080 | $1,530 | $1.42 | 4d | 1 | 1.23mi |
| 117 Ervin Ave Marcus Hook, PA | 3.0 | 1.5 | 720 | $1,595 | $2.22 | 21d | 1 | 1.24mi |
| 1015 McClenahan Ter Marcus Hook, PA | 3.0 | 2.5 | 1456 | $2,400 | $1.65 | 11d | 1 | 1.30mi |
| 1315 Harshaw Rd Brookhaven, PA | 3.0 | 2.5 | 1260 | $2,395 | $1.90 | 2d | 1 | 1.34mi |
| 1224 Elson Rd Brookhaven, PA | 3.0 | 2.0 | 1200 | $1,900 | $1.58 | 18d | 1 | 1.41mi |
Listing history 17 events
-
2026-06-18days on market $82,500 Active 39 DOM
-
2026-06-17days on market $82,500 Active 38 DOM
-
2026-06-16days on market $82,500 Active 37 DOM
-
2026-06-15days on market $82,500 Active 36 DOM
-
2026-06-13days on market $82,500 Active 34 DOM
-
2026-06-13days on market $82,500 Active 33 DOM
-
2026-06-09days on market $82,500 Active 30 DOM
-
2026-06-08days on market $82,500 Active 29 DOM
-
2026-06-07days on market $82,500 Active 28 DOM
-
2026-06-04days on market $82,500 Active 25 DOM
-
2026-06-03days on market $82,500 Active 24 DOM
-
2026-06-02days on market $82,500 Active 23 DOM
-
2026-06-02price $82,500 Active 22 DOM
-
2026-06-01days on market $85,000 Active 22 DOM
-
2026-05-31days on market $85,000 Active 21 DOM
-
2026-05-11$85,000 Active 960-char remark
-
1993-12-17soldstatus $26,500
ⓘ Source: listings_history table (triggers on properties + properties_extension) + one-shot
backfill from property_details.listing_events for pre-trigger history.
Tax reassessment forecast PA · Partial reset (capped growth)
- Current annual tax
- $2,516 · $210/mo
- Projected year-2 tax
- $2,516 · $210/mo
- Expected delta
- $0/yr ($0/mo · 0.0%)
ⓘ Screening estimate from a state-policy table — verify with the county assessor before closing.
Climate risk First Street
- Flood 1/10 Low FEMA zone X (unshaded) · 0% chance over 30 yrs
- Wildfire 1/10 Low
- Heat 7/10 Severe 7 d/yr ≥104°F today · 15 d/yr by 30 yrs out
- Wind 6/10 Major 27% chance of damaging wind over 30 yrs
- Air quality 4/10 Moderate 4 unhealthy d/yr today · 7 by 30 yrs out
Nearby sold comps map
Loading sold comps map…
Walkable amenities ~0.75 mi
Loading nearby amenities…
Taxation est. · year 1
- Rental income
- $17,529
- − Mortgage interest
- −$4,621
- − Property taxes
- −$2,516
- − Insurance
- −$412
- − Repairs & maintenance
- −$1,402
- − Management
- −$1,402
- − Depreciation
- −$2,400
- Taxable income
- $4,775
- Est. tax owed @ 24.0%
- −$1,146
- After-tax cash flow
- $4,582/yr
For passive investors: Depreciation is non-cash, so a rental often shows a tax loss while cash-flowing — sheltering income. Rental losses are passive: they offset passive income freely, and up to $25,000/yr can offset ordinary (W-2) income if you actively participate and your MAGI is under $100k (phasing out to $0 by $150k); unused losses carry forward. On sale, claimed depreciation is recaptured at up to 25%, and gains may owe capital-gains tax (a 1031 exchange can defer both). Figures are a year-1 estimate at your 24.0% rate — not tax advice; consult a CPA.
Schools (NCES district)
- District
- Chester-Upland SD
- NCES district ID
- 4205860
- Math proficiency
- 4% ▼ -3.00%
- Reading proficiency
- 17% ▼ -6.00%
- Median HH income
- $29,790
- Composite
- 8.05/100
- National rank
- #9918
- State rank
- #533 of 539 in PA
Livability — Chester
- Score
- 73/100
- State rank
- #540
- US rank
- #5053
Category grades
Schools grade is shown separately in the Schools card above.
Census & demographics
- Census place
- Chester, PA
- County
- Delaware County · 399,863 people
- City population
- 35,064
- Metro
- Philadelphia-Camden-Wilmington, PA-NJ-DE-MD
- Population (ZIP)
- 35,064
- Household income
- $41,261
- Rent vs Own
- Severe rent burden
- 2668.0
Population outlook (Delaware County) Hauer SSP2
- Today (2025)
- 577,490 people
- By 2030
- 581,243 · +0.6%
- By 2040
- 584,700 · +1.2%
- By 2050
- 586,581 · +1.6%
- By 2075
- 598,706 · +3.7%
- By 2100
- 590,823 · +2.3%
Race, ethnicity, and origin ACS 2023
- Neighborhood character
- Predominantly Black (71%)
- Race & ethnicity
- Black 71% White 14% Hispanic / Latino 9% Two or more races 4%
- Hispanic origin (detail)
- Puerto Rican 6%
- Common ancestry
- Romanian 2%
- Foreign-born
- 4% · Canada
- Languages at home
- 92% English-only · Spanish 6%
Political lean MEDSL · Delaware
- 2024 margin
- Strong D (+23.7) · D 61.4% · R 37.6% · Other 1.0%
- 2008→2024 swing
- +2.3pp toward D · 2008: 21.4pp · 2024: 23.7pp
- All cycles
- 2024: D+23.7 2020: D+26.7 2016: D+22.0 2012: D+21.8 2008: D+21.4
Not yet ingested
- Civics
- —
Market trends
- HPI YoY
- ▼ -149.69%
- Current HPI
- 219.5173
- Rent YoY
- ▲ 6.88%
- Metro
- Philadelphia-Camden-Wilmington, PA-NJ-DE-MD
- State GDP YoY
- ▲ 1.68%
- F500 in state
- 34
Industry mix (Fortune 500 HQ in PA)
| Industry | F500 HQs | Revenue |
|---|---|---|
| Healthcare | 2 | $309B |
|
||
| Insurance | 2 | $27B |
|
||
| Telecommunications / Media | 1 | $124B |
|
||
| Industrial Distribution | 1 | $22B |
|
||
| Financial Services | 1 | $20B |
|
||
| Chemicals / Materials | 1 | $18B |
|
||
Price history
+211.3% since first listed3 events — show timeline
- 2026-06-01 Price Changed $82,500 BRIGHT MLS
- 2026-05-11 Listed $85,000 BRIGHT MLS
- 1993-12-17 Sold (Public Records) $26,500 Public Records
Property tax history
+21.8%/yrLatest (2026): $2,516 · +143.3% YoY. Source: county tax records.
Cash-flow waterfall
monthlySold comps — $/sqft
last 12 mo · ≤1 miLoading sold comps…