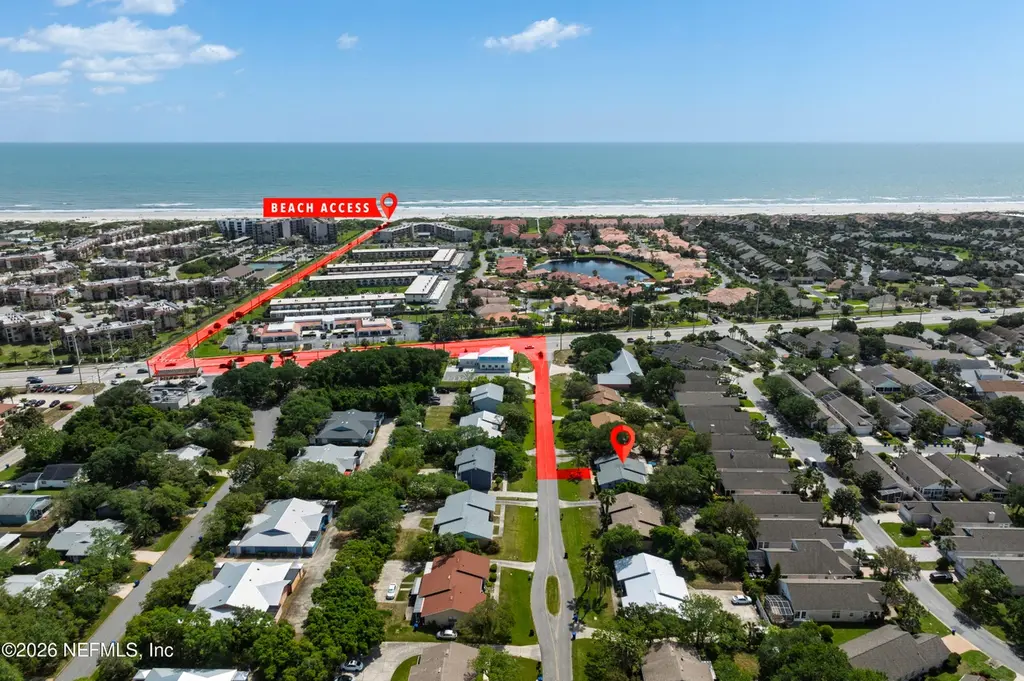
107 Rio Del Mar St #B · Butler Beach, FL
Flood risk 8/10 · Major
- FEMA flood zone
- X (shaded)
- Chance of flooding over 30 yrs
- 0.97%
- Est. flood insurance / yr
- $507 – $1,088
Fire risk 5/10 · Moderate
- Est. fire insurance / yr
- $947 – $1,759
Heat risk 10/10 · Severe
- Hot days now (above 105°F)
- 7 days/yr
- Hot days in 30 yrs
- 21 days/yr
Wind risk 10/10 · Severe
- Chance of severe wind over 30 yrs
- 99.0%
Air-quality risk 3/10 · Minor
- Unhealthy air days now
- 3 days/yr
- Unhealthy air days in 30 yrs
- 3 days/yr
Risk factors via First Street. Map © Google.
Why this score? — see what drove the C grade
The composite is a weighted blend of 9 inputs, each scored 0–100. Each bar is that input's sub-score; the figure is the points it added to the 100-point composite (weight × sub-score).
- Cash flow +21.0/30.0
- ARV discount +7.5/15.0
- DSCR +6.7/10.0
- Schools +6.4/10.0
- 1% rule +6.3/10.0
- Livability +3.1/5.0
- Condition / age +2.5/5.0
- Rent growth +2.3/5.0
- Appreciation +0.0/10.0
$249,500
🖨 Deal sheet 📄 Offer letter ✓ Due diligence
Listing remarks MLS
Discover this beautifully maintained 2-bedroom, 1-bath condo just a short stroll from the pristine sands of St. Augustine Beach. This single-level, move-in-ready home boasts an efficient open floor plan adorned with granite countertops, laminate flooring, and custom cabinetry. The sunlit Florida room, enclosed with glass and equipped with A/C, offers a serene space to relax or entertain. Energy-efficient vinyl-tinted windows ensure comfort year-round. With a low HOA fee of $250/month covering grounds maintenance, water and pest control, this property is an ideal choice for a vacation retreat, rental investment, or cozy year-round residence. Experience the best of coastal living with nearby dining, shopping, and the natural beauty of Anastasia State Park.
Key facts
- Custom cabinetry
- Laminate flooring
- Florida room
Tags
Property features AI
Finance
- HOA & community: Homeowners association with a $250 monthly fee; Not a senior community
Exterior
- Parking: Parking lot
- Utilities: Septic tank; Cable connected; Electricity connected; Water connected
- Home design: Condominium; One level; Property is attached; Residential use
- Construction: 1 story
- Exterior features: Faces north; City street frontage; No private pool
Interior
- Kitchen: Convection oven; Dishwasher; Electric range; Microwave; Refrigerator
- Bedrooms: 2 bedrooms
- Bathrooms: 1 full bathroom
- Heating & cooling: Central heating; Central air conditioning
- Interior features: Furnished; Convection oven; Dishwasher; Electric range; Electric water heater; Microwave; Refrigerator
- Laundry & utility: Electric water heater
Neighborhood map
What this means for you Summary
Snapshot
- This is a 2-bed/1.0-bath condo listed at $250k.
Deal economics
- At list price, monthly cash flow is $283 ($3k/yr) — positive.
- The deal already cash-flows at list — no discount required.
- Meets the 1% rule at list price ($3k rent vs $250k).
- Cap rate 8.0% vs local median 2.2% in Butler Beach — top-decile yield for the area; either an underpriced asset or a hidden risk that comps aren't pricing in. Stress-test before assuming the spread holds.
Location & tenants
- Location reads 61/100 on livability (#784 in FL) — a middle-class / working-renter tenant base. Strengths: crime A+, housing A+, employment A-; Watch: health & safety C-, amenities F, commute F.
- St. Johns (rural): math 75% / reading 73% proficiency, ranked #2 of 73 in FL (top 3%) — strong family-tenant draw, lease renewals of 3-5y typical; only 20% free/reduced lunch — higher-income household profile.
- Zoned schools: Gamble Rogers Middle School (math 61% / reading 55%, grade B, #151 of 571 statewide, top 27%, 925 students, 47% FRL); Pedro Menendez High School (math 31% / reading 54%, grade F, #264 of 667 statewide, top 41%, 1,519 students, 39% FRL) — zoned schools average 43% FRL vs 20% district-wide (23 pts higher); higher-poverty schools than district average — tighter screening recommended.
- Zoned-school proficiency averages 50% at this address vs 74% district-wide (-24 pts) — the specific schools serving this property underperform the St. Johns average; the district grade overstates school quality for this exact location.
- Market conditions: Rents soft (-1.0%/yr); 534 active listings in the ZIP; 11 comparable units currently listed for rent nearby; rentals leasing fast (median 3d on market — plan ~1-2 weeks tenant-placement turnaround); solid renter incomes; 5,575 units permitted in St. Johns County in 2024 (584 in 5+ unit buildings).
- This rent runs 37% of the median local income ($93k/yr) — at the standard rent-burdened threshold; future hikes will face affordability resistance.
Forward outlook
- Local home prices are declining (-3.0%/yr); year-one equity from $2k of loan paydown is wiped out by about $7k of value loss. Plan a longer hold.
- St. Johns County population projected at +60% by 2050 — long-run rental-demand tailwind backs the buy-and-hold thesis.
Negotiation context
- Only 6 days on market — expect competitive offers; lowballing is unlikely to land.
- 6 sale attempts since 2y ago with the ask held roughly flat each time — persistent listings suggest the price (not the market) is what's stuck; bring a comps-based counter.
- Current owner paid $70k; list at $250k implies a 257% gain — meaningful room to come down on a strong offer.
Risks & watch-outs
- Watch-outs: flood insurance adds $66/mo.
- Climate carrying-cost: severe flood risk; severe wind risk, 99% chance of damaging wind over 30y; moderate wildfire risk; extreme-heat days projected 7→21/yr by 2055 (HVAC capex compounding) — expect insurance premiums to compound above CPI over the hold.
Questions for the listing agent
- What's the actual annual flood-insurance premium (NFIP or private), and is the property in a SFHA with mandatory coverage?
- What does the HOA fee cover, when was the last increase, and are there any pending special assessments or reserve-fund shortfalls?
- Any open or pending special assessments — roof, HVAC, plumbing, elevator, façade? What's the per-unit balance and payoff schedule, and is the seller paying it off at close or rolling it to the buyer?
- Is there a deadline driving the sale (1031 exchange, divorce, estate, relocation)? That informs how much negotiation room exists.
- Schools are D-rated, which usually means shorter tenancies and higher turnover. Who's the typical renter profile here, and what's been the actual vacancy rate?
- What's the average days-on-market for RENTAL listings here right now (not sales)? A rising rental-DOM trend means longer vacancies and softer asking-rent achievability than the comps imply.
- What's the recent tenant-quality profile in this submarket — average credit score on applications, eviction rate, late-payment / NSF rate, and stable-employment percentage? A property-management company in the area should have these aggregated.
- How much new apartment / multifamily construction is in the pipeline within 1–3 miles? Heavy new supply (>2% of stock underway) typically softens rents 12–24 months out; light construction supports rent growth.
Investment metrics
- 1% rule
- 1.13% ✓
- Cap rate
- 7.97%
- Cash-on-cash
- 6.00%
- DSCR
- 1.27
- GRM
- 7.3
CMA / ARV
No comps found within radius.
Projected returns pro-forma
-3.0% appreciation · 0.0% rent growth · sell at horizon
- IRR
- -12.5%
- Equity multiple
- 0.56×
- Total profit
- $-30,512
- Equity at exit
- $37,201
- IRR
- -9.5%
- Equity multiple
- 0.50×
- Total profit
- $-34,659
- Equity at exit
- $21,572
Cash invested: $69,860 (down + closing). Projections, not guarantees.
Landlord ↔ Tenant lean methodology
- Overall (STATE)
- 87 Strongly Landlord-Friendly
- State Florida
- 87 Strongly Landlord-Friendly · R+3
- County
- — inherits STATE
- City
- — inherits STATE
ZIP-level market 32080
- Rents YoY
- -1.0%
- Active inventory
- 534
- Price-to-rent
- 7.3×
Monthly cashflow live
- Estimated rent
- $2,829 high interval (Pro) →
- Mortgage (P&I)
- −$1,308
- Tax from tax record
- −$223 /mo · $2,681/yr
- Insurance
- −$104
- Flood insurance flood zone
- −$66 /mo · $798/yr
- HOA
- −$250
- Vacancy / Maint / Mgmt
- −$594
- Net cashflow
- $283
Break-even live
UW: 25.0% down · 7.5% · 30yr · 1.5% tax · 5.0% vac · 8.0% maint · 8.0% mgmt
Financing live
Cash to close
- Down payment
- $62,375
- Closing costs
- $7,485
- Reserves months
- —
- Total cash needed
- —
Loan-product check · same deal, 3 products live
Conventional
25% down · 7.5% · 30yr
- Down + closing
- —
- Monthly P&I
- —
- Monthly cashflow
- —
- DSCR
- —
- Eligible?
- —
Personal DTI + credit; lowest rate.
DSCR
20% down · 8.5% · 30yr
- Down + closing
- —
- Monthly P&I
- —
- Monthly cashflow
- —
- DSCR
- —
- Eligible?
- —
No personal income docs; deal must DSCR.
Hard money
10% down · 12.0% · 12mo
- Down + closing
- —
- Monthly P&I
- —
- Monthly cashflow
- —
- DSCR
- —
- Eligible?
- —
Short-term bridge; refi at stabilization.
Rent comps 11 comps
| Address | Beds | Baths | Sqft | Rent | $/sqft | DOM | Units | Dist |
|---|---|---|---|---|---|---|---|---|
| 95 Dondanville Rd Unit 1509619P St. Augustine, FL | 2.0 | 2.0 | 1033 | $3,050 | $2.95 | 2d | 1 | 0.15mi |
| 4250 A1A S Unit 1538861P St. Augustine, FL | 2.0 | 2.0 | 1033 | $2,586 | $2.50 | 1d | 1 | 0.22mi |
| 1733 Sea Fair Dr Unit 1509620P St. Augustine, FL | 2.0 | 2.5 | 1119 | $3,148 | $2.81 | 1d | 1 | 0.31mi |
| 130 Ocean Hibiscus Dr Unit 1253546P St. Augustine, FL | 2.0 | 2.0 | 968 | $3,076 | $3.18 | 16d | 1 | 0.56mi |
| 120 Ocean Hibiscus Dr Unit 1253536P St. Augustine, FL | 2.0 | 2.0 | 904 | $2,219 | $2.45 | 2d | 1 | 0.57mi |
| 210 Ocean Hibiscus Dr Unit 1253509P St. Augustine, FL | 2.0 | 2.0 | 1076 | $5,686 | $5.28 | 14d | 1 | 0.66mi |
| 200 Sevilla St Unit B St. Augustine, FL | 2.0 | 1.0 | 1020 | $1,850 | $1.81 | 7d | 1 | 1.29mi |
| 200 Sevilla St Unit B St. Augustine, FL | 2.0 | 1.0 | 1020 | $1,850 | $1.81 | 3d | 1 | 1.29mi |
| 880 A1A Beach Blvd Unit 1509621P St. Augustine, FL | 2.0 | 2.0 | 871 | $4,601 | $5.28 | 23d | 1 | 1.46mi |
| 880 Jimmy Buffett Memorial Hwy Unit 1259091P St. Augustine, FL | 2.0 | 2.0 | 871 | $2,755 | $3.16 | 1d | 1 | 1.47mi |
| 40 Andalusia Ct Unit 40 St. Augustine, FL | 2.0 | 2.0 | 920 | $1,650 | $1.79 | 23d | 1 | 1.49mi |
HOA detail condo
- Monthly dues
- $250 · $3,000/yr
- Likely covers
- waterlandscaping
- Assessments
- None detected in remarks — confirm with the listing agent.
Listing history 6 events
-
2026-06-18days on market $249,500 Active 6 DOM
-
2026-06-17days on market $249,500 Active 5 DOM
-
2026-06-16days on market $249,500 Active 4 DOM
-
2026-06-15days on market $249,500 Active 3 DOM
-
2026-06-13remarks 699-char remark
-
2026-06-13$249,500 Active 1 DOM
ⓘ Source: listings_history table (triggers on properties + properties_extension) + one-shot
backfill from property_details.listing_events for pre-trigger history.
Tax reassessment forecast FL · Resets to sale price
- Current annual tax
- $2,681 · $223/mo
- Projected year-2 tax
- $2,681 · $223/mo
- Expected delta
- $0/yr ($0/mo · 0.0%)
ⓘ Screening estimate from a state-policy table — verify with the county assessor before closing.
Climate risk First Street
- Flood 8/10 Severe FEMA zone X (shaded) · 97% chance over 30 yrs
- Wildfire 5/10 Major
- Heat 10/10 Extreme 7 d/yr ≥105°F today · 21 d/yr by 30 yrs out
- Wind 10/10 Extreme 99% chance of damaging wind over 30 yrs
- Air quality 3/10 Moderate 3 unhealthy d/yr today · 3 by 30 yrs out
Nearby sold comps map
Loading sold comps map…
Walkable amenities ~0.75 mi
Loading nearby amenities…
Taxation est. · year 1
- Rental income
- $33,953
- − Mortgage interest
- −$13,976
- − Property taxes
- −$2,681
- − Insurance
- −$2,045
- − Repairs & maintenance
- −$2,716
- − Management
- −$2,716
- − HOA
- −$3,000
- − Depreciation
- −$7,258
- Taxable loss
- −$439
- Est. tax savings @ 24.0%
- +$105
- After-tax cash flow
- $3,502/yr
For passive investors: Depreciation is non-cash, so a rental often shows a tax loss while cash-flowing — sheltering income. Rental losses are passive: they offset passive income freely, and up to $25,000/yr can offset ordinary (W-2) income if you actively participate and your MAGI is under $100k (phasing out to $0 by $150k); unused losses carry forward. On sale, claimed depreciation is recaptured at up to 25%, and gains may owe capital-gains tax (a 1031 exchange can defer both). Figures are a year-1 estimate at your 24.0% rate — not tax advice; consult a CPA.
Schools (NCES district)
- District
- St. Johns
- NCES district ID
- 1201740
- Math proficiency
- 75% ▼ -5.00%
- Reading proficiency
- 73% ▼ -2.00%
- Median HH income
- $66,842
- Composite
- 64.31/100
- National rank
- #556
- State rank
- #2 of 73 in FL
Livability — Butler Beach
- Score
- 61/100
- State rank
- #784
- US rank
- #17810
Category grades
Schools grade is shown separately in the Schools card above.
Census & demographics
- Census place
- Butler Beach, FL
- County
- Saint Johns County · 301,599 people
- City population
- 21,368
- Metro
- Jacksonville, FL
- Population (ZIP)
- 20,894
- Household income
- $92,531
- Rent vs Own
- Severe rent burden
- 417.0
Population outlook (St. Johns County) Hauer SSP2
- Today (2025)
- 303,941 people
- By 2030
- 342,590 · +12.7%
- By 2040
- 417,328 · +37.3%
- By 2050
- 487,011 · +60.2%
- By 2075
- 635,395 · +109.1%
- By 2100
- 717,469 · +136.1%
Race, ethnicity, and origin ACS 2023
- Neighborhood character
- Predominantly White (90%)
- Race & ethnicity
- White 90% Two or more races 5% Hispanic / Latino 4% Asian 2%
- Common ancestry
- Romanian 4% Lithuanian 4% Slovak 3%
- Foreign-born
- 7% · Canada, Jamaica
- Languages at home
- 95% English-only · Spanish 2% Other Indo-European 2% Russian/Polish/Slavic 1%
Political lean MEDSL · St. Johns
- 2024 margin
- Solid R (+31.4) · D 33.9% · R 65.2%
- 2008→2024 swing
- +0.2pp no change · 2008: -31.6pp · 2024: -31.4pp
- All cycles
- 2024: R+31.4 2020: R+26.7 2016: R+33.4 2012: R+37.8 2008: R+31.6
Not yet ingested
- Civics
- —
Market trends
- HPI YoY
- ▼ -560.06%
- Current HPI
- 301.5733
- Rent YoY
- ▼ -0.97%
- Metro
- Jacksonville, FL
- State GDP YoY
- ▲ 3.28%
- F500 in state
- 36
Industry mix (Fortune 500 HQ in FL)
| Industry | F500 HQs | Revenue |
|---|---|---|
| Industrial Technology | 2 | $29B |
|
||
| Insurance | 2 | $17B |
|
||
| Retail | 1 | $60B |
|
||
| Technology Distribution | 1 | $58B |
|
||
| Homebuilding | 1 | $35B |
|
||
| Technology Manufacturing | 1 | $35B |
|
||
Price history
+556.6% since first listed15 events — show timeline
- 2026-06-12 Listed $249,500 realMLS
- 2025-08-29 Listing Removed — realMLS
- 2025-08-24 Relisted — realMLS
- 2025-08-09 Contingent — realMLS
- 2025-04-25 Listed $300,000 realMLS
- 2025-03-31 Listing Removed — realMLS
- 2024-12-29 Listed $315,000 realMLS
- 2024-12-29 Relisted — realMLS
- 2024-12-28 Listing Removed — realMLS
- 2024-12-22 Listing Removed — realMLS
- 2024-11-11 Price Changed $324,000 realMLS
- 2024-09-12 Price Changed $325,000 realMLS
- 2024-08-22 Listed $329,900 realMLS
- 1999-06-18 Sold (Public Records) $69,900 Public Records
- 1982-04-01 Sold (Public Records) $38,000 Public Records
Property tax history
+8.1%/yrLatest (2025): $2,681 · +11.0% YoY. Source: county tax records.
Cash-flow waterfall
monthlySold comps — $/sqft
last 12 mo · ≤1 miLoading sold comps…