 🏗️ New Construction
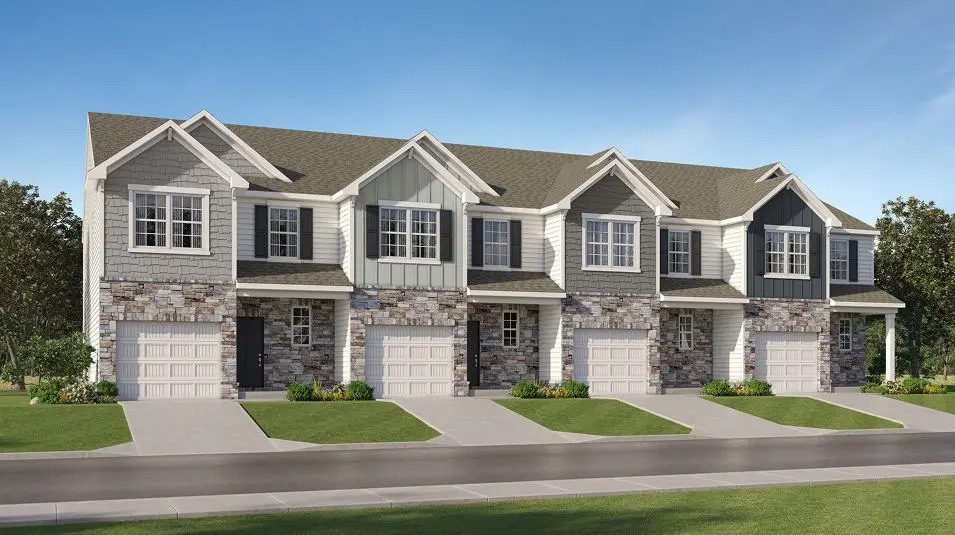
Bristol VE Plan · York, SC
Flood risk 5/10 · Moderate
- FEMA flood zone
- X (unshaded)
- Chance of flooding over 30 yrs
- 0.24%
- Est. flood insurance / yr
- $507 – $1,088
Fire risk 3/10 · Minor
- Est. fire insurance / yr
- $783 – $1,453
Heat risk 5/10 · Moderate
- Hot days now (above 105°F)
- 7 days/yr
- Hot days in 30 yrs
- 15 days/yr
Wind risk 5/10 · Moderate
- Chance of severe wind over 30 yrs
- 24.0%
Air-quality risk 3/10 · Minor
- Unhealthy air days now
- 3 days/yr
- Unhealthy air days in 30 yrs
- 3 days/yr
Risk factors via First Street. Map © Google.
Why this score? — see what drove the C grade
The composite is a weighted blend of 9 inputs, each scored 0–100. Each bar is that input's sub-score; the figure is the points it added to the 100-point composite (weight × sub-score).
- Cash flow +23.6/30.0
- DSCR +7.6/10.0
- ARV discount +7.5/15.0
- 1% rule +6.1/10.0
- Condition / age +4.0/5.0
- Livability +3.2/5.0
- Schools +3.0/10.0
- Rent growth +2.5/5.0
- Appreciation +0.0/10.0
$235,999
🖨 Deal sheet 📄 Offer letter ✓ Due diligence
Listing remarks
This new two-story home is host to an inviting open concept layout on the first floor that blends the kitchen, living and dining areas for seamless entertaining and multitasking. A nearby patio offers simple indoor-outdoor living. All three bedrooms are located on the second floor, including the luxurious owner's suite with a spa-inspired bathroom and walk-in closet.
Key facts
- Walk in closet
- Open concept layout
- Garage
Tags
Property features AI
Finance
- Other: Model/plan home listing
- Financial info: List price $248,999
Exterior
- Parking: Detached or attached garage with space for 1 car; 1 parking space total
- Home design: Bristol VE plan (new construction); Single-family property
- Construction: New construction (2026 listing year)
- Exterior features: Located at 605 Sparano Loop, York, SC 29745
Interior
- Kitchen: Included as part of the living area (plan model)
- Bedrooms: 3 bedrooms
- Bathrooms: 2 full bathrooms and 1 half bathroom
- Interior features: Open living area layout
Neighborhood map
What this means for you Summary
Snapshot
- This is a 3-bed/2.5-bath townhouse listed at $236k. Condition is rated good.
Deal economics
- At list price, monthly cash flow is $449 ($5k/yr) — positive.
- The deal already cash-flows at list — no discount required.
- Meets the 1% rule at list price ($3k rent vs $236k).
- Recommended offer: $232k (1.5% below list) — sets the bar for market timing.
- Cap rate 8.6% vs local median 4.6% in York — top-decile yield for the area; either an underpriced asset or a hidden risk that comps aren't pricing in. Stress-test before assuming the spread holds.
Location & tenants
- Location reads 65/100 on livability (#139 in SC) — a middle-class / working-renter tenant base. Strengths: cost of living A+, housing A+, health & safety A+; Watch: schools D-, crime F, amenities F.
- York 01 (rural): math 31% / reading 40% proficiency, ranked #41 of 80 in SC (top 51%) — families likely to look elsewhere, expect single-tenant / working-renter base with shorter leases.
- Market conditions: 541 active listings in the ZIP; 2 comparable units currently listed for rent nearby; solid renter incomes; 2,550 units permitted in York County in 2024 (350 in 5+ unit buildings).
- This rent runs 40% of the median local income ($79k/yr) — at the standard rent-burdened threshold; future hikes will face affordability resistance.
Forward outlook
- Local home prices are declining (-3.0%/yr); year-one equity from $2k of loan paydown is wiped out by about $7k of value loss. Plan a longer hold.
- York County population projected at +44% by 2050 — long-run rental-demand tailwind backs the buy-and-hold thesis.
Negotiation context
- It's been on market 22 days — a 2% lower offer ($232k) is reasonable based on typical stale-listing flexibility.
Risks & watch-outs
- Climate carrying-cost: moderate flood risk; moderate wind risk, 24% chance of damaging wind over 30y; extreme-heat days projected 7→15/yr by 2055 (HVAC capex compounding) — expect insurance premiums to compound above CPI over the hold.
Questions for the listing agent
- Is there a deadline driving the sale (1031 exchange, divorce, estate, relocation)? That informs how much negotiation room exists.
- Schools are D-rated, which usually means shorter tenancies and higher turnover. Who's the typical renter profile here, and what's been the actual vacancy rate?
- Crime grade is F in this area — have there been break-ins, vandalism, or insurance claims at this property in the last 3 years? What carrier currently insures it and at what premium?
- What's the average days-on-market for RENTAL listings here right now (not sales)? A rising rental-DOM trend means longer vacancies and softer asking-rent achievability than the comps imply.
- What's the recent tenant-quality profile in this submarket — average credit score on applications, eviction rate, late-payment / NSF rate, and stable-employment percentage? A property-management company in the area should have these aggregated.
- How much new for-sale + rental construction is in the pipeline within 1–3 miles? Heavy new supply typically softens prices + rents 12–24 months out; constrained supply supports both.
Investment metrics
- 1% rule
- 1.11% ✓
- Cap rate
- 8.56%
- Cash-on-cash
- 8.09%
- DSCR
- 1.36
- GRM
- 7.5
CMA / ARV
- ARV (on-the-fly)
- $237,523
- Comps found
- 10
Show comp detail 10 sales within ~0.75 mi
| Address | Dist | Beds/Ba | Sqft | Sold | Price | $/sf | Match |
|---|---|---|---|---|---|---|---|
| 639 Sparano Loop | 0.02mi | 3/2.5 | 1,657 (-0%) | 1mo | $243,132 | $147 | 98 |
| 643 Sparano Loop | 0.16mi | 3/2.5 | 1,661 (0%) | 1mo | $235,000 | $141 | 92 |
| 647 Sparano Loop | 0.16mi | 3/2.5 | 1,657 (-0%) | 1mo | $237,649 | $143 | 91 |
| 625 Sparano Loop | 0.18mi | 3/2.5 | 1,661 (0%) | 1mo | $245,000 | $148 | 91 |
| 621 Sparano Loop | 0.18mi | 3/2.5 | 1,657 (-0%) | 1mo | $225,849 | $136 | 90 |
| 613 Sparano Loop | 0.21mi | 3/2.5 | 1,657 (-0%) | 1mo | $225,849 | $136 | 89 |
| 620 Sparano Loop | 0.20mi | 3/2.5 | 1,680 (+1%) | 1mo | $224,999 | $134 | 88 |
| 612 Sparano Loop | 0.20mi | 3/2.5 | 1,680 (+1%) | 1mo | $236,599 | $141 | 88 |
| 609 Sparano Loop | 0.23mi | 3/2.5 | 1,661 (0%) | 1mo | $256,000 | $154 | 88 |
| 624 Sparano Loop | 0.19mi | 3/2.5 | 1,691 (+2%) | 1mo | $267,429 | $158 | 87 |
Match score weights: distance 35% · size 25% · config 20% · recency 20%. Top-matched comps best support the ARV.
Projected returns pro-forma
-3.0% appreciation · 3.0% rent growth · sell at horizon
- IRR
- -4.0%
- Equity multiple
- 0.85×
- Total profit
- $-9,882
- Equity at exit
- $35,415
- IRR
- 5.7%
- Equity multiple
- 1.43×
- Total profit
- $28,341
- Equity at exit
- $20,537
Cash invested: $66,506 (down + closing). Projections, not guarantees.
Landlord ↔ Tenant lean methodology
- Overall (STATE)
- 90 Strongly Landlord-Friendly
- State South Carolina
- 90 Strongly Landlord-Friendly · R+6
- County
- — inherits STATE
- City
- — inherits STATE
ZIP-level market 29745
- Home prices YoY
- -30.3%
- Active inventory
- 541
- Price-to-rent
- 7.4×
Monthly cashflow live
- Estimated rent
- $2,646 medium interval (Pro) →
- Mortgage (P&I)
- −$1,246
- Tax est. 1.5%
- −$297 /mo · $3,563/yr
- Insurance
- −$99
- HOA
- −$0
- Vacancy / Maint / Mgmt
- −$556
- Net cashflow
- $449
Break-even live
UW: 25.0% down · 7.5% · 30yr · 1.5% tax · 5.0% vac · 8.0% maint · 8.0% mgmt
Financing live
Cash to close
- Down payment
- $59,381
- Closing costs
- $7,126
- Reserves months
- —
- Total cash needed
- —
Loan-product check · same deal, 3 products live
Conventional
25% down · 7.5% · 30yr
- Down + closing
- —
- Monthly P&I
- —
- Monthly cashflow
- —
- DSCR
- —
- Eligible?
- —
Personal DTI + credit; lowest rate.
DSCR
20% down · 8.5% · 30yr
- Down + closing
- —
- Monthly P&I
- —
- Monthly cashflow
- —
- DSCR
- —
- Eligible?
- —
No personal income docs; deal must DSCR.
Hard money
10% down · 12.0% · 12mo
- Down + closing
- —
- Monthly P&I
- —
- Monthly cashflow
- —
- DSCR
- —
- Eligible?
- —
Short-term bridge; refi at stabilization.
Rent comps 2 comps
| Address | Beds | Baths | Sqft | Rent | $/sqft | DOM | Units | Dist |
|---|---|---|---|---|---|---|---|---|
| 515 Trading Post Ln York, SC | 3.0 | 2.5 | 1429 | $2,300 | $1.61 | 23d | 1 | 0.80mi |
| 495 Switch St York, SC | 3.0 | 2.5 | 1928 | $2,500 | $1.30 | 3d | 1 | 0.85mi |
Listing history 14 events
-
2026-06-18days on market $235,999 Active 22 DOM
-
2026-06-17days on market $235,999 Active 21 DOM
-
2026-06-16days on market $235,999 Active 20 DOM
-
2026-06-15days on market $235,999 Active 19 DOM
-
2026-06-13days on market $235,999 Active 17 DOM
-
2026-06-10price $235,999 Active 13 DOM
-
2026-06-09days on market $250,999 Active 13 DOM
-
2026-06-08days on market $250,999 Active 12 DOM
-
2026-06-07days on market $250,999 Active 11 DOM
-
2026-06-04days on market $250,999 Active 8 DOM
-
2026-06-03days on market $250,999 Active 7 DOM
-
2026-06-02pricedays on market $250,999 Active 6 DOM
-
2026-06-01days on market $248,999 Active 5 DOM
-
2026-05-31days on market $248,999 Active 4 DOM
ⓘ Source: listings_history table (triggers on properties + properties_extension) + one-shot
backfill from property_details.listing_events for pre-trigger history.
Climate risk First Street
- Flood 5/10 Major FEMA zone X (unshaded) · 24% chance over 30 yrs
- Wildfire 3/10 Moderate
- Heat 5/10 Major 7 d/yr ≥105°F today · 15 d/yr by 30 yrs out
- Wind 5/10 Major 24% chance of damaging wind over 30 yrs
- Air quality 3/10 Moderate 3 unhealthy d/yr today · 3 by 30 yrs out
Nearby sold comps map
Loading sold comps map…
Walkable amenities ~0.75 mi
Loading nearby amenities…
Taxation est. · year 1
- Rental income
- $31,747
- − Mortgage interest
- −$13,305
- − Property taxes
- −$3,563
- − Insurance
- −$1,188
- − Repairs & maintenance
- −$2,540
- − Management
- −$2,540
- − Depreciation
- −$6,910
- Taxable income
- $1,702
- Est. tax owed @ 24.0%
- −$408
- After-tax cash flow
- $4,974/yr
For passive investors: Depreciation is non-cash, so a rental often shows a tax loss while cash-flowing — sheltering income. Rental losses are passive: they offset passive income freely, and up to $25,000/yr can offset ordinary (W-2) income if you actively participate and your MAGI is under $100k (phasing out to $0 by $150k); unused losses carry forward. On sale, claimed depreciation is recaptured at up to 25%, and gains may owe capital-gains tax (a 1031 exchange can defer both). Figures are a year-1 estimate at your 24.0% rate — not tax advice; consult a CPA.
Condition & rehab AI · 12 photos
This new two-story townhouse is in excellent condition with a modern open concept layout and well-maintained exterior. It offers a good return on investment with minimal updates needed.
Value-add opportunities
- Both Painting the exterior and interior walls — Fresh paint can enhance curb appeal and interior aesthetics.
- Both Landscaping improvements — Enhanced landscaping can increase curb appeal and property value.
- Both Adding smart home features — Smart home features can increase property value and attract tech-savvy buyers/tenants.
- Both Upgrading the kitchen appliances — Modern appliances can improve functionality and attract more buyers/tenants.
- Both Adding a smart thermostat — A smart thermostat can improve energy efficiency and attract eco-conscious buyers/tenants.
Renovation cost estimate screening
Value-add ROI direction
- Both Painting the exterior and interior walls — Fresh paint can enhance curb appeal and interior aesthetics. ↑
- Both Landscaping improvements — Enhanced landscaping can increase curb appeal and property value. ↑
- Both Adding smart home features — Smart home features can increase property value and attract tech-savvy buyers/tenants. ↑
- Both Upgrading the kitchen appliances — Modern appliances can improve functionality and attract more buyers/tenants. ↑
- Both Adding a smart thermostat — A smart thermostat can improve energy efficiency and attract eco-conscious buyers/tenants. ↑
ⓘ Cost ranges are severity-bucket heuristics (US national rule-of-thumb). Get contractor quotes + a written scope before underwriting a rehab budget.
Schools (NCES district)
- District
- York 01
- NCES district ID
- 4503810
- Math proficiency
- 31% ▼ -16.00%
- Reading proficiency
- 40% ▬ 0.00%
- Median HH income
- $44,491
- Composite
- 30.21/100
- National rank
- #6305
- State rank
- #41 of 80 in SC
Livability — York
- Score
- 65/100
- State rank
- #139
- US rank
- #13425
Category grades
Schools grade is shown separately in the Schools card above.
Census & demographics
- Census place
- York, SC
- County
- York County · 281,758 people
- City population
- 34,909
- Metro
- Charlotte-Concord-Gastonia, NC-SC
- Population (ZIP)
- 34,909
- Household income
- $79,117
- Rent vs Own
- Severe rent burden
- 321.0
Population outlook (York County) Hauer SSP2
- Today (2025)
- 307,757 people
- By 2030
- 335,979 · +9.2%
- By 2040
- 391,378 · +27.2%
- By 2050
- 443,234 · +44.0%
- By 2075
- 557,102 · +81.0%
- By 2100
- 625,837 · +103.4%
Race, ethnicity, and origin ACS 2023
- Neighborhood character
- Predominantly White (75%)
- Race & ethnicity
- White 75% Black 12% Two or more races 6% Hispanic / Latino 6% Asian 1%
- Hispanic origin (detail)
- Mexican 4%
- Common ancestry
- Romanian 3% Serbian 3% Italian 2%
- Foreign-born
- 4% · Canada
- Languages at home
- 94% English-only · Spanish 4%
Political lean MEDSL · York
- 2024 margin
- R (+19.1) · D 39.7% · R 58.8% · Other 1.5%
- 2008→2024 swing
- -1.4pp toward R · 2008: -17.7pp · 2024: -19.1pp
- All cycles
- 2024: R+19.1 2020: R+16.5 2016: R+22.1 2012: R+20.5 2008: R+17.7
Not yet ingested
- Civics
- —
Market trends
- HPI YoY
- ▼ -109.42%
- Current HPI
- 251.6848
- Rent YoY
- —
- Metro
- Charlotte-Concord-Gastonia, NC-SC
- State GDP YoY
- ▲ 4.51%
- F500 in state
- 2
Industry mix (Fortune 500 HQ in SC)
| Industry | F500 HQs | Revenue |
|---|---|---|
| Packaging | 1 | $7B |
|
||
Cash-flow waterfall
monthlySold comps — $/sqft
last 12 mo · ≤1 miLoading sold comps…