 🔨 Auction
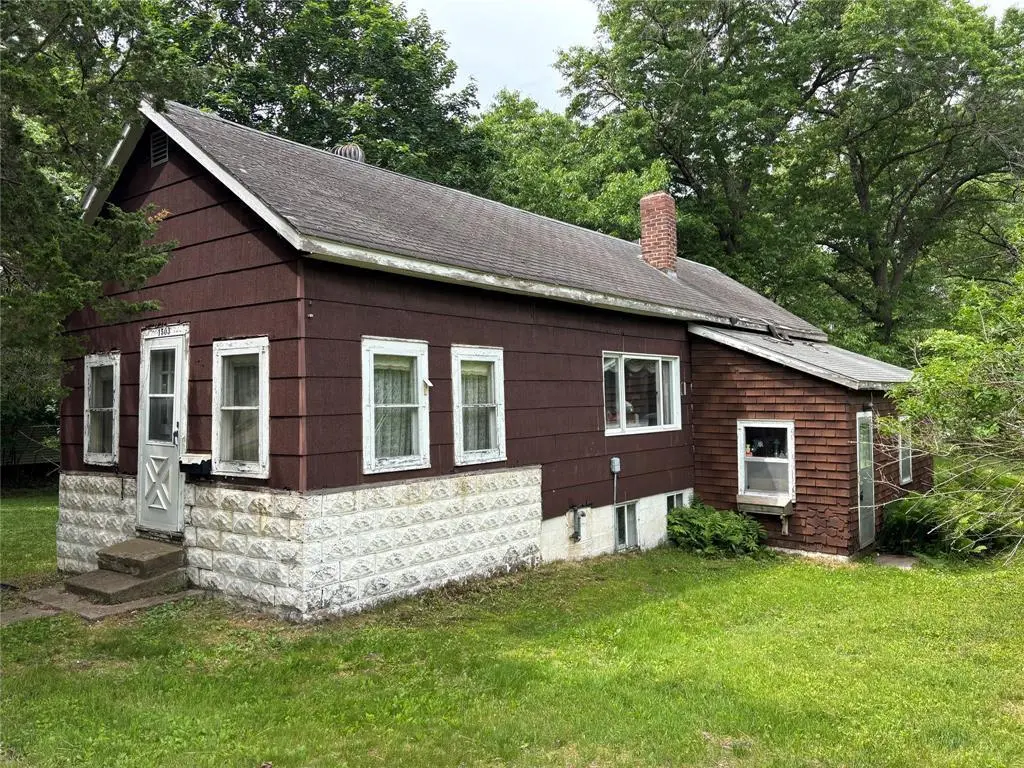
1503 4th St · Menomonie, WI
Flood risk 6/10 · Moderate
- FEMA flood zone
- X (unshaded)
- Chance of flooding over 30 yrs
- 0.7%
- Est. flood insurance / yr
- $473 – $860
Fire risk 3/10 · Minor
- Est. fire insurance / yr
- $636 – $1,182
Heat risk 2/10 · Minimal
- Hot days now (above 100°F)
- 7 days/yr
- Hot days in 30 yrs
- 14 days/yr
Wind risk 1/10 · Minimal
- Chance of severe wind over 30 yrs
- —
Air-quality risk 1/10 · Minimal
- Unhealthy air days now
- 0 days/yr
- Unhealthy air days in 30 yrs
- 0 days/yr
Risk factors via First Street. Map © Google.
Why this score? — see what drove the D grade
The composite is a weighted blend of 9 inputs, each scored 0–100. Each bar is that input's sub-score; the figure is the points it added to the 100-point composite (weight × sub-score).
- Cash flow +12.2/30.0
- ARV discount +7.5/15.0
- Livability +4.1/5.0
- DSCR +3.6/10.0
- 1% rule +3.5/10.0
- Schools +3.4/10.0
- Rent growth +3.1/5.0
- Condition / age +2.5/5.0
- Appreciation +0.0/10.0
$10,000
🖨 Deal sheet 📄 Offer letter ✓ Due diligence
Listing remarks
For Sale by Auction! List price is the starting bid - Online Auction. Auction Date: July 1, 2026 beginning to end at 6:00pm. Complete details are available upon request. 1-story home with two bedrooms, one bathroom, kitchen & living room on the main level. Lower level is unfinished. Two car attached garage. The home has a private shallow well in the basement ? Well pump is inoperable. The residence has not had water for at least one year. The home does have city sewer. It is heated by a fuel oil furnace ? 265gal. fuel oil tank in basement, no central air. Selling absolutely AS-IS. Auction is being conducted by Lee Real Estate & Auction Service. Any and all personal property left
Key facts
- 2 garage spots
- Built 1938
- Listed 17 days
Property features AI
Exterior
- Parking: Attached 2-car garage
- Utilities: Municipal sewer
- Home design: Single-family, 1-story residence; Estimated living area in the 1,001–1,250 sq ft range
- Construction: Block in cellar/basement
- Exterior features: Asphalt exterior; Garden shed/outbuilding
Interior
- Kitchen: Kitchen on main level, approximately 15 x 11
- Bedrooms: Main-level primary bedroom, approximately 11 x 11; Main-level second bedroom, approximately 11 x 11
- Bathrooms: One full bathroom
- Heating & cooling: Forced-air heating; Oil-fired heat
- Interior features: Circuit breakers; Other interior features (see remarks)
- Laundry & utility: Cellar with block construction
Neighborhood map
What this means for you Summary
Snapshot
- This is a 2-bed/1.0-bath single-family listed at $10k.
Deal economics
- At list price, monthly cash flow is $-35 ($-417/yr) — negative.
- The deal already cash-flows at list — no discount required.
- Meets the 1% rule at list price ($1k rent vs $10k).
- Recommended offer: $10k (1.5% below list) — sets the bar for market timing.
- Cap rate 6.1% vs local median 3.7% in Menomonie — top-decile yield for the area; either an underpriced asset or a hidden risk that comps aren't pricing in. Stress-test before assuming the spread holds.
Location & tenants
- Location reads 82/100 on livability (#50 in WI, #1,248 nationally) — a professional / high-income tenant draw. Strengths: cost of living A+, housing A+, health & safety A+; Watch: schools D+, employment D+, amenities F.
- Menomonie Area School District (town): math 40% / reading 40% proficiency, ranked #157 of 342 in WI (top 46%) — families likely to look elsewhere, expect single-tenant / working-renter base with shorter leases.
- Market conditions: Rents rising (+2.6%/yr); 105 active listings in the ZIP; 4 comparable units currently listed for rent nearby; rentals lingering (median 44d on market — plan ~5-8 weeks vacancy on turnover, expect pricing pressure); 50% of comp listings sitting > 30 days — soft ceiling on asking rent; 151 units permitted in Dunn County in 2024 (0 in 5+ unit buildings).
Forward outlook
- Local home prices are declining (-3.0%/yr); year-one equity from $1k of loan paydown is wiped out by about $5k of value loss. Plan a longer hold.
Negotiation context
- It's been on market 18 days — a 2% lower offer ($10k) is reasonable based on typical stale-listing flexibility.
Risks & watch-outs
- Watch-outs: property tax is 26.4% of price; built in 1938 — expect roof / HVAC / electrical / plumbing capex.
- Climate carrying-cost: major flood risk — expect insurance premiums to compound above CPI over the hold.
Questions for the listing agent
- What do current leases actually rent for vs. the listed asking? Can we see a recent rent roll and the last 12 months of T-12 income?
- Built in 1938 — when were the roof, HVAC, electrical panel, plumbing, and water heater last replaced?
- Property tax is high relative to price — has the assessment been appealed recently, and will the sale trigger a re-assessment?
- Is there a deadline driving the sale (1031 exchange, divorce, estate, relocation)? That informs how much negotiation room exists.
- Schools are D-rated, which usually means shorter tenancies and higher turnover. Who's the typical renter profile here, and what's been the actual vacancy rate?
- The area grade is low — what's the realistic commute time and amenity access for the typical tenant pool here? Any planned neighborhood developments (good or bad) we should know about?
- What's the average days-on-market for RENTAL listings here right now (not sales)? A rising rental-DOM trend means longer vacancies and softer asking-rent achievability than the comps imply.
- What's the recent tenant-quality profile in this submarket — average credit score on applications, eviction rate, late-payment / NSF rate, and stable-employment percentage? A property-management company in the area should have these aggregated.
- How much new for-sale + rental construction is in the pipeline within 1–3 miles? Heavy new supply typically softens prices + rents 12–24 months out; constrained supply supports both.
Investment metrics
- 1% rule
- 0.85% ✗
- Cap rate
- 6.06%
- Cash-on-cash
- -0.85%
- DSCR
- 0.96
- GRM
- 9.8
CMA / ARV
- ARV (on-the-fly)
- $176,000
- Comps found
- 6
Show comp detail 6 sales within ~0.75 mi
| Address | Dist | Beds/Ba | Sqft | Sold | Price | $/sf | Match |
|---|---|---|---|---|---|---|---|
| 120 W 16th Ave | 0.17mi | 2/1.0 | 1,128 (+2%) | 14mo | $102,025 | $90 | 76 |
| 302 21st Ave | 0.38mi | 3/1.0 (+1) | 1,148 (+4%) | 5mo | $192,000 | $167 | 66 |
| 602 20th Ave | 0.31mi | 3/1.0 (+1) | 1,166 (+6%) | 20mo | $186,900 | $160 | 53 |
| 2014 3rd St | 0.48mi | 3/1.5 (+1) | 1,148 (+4%) | 15mo | $178,900 | $156 | 51 |
| 2222 4th St | 0.63mi | 2/1.0 | 950 (-14%) | 3mo | $190,000 | $200 | 45 |
| E4271 528th Ave | 0.65mi | 3/1.0 (+1) | 1,038 (-6%) | 21mo | $124,900 | $120 | 38 |
Match score weights: distance 35% · size 25% · config 20% · recency 20%. Top-matched comps best support the ARV.
Projected returns pro-forma
-3.0% appreciation · 2.59% rent growth · sell at horizon
- IRR
- -18.1%
- Equity multiple
- 0.36×
- Total profit
- $-31,324
- Equity at exit
- $26,242
- IRR
- -11.2%
- Equity multiple
- 0.34×
- Total profit
- $-32,535
- Equity at exit
- $15,217
Cash invested: $49,280 (down + closing). Projections, not guarantees.
Landlord ↔ Tenant lean methodology
- Overall (STATE)
- 73 Landlord-Friendly
- State Wisconsin
- 73 Landlord-Friendly · R+2
- County
- — inherits STATE
- City
- — inherits STATE
ZIP-level market 54751
- Rents YoY
- 2.6%
- Active inventory
- 105
- Price-to-rent
- 0.6×
Monthly cashflow live
- Estimated rent
- $1,496 medium interval (Pro) →
- Mortgage (P&I)
- −$923
- Tax est. 1.5%
- −$220 /mo · $2,640/yr
- Insurance
- −$73
- HOA
- −$0
- Vacancy / Maint / Mgmt
- −$314
- Net cashflow
- $-35
Break-even live
UW: 25.0% down · 7.5% · 30yr · 1.5% tax · 5.0% vac · 8.0% maint · 8.0% mgmt
Financing live
Cash to close
- Down payment
- $44,000
- Closing costs
- $5,280
- Reserves months
- —
- Total cash needed
- —
Loan-product check · same deal, 3 products live
Conventional
25% down · 7.5% · 30yr
- Down + closing
- —
- Monthly P&I
- —
- Monthly cashflow
- —
- DSCR
- —
- Eligible?
- —
Personal DTI + credit; lowest rate.
DSCR
20% down · 8.5% · 30yr
- Down + closing
- —
- Monthly P&I
- —
- Monthly cashflow
- —
- DSCR
- —
- Eligible?
- —
No personal income docs; deal must DSCR.
Hard money
10% down · 12.0% · 12mo
- Down + closing
- —
- Monthly P&I
- —
- Monthly cashflow
- —
- DSCR
- —
- Eligible?
- —
Short-term bridge; refi at stabilization.
Rent comps 4 comps
| Address | Beds | Baths | Sqft | Rent | $/sqft | DOM | Units | Dist |
|---|---|---|---|---|---|---|---|---|
| 1320 12th Ave E Menomonie, WI | 1.0–2.0 | 1.0–2.0 | 825 | $2,050 | $2.48 | 12d | 1 | 1.11mi |
| 1910 11th Ave E Menomonie, WI | 2.0 | 2.0 | 1102 | $1,550 | $1.41 | 12d | 1 | 1.40mi |
| 1958 11th Ave E Menomonie, WI | 1.0 | 1.0 | 838 | $1,295 | $1.55 | 43d | 1 | 1.48mi |
| 1942 11th Ave E Menomonie, WI | 2.0 | 2.0 | 1102 | $1,550 | $1.41 | 43d | 1 | 1.48mi |
Listing history 14 events
-
2026-06-19days on market $10,000 Active 18 DOM
-
2026-06-18days on market $10,000 Active 17 DOM
-
2026-06-17days on market $10,000 Active 16 DOM
-
2026-06-16days on market $10,000 Active 15 DOM
-
2026-06-15days on market $10,000 Active 14 DOM
-
2026-06-14days on market $10,000 Active 12 DOM
-
2026-06-12days on market $10,000 Active 11 DOM
-
2026-06-09days on market $10,000 Active 8 DOM
-
2026-06-08days on market $10,000 Active 7 DOM
-
2026-06-07days on market $10,000 Active 6 DOM
-
2026-06-05days on market $10,000 Active 4 DOM
-
2026-06-03days on market $10,000 Active 2 DOM
-
2026-06-02remarks 691-char remark
-
2026-06-02$10,000 Active 1 DOM
ⓘ Source: listings_history table (triggers on properties + properties_extension) + one-shot
backfill from property_details.listing_events for pre-trigger history.
Climate risk First Street
- Flood 6/10 Major FEMA zone X (unshaded) · 70% chance over 30 yrs
- Wildfire 3/10 Moderate
- Heat 2/10 Low 7 d/yr ≥100°F today · 14 d/yr by 30 yrs out
- Wind 1/10 Low
- Air quality 1/10 Low 0 unhealthy d/yr today · 0 by 30 yrs out
Nearby sold comps map
Loading sold comps map…
Walkable amenities ~0.75 mi
Loading nearby amenities…
Taxation est. · year 1
- Rental income
- $17,948
- − Mortgage interest
- −$9,859
- − Property taxes
- −$2,640
- − Insurance
- −$880
- − Repairs & maintenance
- −$1,436
- − Management
- −$1,436
- − Depreciation
- −$5,120
- Taxable loss
- −$3,423
- Est. tax savings @ 24.0%
- +$821
- After-tax cash flow
- $405/yr
For passive investors: Depreciation is non-cash, so a rental often shows a tax loss while cash-flowing — sheltering income. Rental losses are passive: they offset passive income freely, and up to $25,000/yr can offset ordinary (W-2) income if you actively participate and your MAGI is under $100k (phasing out to $0 by $150k); unused losses carry forward. On sale, claimed depreciation is recaptured at up to 25%, and gains may owe capital-gains tax (a 1031 exchange can defer both). Figures are a year-1 estimate at your 24.0% rate — not tax advice; consult a CPA.
Schools (NCES district)
- District
- Menomonie Area School District
- NCES district ID
- 5509090
- Math proficiency
- 40% ▼ -1.00%
- Reading proficiency
- 40% ▲ 2.00%
- Median HH income
- $47,172
- Composite
- 34.23/100
- National rank
- #5262
- State rank
- #157 of 342 in WI
Livability — Menomonie
- Score
- 82/100
- State rank
- #50
- US rank
- #1248
Category grades
Schools grade is shown separately in the Schools card above.
Census & demographics
- Census place
- Menomonie, WI
- County
- Dunn County · 26,193 people
- City population
- 26,193
- Metro
- Menomonie, WI
- Population (ZIP)
- 26,193
- Household income
- $72,028
- Rent vs Own
- Severe rent burden
- 821.0
Population outlook (Dunn County) Hauer SSP2
- Today (2025)
- 45,435 people
- By 2030
- 45,694 · +0.6%
- By 2040
- 45,329 · -0.2%
- By 2050
- 44,343 · -2.4%
- By 2075
- 42,497 · -6.5%
- By 2100
- 40,616 · -10.6%
Race, ethnicity, and origin ACS 2023
- Neighborhood character
- Predominantly White (89%)
- Race & ethnicity
- White 89% Asian 5% Two or more races 3% Hispanic / Latino 2% Black 1%
- Common ancestry
- Portuguese 15% Romanian 6% Lithuanian 3%
- Foreign-born
- 3% · China, Canada
- Languages at home
- 94% English-only · Other Asian/Pacific 3% Spanish 1% Chinese 1%
Political lean MEDSL · Dunn
- 2024 margin
- R (+15.9) · D 41.5% · R 57.4% · Other 1.2%
- 2008→2024 swing
- -30.9pp toward R · 2008: 14.9pp · 2024: -15.9pp
- All cycles
- 2024: R+15.9 2020: R+13.9 2016: R+11.2 2012: D+5.0 2008: D+14.9
Not yet ingested
- Civics
- —
Market trends
- HPI YoY
- ▼ -134.07%
- Current HPI
- 214.7943
- Rent YoY
- ▲ 2.59%
- Metro
- Menomonie, WI
- State GDP YoY
- ▲ 2.10%
- F500 in state
- 20
Industry mix (Fortune 500 HQ in WI)
| Industry | F500 HQs | Revenue |
|---|---|---|
| Industrial Machinery | 4 | $23B |
|
||
| Industrial Technology | 2 | $36B |
|
||
| Insurance | 1 | $36B |
|
||
| Professional Services | 1 | $19B |
|
||
| Utilities | 1 | $9B |
|
||
| Consumer Goods | 1 | $3B |
|
||
Price history
1 event — show timeline
- 2026-06-01 Listed $10,000 RANWW
Property tax history
+1.7%/yrLatest (2025): $2,507 · +4.1% YoY. Source: county tax records.
Cash-flow waterfall
monthlySold comps — $/sqft
last 12 mo · ≤1 miLoading sold comps…