482 Maynard Ter SE · Atlanta, GA
Flood risk 7/10 · Major
- FEMA flood zone
- X (unshaded)
- Chance of flooding over 30 yrs
- 0.78%
- Est. flood insurance / yr
- $507 – $1,088
Fire risk 1/10 · Minimal
- Est. fire insurance / yr
- $963 – $1,789
Heat risk 5/10 · Moderate
- Hot days now (above 104°F)
- 7 days/yr
- Hot days in 30 yrs
- 18 days/yr
Wind risk 5/10 · Moderate
- Chance of severe wind over 30 yrs
- 26.0%
Air-quality risk 5/10 · Moderate
- Unhealthy air days now
- 6 days/yr
- Unhealthy air days in 30 yrs
- 8 days/yr
Risk factors via First Street. Map © Google.
Why this score? — see what drove the B- grade
The composite is a weighted blend of 9 inputs, each scored 0–100. Each bar is that input's sub-score; the figure is the points it added to the 100-point composite (weight × sub-score).
- Cash flow +25.9/30.0
- ARV discount +15.0/15.0
- DSCR +8.7/10.0
- 1% rule +5.6/10.0
- Livability +4.2/5.0
- Rent growth +3.1/5.0
- Schools +2.7/10.0
- Condition / age +2.5/5.0
- Appreciation +0.0/10.0
$424,900
🖨 Deal sheet 📄 Offer letter ✓ Due diligence
Listing remarks MLS
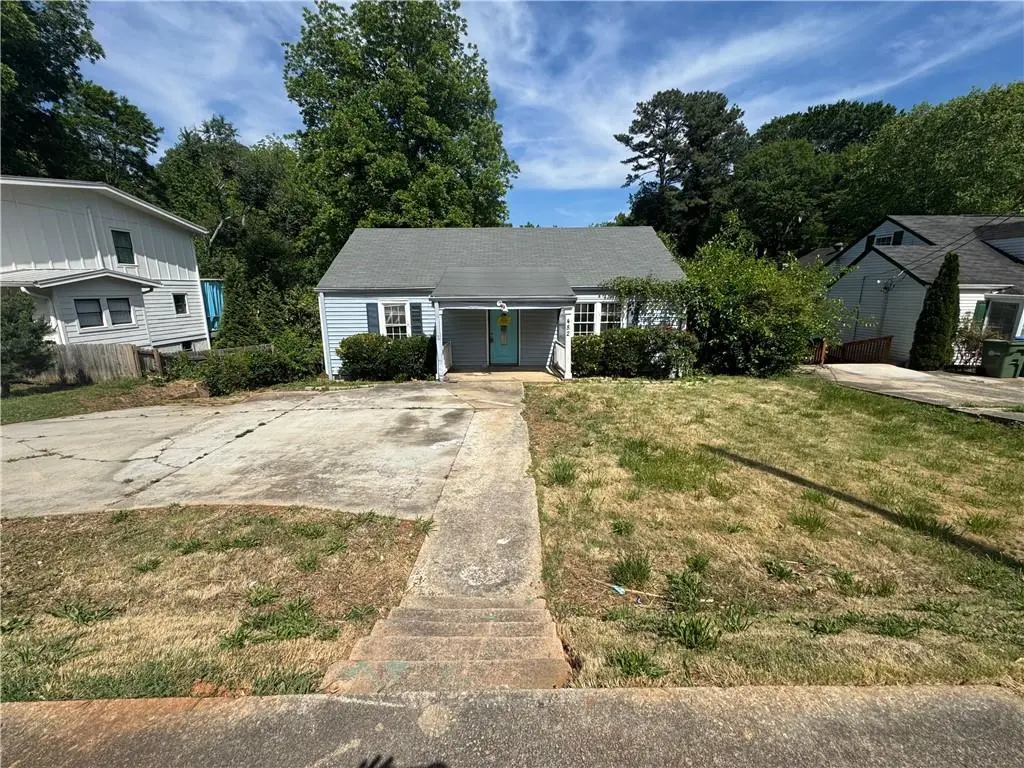
Welcome to this East Atlanta Village bungalow, perfectly situated on one of the neighborhood's most charming tree-lined streets. Step outside to a large, private backyard-perfect for entertaining, gardening, or future expansion. Enjoy morning coffee on the inviting front porch or unwind on the rear deck overlooking the fenced yard. Just minutes from East Atlanta Village's vibrant restaurants, shops, and farmers market, and zoned for highly sought-after Burgess-Peterson Academy. Easy access to I-20, the BeltLine, and nearby parks makes this home the perfect blend of convenience and community. Move-in ready and full of charm-this is intown living at its best.
Key facts
- Fenced yard
- Private backyard
- Front porch
Tags
Property features AI
Finance
- HOA & community: Community features not specifically listed
Exterior
- Parking: Driveway parking; Open parking available
- Utilities: Public water; Public sewer; Electric service not specifically listed; Other utilities
- Home design: One-level residence; Resale property
- Construction: Construction materials not specifically listed; Roof described as other
- Exterior features: Front porch; Other exterior features
Interior
- Kitchen: Kitchen with other/unspecified features; Appliances not specifically listed
- Bedrooms: Eight bedrooms on the main level
- Flooring: Flooring type not specifically listed
- Bathrooms: Two full bathrooms (both on the main level); Master bathroom with other/unspecified features
- Heating & cooling: Central air conditioning; Forced air heating
- Interior features: No common walls; Unfinished basement
- Laundry & utility: Laundry features not specifically listed
Neighborhood map
What this means for you Summary
Snapshot
- This is a 5-bed/2.0-bath single-family listed at $425k.
Deal economics
- At list price, monthly cash flow is $976 ($12k/yr) — positive.
- The deal already cash-flows at list — no discount required.
- Meets the 1% rule at list price ($5k rent vs $425k).
- Recommended offer: $419k (1.5% below list) — sets the bar for market timing.
- Cap rate 9.2% vs local median 3.1% in Atlanta — top-decile yield for the area; either an underpriced asset or a hidden risk that comps aren't pricing in. Stress-test before assuming the spread holds.
Location & tenants
- Location reads 83/100 on livability (#6 in GA, #919 nationally) — a professional / high-income tenant draw. Strengths: amenities A+, commute A+, housing A+; Watch: cost of living C-.
- Atlanta Public Schools (urban): math 28% / reading 35% proficiency, ranked #80 of 174 in GA (top 46%) — families likely to look elsewhere, expect single-tenant / working-renter base with shorter leases; 71% free/reduced lunch — lower-income household profile, screen leases tightly.
- Zoned schools: Burgess-Peterson Elementary School (math 34% / reading 54%, grade F, #336 of 1,228 statewide, top 29%, 504 students, 31% FRL); Martin L. King Jr. Middle School (math 16% / reading 23%, grade F, #356 of 470 statewide, top 78%, 818 students, 100% FRL); Maynard Jackson High School (math 30% / reading 24%, grade F, #160 of 424 statewide, top 38%, 1,474 students, 44% FRL).
- Market conditions: Rents rising (+2.3%/yr); 461 active listings in the ZIP; 7 comparable units currently listed for rent nearby; rentals at typical pace (median 24d on market — plan ~3-4 weeks tenant-placement turnaround); solid renter incomes; 1,240 units permitted in DeKalb County in 2024 (385 in 5+ unit buildings).
- At $4,509/mo this rent would consume 53% of the median local household income ($103k/yr) (locally 1897% of renters already pay >50% of income on rent) — very limited rent-growth headroom before tenants either downsize or default.
Forward outlook
- Local home prices are declining (-3.0%/yr); year-one equity from $3k of loan paydown is wiped out by about $13k of value loss. Plan a longer hold.
- DeKalb County population projected at +28% by 2050 — long-run rental-demand tailwind backs the buy-and-hold thesis.
Negotiation context
- It's been on market 23 days — a 2% lower offer ($419k) is reasonable based on typical stale-listing flexibility.
- 8 sale attempts since 4y ago with the ask held roughly flat each time — persistent listings suggest the price (not the market) is what's stuck; bring a comps-based counter.
- Current owner paid $276k; list at $425k implies a 54% gain — meaningful room to come down on a strong offer.
Risks & watch-outs
- Watch-outs: flood insurance adds $66/mo; built in 1948 — expect roof / HVAC / electrical / plumbing capex.
- Climate carrying-cost: major flood risk; moderate wind risk, 26% chance of damaging wind over 30y; extreme-heat days projected 7→18/yr by 2055 (HVAC capex compounding) — expect insurance premiums to compound above CPI over the hold.
Questions for the listing agent
- Built in 1948 — when were the roof, HVAC, electrical panel, plumbing, and water heater last replaced?
- What's the actual annual flood-insurance premium (NFIP or private), and is the property in a SFHA with mandatory coverage?
- Is there a deadline driving the sale (1031 exchange, divorce, estate, relocation)? That informs how much negotiation room exists.
- What's the average days-on-market for RENTAL listings here right now (not sales)? A rising rental-DOM trend means longer vacancies and softer asking-rent achievability than the comps imply.
- What's the recent tenant-quality profile in this submarket — average credit score on applications, eviction rate, late-payment / NSF rate, and stable-employment percentage? A property-management company in the area should have these aggregated.
- How much new for-sale + rental construction is in the pipeline within 1–3 miles? Heavy new supply typically softens prices + rents 12–24 months out; constrained supply supports both.
Investment metrics
- 1% rule
- 1.06% ✓
- Cap rate
- 9.24%
- Cash-on-cash
- 10.52%
- DSCR
- 1.47
- GRM
- 7.9
CMA / ARV
- ARV (on-the-fly)
- $654,789
- Comps found
- 12
Show comp detail 12 sales within ~0.75 mi
| Address | Dist | Beds/Ba | Sqft | Sold | Price | $/sf | Match |
|---|---|---|---|---|---|---|---|
| 463 Pasley Ave SE | 0.17mi | 4/2.0 (-1) | 1,890 (+0%) | 4mo | $685,000 | $362 | 84 |
| 1705 Braeburn Dr SE | 0.44mi | 4/3.0 (-1) | 1,831 (-3%) | 2mo | $694,000 | $379 | 64 |
| 479 Clifton St SE | 0.12mi | 4/2.5 (-1) | 2,052 (+9%) | 13mo | $699,900 | $341 | 62 |
| 1351 Milton Pl SE | 0.63mi | 4/2.0 (-1) | 1,987 (+5%) | 4mo | $699,000 | $352 | 53 |
| 1593 Van Epps St SE | 0.28mi | 4/3.0 (-1) | 2,100 (+11%) | 7mo | $700,000 | $333 | 53 |
| 620 Flat Shoals Ave SE | 0.49mi | 4/2.0 (-1) | 1,754 (-7%) | 9mo | $699,900 | $399 | 52 |
| 1721 Clifton Way SE | 0.31mi | 4/2.0 (-1) | 1,704 (-10%) | 16mo | $575,000 | $337 | 51 |
| 1250 Oak Grove Ave SE | 0.72mi | 4/3.0 (-1) | 2,006 (+6%) | 3mo | $690,000 | $344 | 44 |
| 1221 Oakfield Dr SE | 0.74mi | 4/2.0 (-1) | 1,795 (-5%) | 12mo | $707,000 | $394 | 42 |
| 1334 Milton Pl SE | 0.65mi | 4/3.0 (-1) | 1,990 (+6%) | 11mo | $690,000 | $347 | 42 |
| 240 Lamon Ave SE | 0.47mi | 4/2.5 (-1) | 2,122 (+12%) | 12mo | $530,000 | $250 | 41 |
| 1977 Nash Ave SE | 0.64mi | 4/3.5 (-1) | 2,016 (+7%) | 12mo | $537,700 | $267 | 38 |
Match score weights: distance 35% · size 25% · config 20% · recency 20%. Top-matched comps best support the ARV.
Projected returns pro-forma
-3.0% appreciation · 2.33% rent growth · sell at horizon
- IRR
- -2.2%
- Equity multiple
- 0.92×
- Total profit
- $-9,850
- Equity at exit
- $63,354
- IRR
- 6.8%
- Equity multiple
- 1.49×
- Total profit
- $58,651
- Equity at exit
- $36,738
Cash invested: $118,972 (down + closing). Projections, not guarantees.
Landlord ↔ Tenant lean methodology
- Overall (STATE)
- 90 Strongly Landlord-Friendly
- State Georgia
- 90 Strongly Landlord-Friendly · R+3
- County
- — inherits STATE
- City
- — inherits STATE
ZIP-level market 30316
- Rents YoY
- 2.3%
- Active inventory
- 461
- Price-to-rent
- 7.9×
Monthly cashflow live
- Estimated rent
- $4,509 high interval (Pro) →
- Mortgage (P&I)
- −$2,228
- Tax from tax record
- −$114 /mo · $1,371/yr
- Insurance
- −$177
- Flood insurance flood zone
- −$66 /mo · $798/yr
- HOA
- −$0
- Vacancy / Maint / Mgmt
- −$947
- Net cashflow
- $976
Break-even live
UW: 25.0% down · 7.5% · 30yr · 1.5% tax · 5.0% vac · 8.0% maint · 8.0% mgmt
Financing live
Cash to close
- Down payment
- $106,225
- Closing costs
- $12,747
- Reserves months
- —
- Total cash needed
- —
Loan-product check · same deal, 3 products live
Conventional
25% down · 7.5% · 30yr
- Down + closing
- —
- Monthly P&I
- —
- Monthly cashflow
- —
- DSCR
- —
- Eligible?
- —
Personal DTI + credit; lowest rate.
DSCR
20% down · 8.5% · 30yr
- Down + closing
- —
- Monthly P&I
- —
- Monthly cashflow
- —
- DSCR
- —
- Eligible?
- —
No personal income docs; deal must DSCR.
Hard money
10% down · 12.0% · 12mo
- Down + closing
- —
- Monthly P&I
- —
- Monthly cashflow
- —
- DSCR
- —
- Eligible?
- —
Short-term bridge; refi at stabilization.
Rent comps 7 comps
| Address | Beds | Baths | Sqft | Rent | $/sqft | DOM | Units | Dist |
|---|---|---|---|---|---|---|---|---|
| 132 Leslie St SE Atlanta, GA | 6.0 | 2.0 | 2100 | $1,100 | $0.52 | 24d | 1 | 0.77mi |
| 2017 Memorial Dr SE Atlanta, GA | 5.0 | 2.5 | 2100 | $6,500 | $3.10 | 1d | 1 | 0.86mi |
| 1084 Sanders Ave SE Unit A-B Atlanta, GA | 4.0 | 3.0 | 2550 | $5,500 | $2.16 | 24d | 1 | 0.97mi |
| 205 Whitefoord Ave NE Unit A Atlanta, GA | 4.0 | 3.0 | 1922 | $4,500 | $2.34 | 17d | 1 | 1.31mi |
| 1892 Terry Mill Rd SE Atlanta, GA | 4.0 | 2.0 | 1925 | $2,975 | $1.55 | 43d | 1 | 1.34mi |
| 1146 Wade St NE Atlanta, GA | 4.0 | 2.0 | 1800 | $5,000 | $2.78 | 21d | 1 | 1.37mi |
| 256 Casson St NE Atlanta, GA | 4.0 | 3.0 | 1846 | $4,995 | $2.71 | 24d | 1 | 1.44mi |
Listing history 25 events
-
2026-06-07statusdays on market $424,900 Pending 23 DOM
-
2026-06-04days on market $424,900 Active 22 DOM
-
2026-06-03days on market $424,900 Active 21 DOM
-
2026-06-02days on market $424,900 Active 20 DOM
-
2026-06-01days on market $424,900 Active 19 DOM
-
2026-05-31days on market $424,900 Active 18 DOM
-
2026-05-12$424,900 New 665-char remark
Show marketing remark (665 chars)
Welcome to this East Atlanta Village bungalow, perfectly situated on one of the neighborhood's most charming tree-lined streets. Step outside to a large, private backyard-perfect for entertaining, gardening, or future expansion. Enjoy morning coffee on the inviting front porch or unwind on the rear deck overlooking the fenced yard. Just minutes from East Atlanta Village's vibrant restaurants, shops, and farmers market, and zoned for highly sought-after Burgess-Peterson Academy. Easy access to I-20, the BeltLine, and nearby parks makes this home the perfect blend of convenience and community. Move-in ready and full of charm-this is intown living at its best.
-
2026-05-12$424,900 Active 689-char remark
Show marketing remark (665 chars)
Welcome to this East Atlanta Village bungalow, perfectly situated on one of the neighborhood's most charming tree-lined streets. Step outside to a large, private backyard-perfect for entertaining, gardening, or future expansion. Enjoy morning coffee on the inviting front porch or unwind on the rear deck overlooking the fenced yard. Just minutes from East Atlanta Village's vibrant restaurants, shops, and farmers market, and zoned for highly sought-after Burgess-Peterson Academy. Easy access to I-20, the BeltLine, and nearby parks makes this home the perfect blend of convenience and community. Move-in ready and full of charm-this is intown living at its best.
-
2025-04-23historical
-
2025-04-23historical
-
2025-03-14$450,000 New
-
2025-03-14$450,000 Active
-
2022-12-28soldstatus $276,500
-
2022-12-22soldstatus $180,000 Closed
-
2022-12-22soldstatus $180,000 Sold
-
2022-12-06status Under Contract
-
2022-12-06status Pending
-
2022-11-03price $299,900
-
2022-11-03price $299,900
-
2022-10-31status Back On Market
-
2022-10-31status Active
-
2022-10-27status Under Contract
-
2022-10-27status Pending
-
2022-10-06$350,000 Active
-
2022-10-06$350,000 New
ⓘ Source: listings_history table (triggers on properties + properties_extension) + one-shot
backfill from property_details.listing_events for pre-trigger history.
Tax reassessment forecast GA · Resets to sale price
- Current annual tax
- $1,371 · $114/mo
- Projected year-2 tax
- $3,909 · $326/mo
- Expected delta
- +$2,538/yr (+$211/mo · 185.0%)
ⓘ Screening estimate from a state-policy table — verify with the county assessor before closing.
Climate risk First Street
- Flood 7/10 Severe FEMA zone X (unshaded) · 78% chance over 30 yrs
- Wildfire 1/10 Low
- Heat 5/10 Major 7 d/yr ≥104°F today · 18 d/yr by 30 yrs out
- Wind 5/10 Major 26% chance of damaging wind over 30 yrs
- Air quality 5/10 Major 6 unhealthy d/yr today · 8 by 30 yrs out
Nearby sold comps map
Loading sold comps map…
Walkable amenities ~0.75 mi
Loading nearby amenities…
Taxation est. · year 1
- Rental income
- $54,108
- − Mortgage interest
- −$23,801
- − Property taxes
- −$1,371
- − Insurance
- −$2,922
- − Repairs & maintenance
- −$4,329
- − Management
- −$4,329
- − Depreciation
- −$12,361
- Taxable income
- $4,996
- Est. tax owed @ 24.0%
- −$1,199
- After-tax cash flow
- $10,514/yr
For passive investors: Depreciation is non-cash, so a rental often shows a tax loss while cash-flowing — sheltering income. Rental losses are passive: they offset passive income freely, and up to $25,000/yr can offset ordinary (W-2) income if you actively participate and your MAGI is under $100k (phasing out to $0 by $150k); unused losses carry forward. On sale, claimed depreciation is recaptured at up to 25%, and gains may owe capital-gains tax (a 1031 exchange can defer both). Figures are a year-1 estimate at your 24.0% rate — not tax advice; consult a CPA.
Schools (NCES district)
- District
- Atlanta Public Schools
- NCES district ID
- 1300120
- Math proficiency
- 28% ▼ -6.00%
- Reading proficiency
- 35% ▼ -2.00%
- Median HH income
- $48,306
- Composite
- 27.27/100
- National rank
- #7006
- State rank
- #80 of 174 in GA
Livability — Atlanta
- Score
- 83/100
- State rank
- #6
- US rank
- #919
Category grades
Schools grade is shown separately in the Schools card above.
Census & demographics
- Census place
- Atlanta, GA
- County
- Dekalb County · 782,738 people
- City population
- 629,525
- Metro
- Atlanta-Sandy Springs-Alpharetta, GA
- Population (ZIP)
- 35,107
- Household income
- $102,891
- Rent vs Own
- Severe rent burden
- 1897.0
Population outlook (DeKalb County) Hauer SSP2
- Today (2025)
- 839,977 people
- By 2030
- 891,768 · +6.2%
- By 2040
- 988,894 · +17.7%
- By 2050
- 1,074,583 · +27.9%
- By 2075
- 1,245,026 · +48.2%
- By 2100
- 1,303,135 · +55.1%
Race, ethnicity, and origin ACS 2023
- Neighborhood character
- Diverse neighborhood (Simpson 0.64)
- Race & ethnicity
- Black 47% White 36% Hispanic / Latino 8% Two or more races 7% Asian 4%
- Hispanic origin (detail)
- Mexican 4%
- Common ancestry
- Lithuanian 2% Romanian 2% Slovak 1%
- Foreign-born
- 6% · Canada
- Languages at home
- 93% English-only · Spanish 4% French/Haitian/Cajun 1% Other Indo-European 1%
Political lean MEDSL · DeKalb
- 2024 margin
- Solid D (+64.8) · D 81.9% · R 17.1% · Other 1.0%
- 2008→2024 swing
- +6.1pp toward D · 2008: 58.6pp · 2024: 64.8pp
- All cycles
- 2024: D+64.8 2020: D+67.4 2016: D+64.8 2012: D+56.8 2008: D+58.6
Not yet ingested
- Civics
- —
Market trends
- HPI YoY
- ▼ -415.92%
- Current HPI
- 318.454
- Rent YoY
- ▲ 2.33%
- Metro
- Atlanta-Sandy Springs-Alpharetta, GA
- State GDP YoY
- ▲ 2.66%
- F500 in state
- 28
Industry mix (Fortune 500 HQ in GA)
| Industry | F500 HQs | Revenue |
|---|---|---|
| Paper / Packaging | 2 | $29B |
|
||
| Retail | 1 | $160B |
|
||
| Transportation / Logistics | 1 | $91B |
|
||
| Airlines | 1 | $62B |
|
||
| Consumer Goods | 1 | $47B |
|
||
| Utilities | 1 | $25B |
|
||
Price history
+21.4% since first listed21 events — show timeline
- 2026-06-05 Pending — GAMLS
- 2026-06-05 Pending — FMLS
- 2026-05-12 Listed $424,900 FMLS
- 2026-05-12 Listed $424,900 GAMLS
- 2025-04-23 Listing Removed — FMLS
- 2025-04-23 Listing Removed — GAMLS
- 2025-03-14 Listed $450,000 FMLS
- 2025-03-14 Listed $450,000 GAMLS
- 2022-12-28 Sold (Public Records) $276,500 Public Records
- 2022-12-22 Sold (MLS) $180,000 FMLS
- 2022-12-22 Sold (MLS) $180,000 GAMLS
- 2022-12-06 Pending — GAMLS
- 2022-12-06 Pending — FMLS
- 2022-11-03 Price Changed $299,900 GAMLS
- 2022-11-03 Price Changed $299,900 FMLS
- 2022-10-31 Relisted — GAMLS
- 2022-10-31 Relisted — FMLS
- 2022-10-27 Pending — GAMLS
- 2022-10-27 Pending — FMLS
- 2022-10-06 Listed $350,000 FMLS
- 2022-10-06 Listed $350,000 GAMLS
Property tax history
+0.5%/yrLatest (2025): $1,371 · +12.8% YoY. Source: county tax records.
Cash-flow waterfall
monthlySold comps — $/sqft
last 12 mo · ≤1 miLoading sold comps…