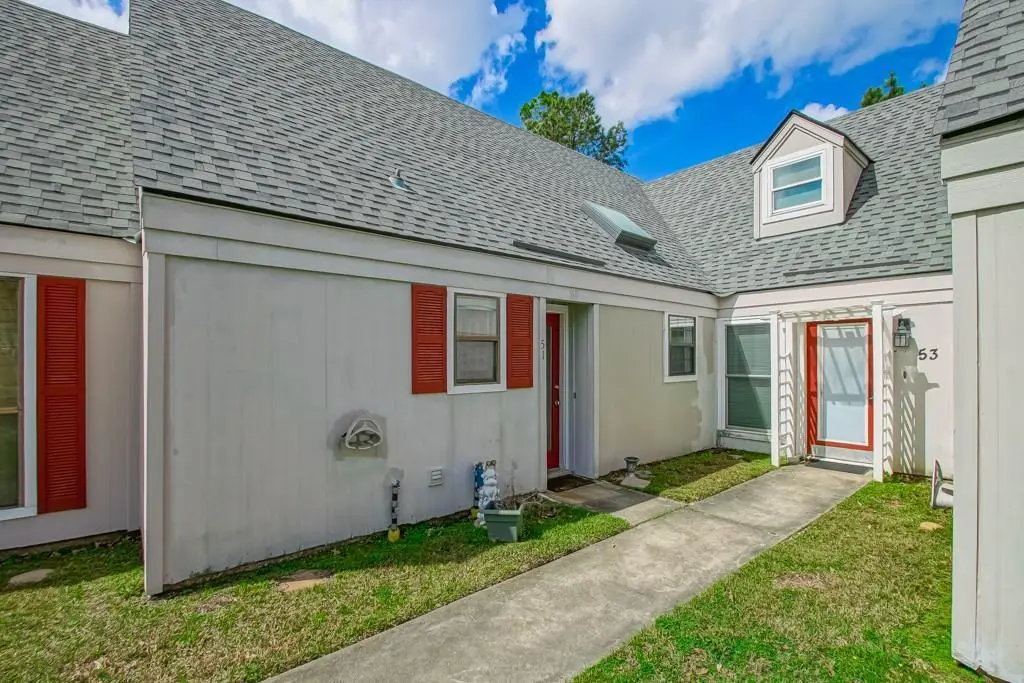
51 Hollycrest Blvd #51 · Covington, LA
Flood risk No data
- FEMA flood zone
- —
- Chance of flooding over 30 yrs
- —
- Est. flood insurance / yr
- —
Fire risk No data
- Est. fire insurance / yr
- —
Heat risk No data
- Hot days now (above threshold)
- —
- Hot days in 30 yrs
- —
Wind risk No data
- Chance of severe wind over 30 yrs
- —
Air-quality risk No data
- Unhealthy air days now
- —
- Unhealthy air days in 30 yrs
- —
Risk factors via First Street. Map © Google.
Why this score? — see what drove the C grade
The composite is a weighted blend of 9 inputs, each scored 0–100. Each bar is that input's sub-score; the figure is the points it added to the 100-point composite (weight × sub-score).
- ARV discount +15.0/15.0
- Cash flow +14.5/30.0
- 1% rule +7.6/10.0
- DSCR +4.4/10.0
- Schools +4.3/10.0
- Livability +3.8/5.0
- Rent growth +3.6/5.0
- Condition / age +2.2/5.0
- Appreciation +0.0/10.0
$135,000
🖨 Deal sheet 📄 Offer letter ✓ Due diligence
Listing remarks MLS
HOLLYCREST...Great opportunity to own a 2-bedroom condo for an affordable price, conveniently located to the interstate and major Covington shopping, restaurants, etc. This condo features all ceramic floors downstairs, fireplace, large primary suite on the first floor, patio backing up to pool and tennis court access! Upstairs features an oversized bedroom with vaulted ceilings, double closets and wood beams, full bath, plus a loft area that could be used for office, guest space etc. This condo is priced to sell. Condo dues include use of pool and tennis/ pickleball court. Call today for your private tour!
Key facts
- Oversized bedroom
- Ceramic floors
- Vaulted ceilings
Tags
Neighborhood map
What this means for you Summary
Snapshot
- This is a 2-bed/2.0-bath condo listed at $135k. Condition is rated fair.
Deal economics
- At list price, monthly cash flow is $30 ($361/yr) — positive.
- The deal already cash-flows at list — no discount required.
- Meets the 1% rule at list price ($2k rent vs $135k).
- Recommended offer: $123k (9.0% below list) — sets the bar for market timing.
- Cap rate 6.6% vs local median 3.9% in Covington — top-decile yield for the area; either an underpriced asset or a hidden risk that comps aren't pricing in. Stress-test before assuming the spread holds.
Location & tenants
- Location reads 75/100 on livability (#17 in LA, #3,876 nationally) — a middle-class / working-renter tenant base. Strengths: employment A+, housing A+, health & safety A+; Watch: amenities F, commute F.
- St. Tammany Parish (suburban): math 43% / reading 55% proficiency, ranked #11 of 98 in LA (top 11%) — families likely to look elsewhere, expect single-tenant / working-renter base with shorter leases.
- Market conditions: Rents rising fast (+4.3%/yr); 524 active listings in the ZIP; 27 comparable units currently listed for rent nearby; rentals at typical pace (median 21d on market — plan ~3-4 weeks tenant-placement turnaround); solid renter incomes; 1,064 units permitted in St. Tammany Parish in 2024 (0 in 5+ unit buildings).
Forward outlook
- Local home prices are declining (-3.0%/yr); year-one equity from $933 of loan paydown is wiped out by about $4k of value loss. Plan a longer hold.
- St. Tammany County population projected at +27% by 2050 — long-run rental-demand tailwind backs the buy-and-hold thesis.
Negotiation context
- It's been on market 108 days — a 9% lower offer ($123k) is reasonable based on typical stale-listing flexibility.
- 4 sale attempts with the ask held roughly flat each time — persistent listings suggest the price (not the market) is what's stuck; bring a comps-based counter.
Risks & watch-outs
- Watch-outs: HOA is 22% of rent.
Questions for the listing agent
- It's been on market 108 days. Have you received any prior offers? Is the seller open to a 9% concession, seller financing, or rate buy-down credit?
- Have any recent inspections been done? Can we get a copy of the seller's disclosures and any deferred-maintenance estimates?
- What does the HOA fee cover, when was the last increase, and are there any pending special assessments or reserve-fund shortfalls?
- Any open or pending special assessments — roof, HVAC, plumbing, elevator, façade? What's the per-unit balance and payoff schedule, and is the seller paying it off at close or rolling it to the buyer?
- Why hasn't it sold? Are there any deal-killer items the seller is aware of (foundation, flood, title, zoning, code violations)?
- Is there a deadline driving the sale (1031 exchange, divorce, estate, relocation)? That informs how much negotiation room exists.
- Schools are B-rated — typically a magnet for longer-tenancy family renters. What's the average tenant stay here, and is there a school-zone premium baked into asking?
- What's the average days-on-market for RENTAL listings here right now (not sales)? A rising rental-DOM trend means longer vacancies and softer asking-rent achievability than the comps imply.
- What's the recent tenant-quality profile in this submarket — average credit score on applications, eviction rate, late-payment / NSF rate, and stable-employment percentage? A property-management company in the area should have these aggregated.
- How much new apartment / multifamily construction is in the pipeline within 1–3 miles? Heavy new supply (>2% of stock underway) typically softens rents 12–24 months out; light construction supports rent growth.
Investment metrics
- 1% rule
- 1.26% ✓
- Cap rate
- 6.56%
- Cash-on-cash
- 0.96%
- DSCR
- 1.04
- GRM
- 6.6
CMA / ARV
- ARV (median comp)
- $193,611
- List price
- $135,000
- Delta
- -30.27%
- Verdict
- UNDERPRICED
- Comps
- 20 within 1.0 mi
Projected returns pro-forma
-3.0% appreciation · 4.31% rent growth · sell at horizon
- IRR
- -12.5%
- Equity multiple
- 0.54×
- Total profit
- $-17,435
- Equity at exit
- $20,129
- IRR
- -0.7%
- Equity multiple
- 0.94×
- Total profit
- $-2,114
- Equity at exit
- $11,672
Cash invested: $37,800 (down + closing). Projections, not guarantees.
Landlord ↔ Tenant lean methodology
- Overall (STATE)
- 90 Strongly Landlord-Friendly
- State Louisiana
- 90 Strongly Landlord-Friendly · R+12
- County
- — inherits STATE
- City
- — inherits STATE
ZIP-level market 70433
- Rents YoY
- 4.3%
- Active inventory
- 524
- Price-to-rent
- 6.6×
Monthly cashflow live
- Estimated rent
- $1,698 high interval (Pro) →
- Mortgage (P&I)
- −$708
- Tax est. 1.5%
- −$169 /mo · $2,025/yr
- Insurance
- −$56
- HOA
- −$378
- Vacancy / Maint / Mgmt
- −$356
- Net cashflow
- $30
Break-even live
UW: 25.0% down · 7.5% · 30yr · 1.5% tax · 5.0% vac · 8.0% maint · 8.0% mgmt
Financing live
Cash to close
- Down payment
- $33,750
- Closing costs
- $4,050
- Reserves months
- —
- Total cash needed
- —
Loan-product check · same deal, 3 products live
Conventional
25% down · 7.5% · 30yr
- Down + closing
- —
- Monthly P&I
- —
- Monthly cashflow
- —
- DSCR
- —
- Eligible?
- —
Personal DTI + credit; lowest rate.
DSCR
20% down · 8.5% · 30yr
- Down + closing
- —
- Monthly P&I
- —
- Monthly cashflow
- —
- DSCR
- —
- Eligible?
- —
No personal income docs; deal must DSCR.
Hard money
10% down · 12.0% · 12mo
- Down + closing
- —
- Monthly P&I
- —
- Monthly cashflow
- —
- DSCR
- —
- Eligible?
- —
Short-term bridge; refi at stabilization.
Rent comps 27 comps
| Address | Beds | Baths | Sqft | Rent | $/sqft | DOM | Units | Dist |
|---|---|---|---|---|---|---|---|---|
| 445 Tiger Ave Covington, LA | 3.0 | 2.0 | 1538 | $2,300 | $1.50 | 23d | 1 | 0.06mi |
| 3 Hollycrest Blvd Covington, LA | 2.0 | 2.0 | 1413 | $1,495 | $1.06 | 2d | 1 | 0.12mi |
| 308 Robinhood Dr Covington, LA | 3.0 | 2.0 | 1650 | $1,800 | $1.09 | 3d | 1 | 0.16mi |
| 110 Robinhood Dr Covington, LA | 3.0 | 2.0 | 1600 | $1,500 | $0.94 | 43d | 1 | 0.23mi |
| 28 Park Place Dr Covington, LA | 1.0–3.0 | 1.0–2.0 | 963 | $1,253 | $1.30 | 1d | 9 | 0.28mi |
| 19425 Slemmer Rd Unit 2 Covington, LA | 3.0 | 2.0 | 1100 | $1,100 | $1.00 | 21d | 1 | 0.32mi |
| 350 Emerald Forest Blvd Covington, LA | 1.0–2.0 | 1.0–2.0 | 845 | $1,600 | $1.89 | 11d | 2 | 0.39mi |
| 140 Holiday Blvd Covington, LA | 2.0 | 1.0–2.0 | 652 | $1,525 | $2.34 | 1d | 12 | 0.42mi |
| 100 Covington Meadow Cir Unit D Covington, LA | 3.0 | 2.5 | 1356 | $1,600 | $1.18 | 17d | 1 | 0.49mi |
| 103 Covington Meadow Cir Unit E Covington, LA | 3.0 | 2.5 | 1476 | $1,700 | $1.15 | 23d | 1 | 0.49mi |
| 103 Covington Meadow Cir Unit F Covington, LA | 3.0 | 2.5 | 1476 | $1,700 | $1.15 | 43d | 1 | 0.49mi |
| 104 Covington Meadow Cir Unit I Covington, LA | 3.0 | 2.5 | 1476 | $1,600 | $1.08 | 23d | 1 | 0.51mi |
| 312 Lismore Ln Covington, LA | 3.0 | 2.5 | 1521 | $2,900 | $1.91 | 23d | 1 | 0.56mi |
| 164 Golden Meadow Dr Covington, LA | 1.0 | 2.0 | 1100 | $1,350 | $1.23 | 19d | 1 | 0.61mi |
| 2021 Sullivan Ln Covington, LA | 1.0–2.0 | 1.0–2.0 | 860 | $1,856 | $2.16 | 2d | 18 | 0.97mi |
| 70040 2nd St Covington, LA | 3.0 | 2.0 | 1416 | $2,000 | $1.41 | 3d | 1 | 1.01mi |
| 70045 3rd St Covington, LA | 3.0 | 2.0 | 1430 | $1,750 | $1.22 | 3d | 1 | 1.04mi |
| 1612 Versailles Business Pkwy Covington, LA | 1.0–2.0 | 1.0–2.0 | 1009 | $2,089 | $2.07 | 2d | 31 | 1.06mi |
| 70076 6th St Covington, LA | 3.0 | 2.0 | 1151 | $1,600 | $1.39 | 23d | 1 | 1.23mi |
| 70403 L St Covington, LA | 3.0 | 2.0 | 1250 | $1,695 | $1.36 | 43d | 1 | 1.29mi |
| 70361 D St Covington, LA | 3.0 | 2.0 | 1409 | $1,750 | $1.24 | 23d | 1 | 1.32mi |
| 126 Pear St Unit A Covington, LA | 3.0 | 2.0 | 1383 | $1,600 | $1.16 | 23d | 1 | 1.33mi |
| 219 Beech St Covington, LA | 3.0 | 2.0 | 1250 | $1,500 | $1.20 | 43d | 1 | 1.35mi |
| 70330 A St Covington, LA | 3.0 | 2.0 | 1163 | $1,600 | $1.38 | 19d | 1 | 1.35mi |
| 70096 10th St Covington, LA | 3.0 | 2.0 | 1391 | $1,950 | $1.40 | 17d | 1 | 1.38mi |
| 70266 7th St Covington, LA | 3.0 | 2.0 | 1736 | $1,575 | $0.91 | 43d | 1 | 1.49mi |
| 70252 8th St Covington, LA | 3.0 | 2.0 | 1230 | $1,650 | $1.34 | 23d | 1 | 1.50mi |
HOA detail condo
- Monthly dues
- $378 · $4,536/yr
- Likely covers
- pool
- Assessments
- None detected in remarks — confirm with the listing agent.
Listing history 19 events
-
2026-06-18days on market $135,000 Active 108 DOM
-
2026-06-17days on market $135,000 Active 107 DOM
-
2026-06-16days on market $135,000 Active 106 DOM
-
2026-06-15days on market $135,000 Active 105 DOM
-
2026-06-13days on market $135,000 Active 103 DOM
-
2026-06-10days on market $135,000 Active 100 DOM
-
2026-06-09days on market $135,000 Active 99 DOM
-
2026-06-08days on market $135,000 Active 98 DOM
-
2026-06-07days on market $135,000 Active 97 DOM
-
2026-06-03days on market $135,000 Active 93 DOM
-
2026-06-02days on market $135,000 Active 92 DOM
-
2026-06-01days on market $135,000 Active 91 DOM
-
2026-05-31days on market $135,000 Active 90 DOM
-
2026-03-02$135,000 Active 613-char remark
Show marketing remark (615 chars)
HOLLYCREST. .. Great opportunity to own a 2-bedroom condo for an affordable price, conveniently located to the interstate and major Covington shopping, restaurants, etc. This condo features all ceramic floors downstairs, fireplace, large primary suite on the first floor, patio backing up to pool and tennis court access! Upstairs features an oversized bedroom with vaulted ceilings, double closets and wood beams, full bath, plus a loft area that could be used for office, guest space etc. This condo is priced to sell. Condo dues include use of pool and tennis/ pickleball court. Call today for your private tour!
-
2026-03-02$135,000 Active 615-char remark
Show marketing remark (615 chars)
HOLLYCREST. .. Great opportunity to own a 2-bedroom condo for an affordable price, conveniently located to the interstate and major Covington shopping, restaurants, etc. This condo features all ceramic floors downstairs, fireplace, large primary suite on the first floor, patio backing up to pool and tennis court access! Upstairs features an oversized bedroom with vaulted ceilings, double closets and wood beams, full bath, plus a loft area that could be used for office, guest space etc. This condo is priced to sell. Condo dues include use of pool and tennis/ pickleball court. Call today for your private tour!
-
2025-09-24price $140,000
-
2025-09-24price $140,000
-
2025-08-15$145,000 Active
-
2025-08-15$140,000 Active
ⓘ Source: listings_history table (triggers on properties + properties_extension) + one-shot
backfill from property_details.listing_events for pre-trigger history.
Nearby sold comps map
Loading sold comps map…
Walkable amenities ~0.75 mi
Loading nearby amenities…
Taxation est. · year 1
- Rental income
- $20,370
- − Mortgage interest
- −$7,562
- − Property taxes
- −$2,025
- − Insurance
- −$675
- − Repairs & maintenance
- −$1,630
- − Management
- −$1,630
- − HOA
- −$4,536
- − Depreciation
- −$3,927
- Taxable loss
- −$1,614
- Est. tax savings @ 24.0%
- +$387
- After-tax cash flow
- $748/yr
For passive investors: Depreciation is non-cash, so a rental often shows a tax loss while cash-flowing — sheltering income. Rental losses are passive: they offset passive income freely, and up to $25,000/yr can offset ordinary (W-2) income if you actively participate and your MAGI is under $100k (phasing out to $0 by $150k); unused losses carry forward. On sale, claimed depreciation is recaptured at up to 25%, and gains may owe capital-gains tax (a 1031 exchange can defer both). Figures are a year-1 estimate at your 24.0% rate — not tax advice; consult a CPA.
Condition & rehab AI · 13 photos
This 2-bedroom condo requires moderate updates to its kitchen and bathroom, as well as some exterior repairs. With these updates, it could significantly increase its resale and rental value.
Repairs flagged
- Moderate kitchen cabinets — dated and in need of updating
- Moderate bathroom vanity — dated and in need of updating
- Minor exterior siding — some discoloration
Value-add opportunities
- Both update kitchen cabinets and backsplash — modernizing the kitchen would appeal to both buyers and renters
- Both update bathroom vanity and fixtures — modernizing the bathroom would appeal to both buyers and renters
- Both paint interior walls — fresh paint would improve the home's curb appeal and interior aesthetics
Renovation cost estimate screening
| Repair item | Severity | Est. cost |
|---|---|---|
| kitchen cabinets · dated and in need of updating | Moderate | $3,000–15,000 |
| bathroom vanity · dated and in need of updating | Moderate | $3,000–15,000 |
| exterior siding · some discoloration | Minor | $500–3,000 |
| Total estimated repair cost · 3 items | $6,500–33,000 |
Value-add ROI direction
- Both update kitchen cabinets and backsplash — modernizing the kitchen would appeal to both buyers and renters ↑
- Both update bathroom vanity and fixtures — modernizing the bathroom would appeal to both buyers and renters ↑
- Both paint interior walls — fresh paint would improve the home's curb appeal and interior aesthetics ↑
ⓘ Cost ranges are severity-bucket heuristics (US national rule-of-thumb). Get contractor quotes + a written scope before underwriting a rehab budget.
Schools (NCES district)
- District
- St. Tammany Parish
- NCES district ID
- 2201650
- Math proficiency
- 43% ▼ -32.00%
- Reading proficiency
- 55% ▼ -26.00%
- Median HH income
- $61,752
- Composite
- 43.04/100
- National rank
- #3098
- State rank
- #11 of 98 in LA
Livability — Covington
- Score
- 75/100
- State rank
- #17
- US rank
- #3876
Category grades
Schools grade is shown separately in the Schools card above.
Census & demographics
- County
- Saint Tammany Parish · 228,296 people
- City population
- 64,351
- Metro
- New Orleans-Metairie, LA
- Population (ZIP)
- 41,876
- Household income
- $81,241
- Rent vs Own
- Severe rent burden
- 1287.0
Population outlook (St. Tammany County) Hauer SSP2
- Today (2025)
- 286,725 people
- By 2030
- 304,175 · +6.1%
- By 2040
- 336,203 · +17.3%
- By 2050
- 364,590 · +27.2%
- By 2075
- 433,362 · +51.1%
- By 2100
- 470,333 · +64.0%
Race, ethnicity, and origin ACS 2023
- Neighborhood character
- Predominantly White (78%)
- Race & ethnicity
- White 78% Black 9% Hispanic / Latino 7% Two or more races 7% Native American 1% Asian 1%
- Hispanic origin (detail)
- Mexican 2%
- Common ancestry
- Lithuanian 17% Italian 2% Slovak 2%
- Foreign-born
- 5% · Canada, Vietnam
- Languages at home
- 92% English-only · Spanish 5% French/Haitian/Cajun 1% Vietnamese 1%
Political lean MEDSL · St. Tammany
- 2024 margin
- Solid R (+43.8) · D 27.3% · R 71.1% · Other 1.6%
- 2008→2024 swing
- +9.6pp toward D · 2008: -53.4pp · 2024: -43.8pp
- All cycles
- 2024: R+43.8 2020: R+44.2 2016: R+50.8 2012: R+52.2 2008: R+53.4
Not yet ingested
- Civics
- —
Market trends
- HPI YoY
- ▼ -112.14%
- Current HPI
- 181.8348
- Rent YoY
- ▲ 4.31%
- Metro
- New Orleans-Metairie, LA
- State GDP YoY
- ▲ 3.29%
- F500 in state
- 10
Industry mix (Fortune 500 HQ in LA)
| Industry | F500 HQs | Revenue |
|---|---|---|
| Telecommunications | 2 | $23B |
|
||
| Utilities | 1 | $12B |
|
||
| Wholesale / Distribution | 1 | $5B |
|
||
| Advertising | 1 | $2B |
|
||
Price history
-6.9% since first listed6 events — show timeline
- 2026-03-02 Listed $135,000 GSREIN
- 2026-03-02 Listed $135,000 AcadianaMLS
- 2025-09-24 Price Changed $140,000 AcadianaMLS
- 2025-09-24 Price Changed $140,000 GSREIN
- 2025-08-15 Listed $140,000 AcadianaMLS
- 2025-08-15 Listed $145,000 AcadianaMLS
Cash-flow waterfall
monthlySold comps — $/sqft
last 12 mo · ≤1 miLoading sold comps…