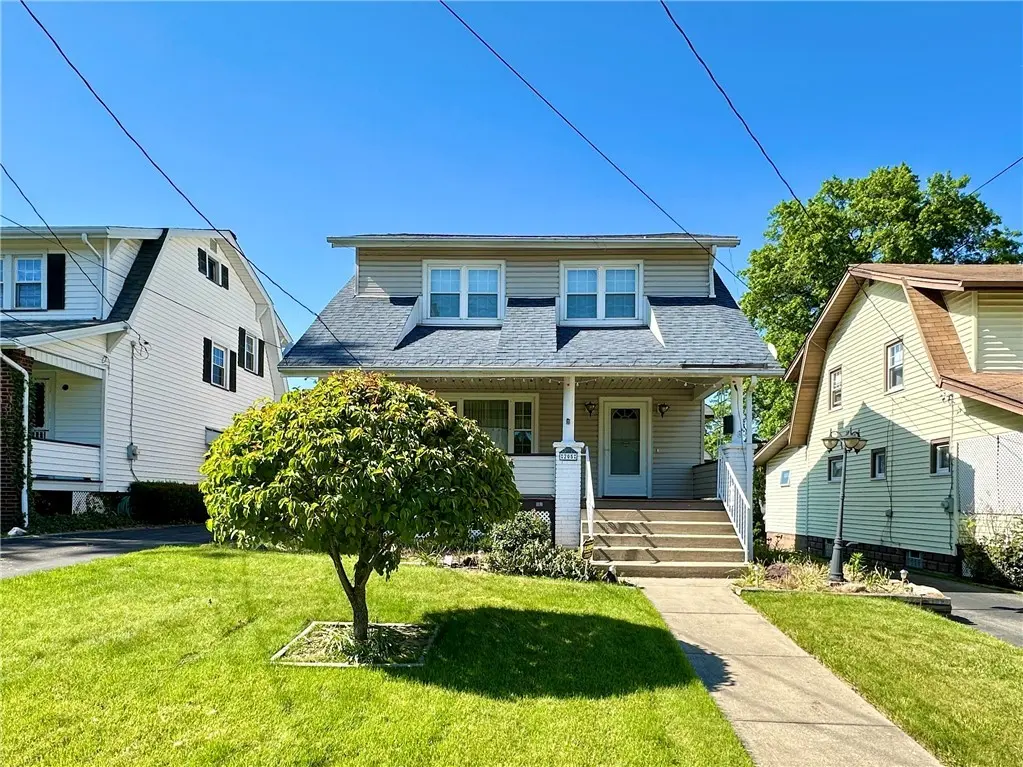
205 E Sheridan Ave · New Castle, PA
Flood risk 1/10 · Minimal
- FEMA flood zone
- X (unshaded)
- Chance of flooding over 30 yrs
- 0.0%
- Est. flood insurance / yr
- $473 – $860
Fire risk 1/10 · Minimal
- Est. fire insurance / yr
- $511 – $949
Heat risk 3/10 · Minor
- Hot days now (above 96°F)
- 7 days/yr
- Hot days in 30 yrs
- 18 days/yr
Wind risk 1/10 · Minimal
- Chance of severe wind over 30 yrs
- —
Air-quality risk 2/10 · Minimal
- Unhealthy air days now
- 1 days/yr
- Unhealthy air days in 30 yrs
- 3 days/yr
Risk factors via First Street. Map © Google.
Why this score? — see what drove the D- grade
The composite is a weighted blend of 9 inputs, each scored 0–100. Each bar is that input's sub-score; the figure is the points it added to the 100-point composite (weight × sub-score).
- Cash flow +16.4/30.0
- DSCR +5.1/10.0
- 1% rule +4.2/10.0
- Livability +4.1/5.0
- Rent growth +2.5/5.0
- Condition / age +2.5/5.0
- Schools +1.1/10.0
- ARV discount +0.0/15.0
- Appreciation +0.0/10.0
$169,900
🖨 Deal sheet (PDF) 📄 Offer letter ✓ Due diligence
Listing remarks
Charming and well-maintained two-story home offering 3 bedrooms and 1.5 bathrooms in a convenient yet peaceful location. The welcoming front porch provides the perfect spot to relax and enjoy the neighborhood. Inside, you'll find a bright and updated kitchen with ample cabinet and counter space, making meal preparation and entertaining easy. The home's functional layout offers comfortable living areas and plenty of room for everyday living. The partially finished basement provides additional space that can be used as a family room, recreation area, home gym, or extra storage. Upstairs, in addition to the three bedrooms, you'll find a bonus room that can serve as a home office, hobby room, n
Key facts
- Quiet street
- Nice-sized backyard
- Front porch
Tags
Property features AI
Exterior
- Parking: Detached garage
- Utilities: Public water; Public sewer
- Home design: 2-story resale property
- Exterior features: 0.15 acre lot
Interior
- Bathrooms: 1 full bathroom; 1 half bathroom
- Heating & cooling: Forced air heating (gas); Central air conditioning
- Interior features: Basement with walk-out access
Neighborhood map
What this means for you Summary
Snapshot
- This is a 3-bed/1.5-bath single-family listed at $170k.
Deal economics
- At list price, monthly cash flow is $95 ($1k/yr) — positive.
- The deal already cash-flows at list — no discount required.
- To meet the 1% rule (rent ≥ 1% of price), the offer needs to be $157k (7.7% below list).
- Recommended offer: $157k (7.7% below list) — sets the bar for 1% rule.
- Cap rate 7.0% vs local median 8.9% in New Castle — below-typical yield; the buyer is paying a premium for something (appreciation thesis, condition, location) that the cap rate doesn't capture.
Location & tenants
- Location reads 82/100 on livability (#137 in PA, #1,120 nationally) — a professional / high-income tenant draw. Strengths: crime A+, commute A+, cost of living A+; Watch: amenities F, employment F.
- New Castle Area SD (town): math 9% / reading 19% proficiency, ranked #519 of 539 in PA (top 96%) — low school quality limits family demand, transient renter base, plan for 1-2y turnover; 66% free/reduced lunch — lower-income household profile, screen leases tightly.
- Zoned schools: Harry W Lockley Early Learning Center (775 students, 100% FRL); New Castle Jhs (math 6% / reading 21%, grade F, #482 of 512 statewide, top 94%, 706 students, 100% FRL); New Castle Shs (math 47% / reading 30%, grade F, #280 of 437 statewide, top 64%, 771 students, 100% FRL) — zoned schools average 100% FRL vs 66% district-wide (33 pts higher); higher-poverty schools than district average — tighter screening recommended.
- Zoned-school proficiency averages 26% at this address vs 14% district-wide (+12 pts) — the actual schools serving this property are materially stronger than the New Castle Area SD average implies; a family-tenant draw the district grade alone would hide.
- Market conditions: 106 active listings in the ZIP; 51 units permitted in Lawrence County in 2024 (0 in 5+ unit buildings).
Forward outlook
- Local home prices are declining (-3.0%/yr); year-one equity from $1k of loan paydown is wiped out by about $5k of value loss. Plan a longer hold.
- Lawrence County population projected at -25% by 2050 — secular population decline; favor cash flow + early exit over multi-decade hold.
Negotiation context
- Only 14 days on market — expect competitive offers; lowballing is unlikely to land.
Risks & watch-outs
- Watch-outs: built in 1930 — expect roof / HVAC / electrical / plumbing capex.
Questions for the listing agent
- Built in 1930 — when were the roof, HVAC, electrical panel, plumbing, and water heater last replaced?
- Is there a deadline driving the sale (1031 exchange, divorce, estate, relocation)? That informs how much negotiation room exists.
- The area grade is low — what's the realistic commute time and amenity access for the typical tenant pool here? Any planned neighborhood developments (good or bad) we should know about?
- What's the average days-on-market for RENTAL listings here right now (not sales)? A rising rental-DOM trend means longer vacancies and softer asking-rent achievability than the comps imply.
- What's the recent tenant-quality profile in this submarket — average credit score on applications, eviction rate, late-payment / NSF rate, and stable-employment percentage? A property-management company in the area should have these aggregated.
- How much new for-sale + rental construction is in the pipeline within 1–3 miles? Heavy new supply typically softens prices + rents 12–24 months out; constrained supply supports both.
Investment metrics
- 1% rule
- 0.92% ✗
- Cap rate
- 6.96%
- Cash-on-cash
- 2.39%
- DSCR
- 1.11
- GRM
- 9.0
CMA / ARV
- ARV (on-the-fly)
- $131,040
- Comps found
- 12
Show comp detail 12 sales within ~0.75 mi
| Address | Dist | Beds/Ba | Sqft | Sold | Price | $/sf | Match |
|---|---|---|---|---|---|---|---|
| 228 E Sheridan Ave | 0.08mi | 3/1.5 | 1,288 (+3%) | 2mo | $140,000 | $109 | 90 |
| 142 E Garfield Ave | 0.10mi | 3/1.0 | 1,359 (+9%) | 3mo | $150,000 | $110 | 76 |
| 313 Norwood Ave | 0.28mi | 3/1.0 | 1,344 (+8%) | 2mo | $147,000 | $109 | 70 |
| 18 W Moody Ave | 0.47mi | 3/1.0 | 1,314 (+5%) | 3mo | $20,000 | $15 | 65 |
| 902 Delaware Ave | 0.52mi | 3/1.0 | 1,188 (-5%) | 2mo | $109,000 | $92 | 64 |
| 511 E Garfield Ave | 0.46mi | 3/2.0 | 1,142 (-8%) | 2mo | $160,000 | $140 | 61 |
| 7 W Edison Ave | 0.43mi | 4/1.0 (+1) | 1,144 (-8%) | 1mo | $157,000 | $137 | 59 |
| 527 E Moody Ave | 0.61mi | 3/2.0 | 1,188 (-5%) | 6mo | $109,500 | $92 | 57 |
| 212 E Meyer Ave | 0.57mi | 2/2.5 (-1) | 1,316 (+5%) | 0mo | $138,000 | $105 | 55 |
| 231 E Meyer Ave | 0.60mi | 3/2.0 | 1,352 (+8%) | 4mo | $125,000 | $92 | 53 |
| 419 E Northview Ave | 0.64mi | 3/1.0 | 1,352 (+8%) | 5mo | $97,500 | $72 | 50 |
| 510 Laurel Blvd | 0.61mi | 3/1.0 | 1,401 (+12%) | 3mo | $101,510 | $72 | 47 |
Match score weights: distance 35% · size 25% · config 20% · recency 20%. Top-matched comps best support the ARV.
Projected returns pro-forma
-3.0% appreciation · 3.0% rent growth · sell at horizon
- IRR
- -12.5%
- Equity multiple
- 0.55×
- Total profit
- $-21,480
- Equity at exit
- $25,333
- IRR
- -3.4%
- Equity multiple
- 0.77×
- Total profit
- $-10,897
- Equity at exit
- $14,690
Cash invested: $47,572 (down + closing). Projections, not guarantees.
Landlord ↔ Tenant lean methodology
- Overall (STATE)
- 62 Landlord-Friendly
- State Pennsylvania
- 62 Landlord-Friendly · EVEN
- County
- — inherits STATE
- City
- — inherits STATE
ZIP-level market 16105
- Home prices YoY
- -26.5%
- Active inventory
- 106
- Price-to-rent
- 9.0×
Monthly cashflow live
- Estimated rent
- $1,569 medium interval (Pro) →
- Mortgage (P&I)
- −$891
- Tax from tax record
- −$182 /mo · $2,189/yr
- Insurance
- −$71
- HOA
- −$0
- Vacancy / Maint / Mgmt
- −$329
- Net cashflow
- $95
Break-even live
Sensitivity live
| Price | -10% $191 | -5% $143 | +0% $95 | +5% $47 | +10% $-1 |
|---|---|---|---|---|---|
| Rent | -10% $-29 | -5% $33 | +0% $95 | +5% $157 | +10% $219 |
| Rate | -1.0pp $180 | -0.5pp $138 | base $95 | +0.5pp $51 | +1.0pp $6 |
UW: 25.0% down · 7.5% · 30yr · 1.5% tax · 5.0% vac · 8.0% maint · 8.0% mgmt
Financing live
Cash to close
- Down payment
- $42,475
- Closing costs
- $5,097
- Reserves months
- —
- Total cash needed
- —
Loan-product check · same deal, 3 products live
Conventional
25% down · 7.5% · 30yr
- Down + closing
- —
- Monthly P&I
- —
- Monthly cashflow
- —
- DSCR
- —
- Eligible?
- —
Personal DTI + credit; lowest rate.
DSCR
20% down · 8.5% · 30yr
- Down + closing
- —
- Monthly P&I
- —
- Monthly cashflow
- —
- DSCR
- —
- Eligible?
- —
No personal income docs; deal must DSCR.
Hard money
10% down · 12.0% · 12mo
- Down + closing
- —
- Monthly P&I
- —
- Monthly cashflow
- —
- DSCR
- —
- Eligible?
- —
Short-term bridge; refi at stabilization.
Listing history 11 events
-
2026-06-22days on market $169,900 Active 14 DOM
-
2026-06-21days on market $169,900 Active 13 DOM
-
2026-06-19days on market $169,900 Active 11 DOM
-
2026-06-18days on market $169,900 Active 10 DOM
-
2026-06-17days on market $169,900 Active 9 DOM
-
2026-06-16days on market $169,900 Active 8 DOM
-
2026-06-15days on market $169,900 Active 7 DOM
-
2026-06-14days on market $169,900 Active 5 DOM
-
2026-06-12days on market $169,900 Active 4 DOM
-
2026-06-08remarks 699-char remark
-
2026-06-08$169,900 Active 1 DOM
ⓘ Source: listings_history table (triggers on properties + properties_extension) + one-shot
backfill from property_details.listing_events for pre-trigger history.
Tax reassessment forecast PA · Partial reset (capped growth)
- Current annual tax
- $2,189 · $182/mo
- Projected year-2 tax
- $2,437 · $203/mo
- Expected delta
- +$248/yr (+$21/mo · 11.3%)
ⓘ Screening estimate from a state-policy table — verify with the county assessor before closing.
Climate risk First Street
- Flood 1/10 Low FEMA zone X (unshaded) · 0% chance over 30 yrs
- Wildfire 1/10 Low
- Heat 3/10 Moderate 7 d/yr ≥96°F today · 18 d/yr by 30 yrs out
- Wind 1/10 Low
- Air quality 2/10 Low 1 unhealthy d/yr today · 3 by 30 yrs out
Nearby sold comps map
Loading sold comps map…
Walkable amenities ~0.75 mi
Loading nearby amenities…
Taxation est. · year 1
- Rental income
- $18,822
- − Mortgage interest
- −$9,517
- − Property taxes
- −$2,189
- − Insurance
- −$850
- − Repairs & maintenance
- −$1,506
- − Management
- −$1,506
- − Depreciation
- −$4,943
- Taxable loss
- −$1,688
- Est. tax savings @ 24.0%
- +$405
- After-tax cash flow
- $1,544/yr
For passive investors: Depreciation is non-cash, so a rental often shows a tax loss while cash-flowing — sheltering income. Rental losses are passive: they offset passive income freely, and up to $25,000/yr can offset ordinary (W-2) income if you actively participate and your MAGI is under $100k (phasing out to $0 by $150k); unused losses carry forward. On sale, claimed depreciation is recaptured at up to 25%, and gains may owe capital-gains tax (a 1031 exchange can defer both). Figures are a year-1 estimate at your 24.0% rate — not tax advice; consult a CPA.
Schools (NCES district)
- District
- New Castle Area SD
- NCES district ID
- 4216620
- Math proficiency
- 9% ▼ -13.00%
- Reading proficiency
- 19% ▼ -23.00%
- Median HH income
- $30,967
- Composite
- 11.08/100
- National rank
- #9736
- State rank
- #519 of 539 in PA
Livability — New Castle
- Score
- 82/100
- State rank
- #137
- US rank
- #1120
Category grades
Schools grade is shown separately in the Schools card above.
Census & demographics
- Census place
- New Castle, PA
- City population
- 30,767
- Population (ZIP)
- 15,195
Population outlook (Lawrence County) Hauer SSP2
- Today (2025)
- 81,781 people
- By 2030
- 77,978 · -4.7%
- By 2040
- 69,522 · -15.0%
- By 2050
- 61,344 · -25.0%
- By 2075
- 45,027 · -44.9%
- By 2100
- 31,305 · -61.7%
Race, ethnicity, and origin ACS 2023
- Neighborhood character
- Predominantly White (93%)
- Race & ethnicity
- White 93% Black 3% Hispanic / Latino 2% Two or more races 1%
- Common ancestry
- Romanian 9% Serbian 3% Lithuanian 3%
- Foreign-born
- 2% · Canada
- Languages at home
- 96% English-only · Other Indo-European 1% Spanish 1% German/W. Germanic 1%
Political lean MEDSL · Lawrence
- 2024 margin
- Solid R (+33.8) · D 32.8% · R 66.5%
- 2008→2024 swing
- -28.7pp toward R · 2008: -5.1pp · 2024: -33.8pp
- All cycles
- 2024: R+33.8 2020: R+29.6 2016: R+28.1 2012: R+9.0 2008: R+5.1
Not yet ingested
- Civics
- —
Market trends
- HPI YoY
- ▼ -62.26%
- Current HPI
- 173.0332
- Rent YoY
- —
- Metro
- —
- State GDP YoY
- ▲ 1.68%
- F500 in state
- 34
Industry mix (Fortune 500 HQ in PA)
| Industry | F500 HQs | Revenue |
|---|---|---|
| Healthcare | 2 | $309B |
|
||
| Insurance | 2 | $27B |
|
||
| Telecommunications / Media | 1 | $124B |
|
||
| Industrial Distribution | 1 | $22B |
|
||
| Financial Services | 1 | $20B |
|
||
| Chemicals / Materials | 1 | $18B |
|
||
Price history
1 event — show timeline
- 2026-06-08 Listed $169,900 West Penn MLS
Property tax history
+1.4%/yrLatest (2026): $2,189 · +2.0% YoY. Source: county tax records.
Cash-flow waterfall
monthlySold comps — $/sqft
last 12 mo · ≤1 miLoading sold comps…