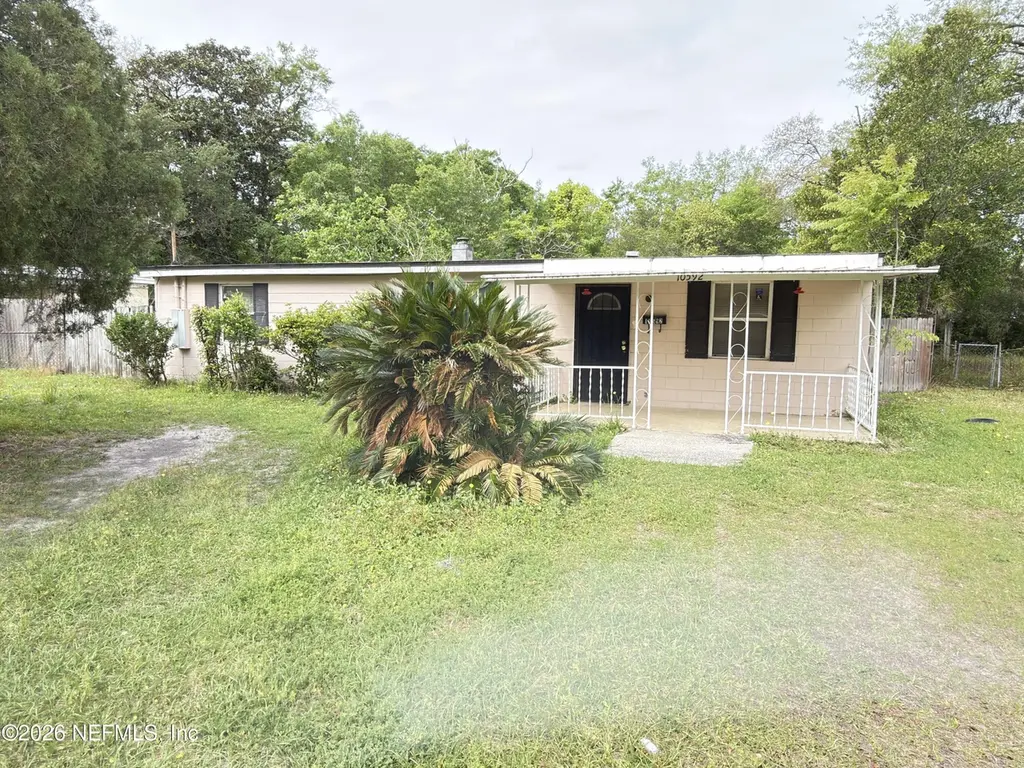
10592 Haverford Rd · Jacksonville, FL
Flood risk 1/10 · Minimal
- FEMA flood zone
- X (unshaded)
- Chance of flooding over 30 yrs
- 0.0%
- Est. flood insurance / yr
- $507 – $1,088
Fire risk 4/10 · Minor
- Est. fire insurance / yr
- $947 – $1,759
Heat risk 9/10 · Severe
- Hot days now (above 107°F)
- 7 days/yr
- Hot days in 30 yrs
- 20 days/yr
Wind risk 9/10 · Severe
- Chance of severe wind over 30 yrs
- 99.0%
Air-quality risk 4/10 · Minor
- Unhealthy air days now
- 6 days/yr
- Unhealthy air days in 30 yrs
- 6 days/yr
Risk factors via First Street. Map © Google.
Why this score? — see what drove the B- grade
The composite is a weighted blend of 9 inputs, each scored 0–100. Each bar is that input's sub-score; the figure is the points it added to the 100-point composite (weight × sub-score).
- Cash flow +24.2/30.0
- ARV discount +15.0/15.0
- DSCR +7.8/10.0
- 1% rule +7.2/10.0
- Livability +4.2/5.0
- Schools +3.9/10.0
- Condition / age +2.5/5.0
- Rent growth +2.4/5.0
- Appreciation +0.0/10.0
$130,000
🖨 Deal sheet 📄 Offer letter ✓ Due diligence
Listing remarks MLS
This newly renovated home is move in ready! It has 3 bedrooms and 1 bathroom with 1034 sq feet of living space and updates throughout. Call for your showing today!
Key facts
- Solid potential
- Fully fenced yard
- Convenient layout
Tags
Property features AI
Finance
- HOA & community: Not a senior community
Exterior
- Parking: Off-street parking
- Utilities: Public sewer; Electricity connected; Sewer connected; Water available
- Home design: Single family residence; Used as residential and investment property
- Exterior features: 0.21-acre lot
Interior
- Kitchen: Electric oven; Electric range; Refrigerator
- Bedrooms: 3 bedrooms
- Bathrooms: 1 full bathroom
- Heating & cooling: Central heating; Central air
- Interior features: Central heating and central air conditioning; Electric water heater
- Laundry & utility: Washer hookup; Electric dryer hookup
Neighborhood map
What this means for you Summary
Snapshot
- This is a 3-bed/1.0-bath single-family listed at $130k.
Deal economics
- At list price, monthly cash flow is $259 ($3k/yr) — positive.
- The deal already cash-flows at list — no discount required.
- Meets the 1% rule at list price ($2k rent vs $130k).
- Recommended offer: $122k (6.0% below list) — sets the bar for market timing.
- Cap rate 8.7% vs local median 4.0% in Jacksonville — top-decile yield for the area; either an underpriced asset or a hidden risk that comps aren't pricing in. Stress-test before assuming the spread holds.
Location & tenants
- Location reads 83/100 on livability (#50 in FL, #911 nationally) — a professional / high-income tenant draw. Strengths: amenities A+, commute A+, housing A+.
- Duval (urban): math 46% / reading 45% proficiency, ranked #48 of 73 in FL (top 66%) — families likely to look elsewhere, expect single-tenant / working-renter base with shorter leases.
- Market conditions: Rents soft (-0.4%/yr); 728 active listings in the ZIP; 33 comparable units currently listed for rent nearby; rentals at typical pace (median 14d on market — plan ~3-4 weeks tenant-placement turnaround); 6,503 units permitted in Duval County in 2024 (1,131 in 5+ unit buildings).
Forward outlook
- Local home prices are declining (-3.0%/yr); year-one equity from $899 of loan paydown is wiped out by about $4k of value loss. Plan a longer hold.
- Duval County population projected at +19% by 2050 — long-run rental-demand tailwind backs the buy-and-hold thesis.
Negotiation context
- It's been on market 76 days — a 6% lower offer ($122k) is reasonable based on typical stale-listing flexibility.
- 3 sale attempts since 19y ago; this cycle's ask has dropped $10k (7%) from the opening price — seller is motivated, your offer sets the floor, not the list.
- Current owner paid $105k; 24% above their basis — modest negotiation headroom, anchor on the comps not their cost.
Risks & watch-outs
- Watch-outs: built in 1954 — expect roof / HVAC / electrical / plumbing capex.
- Climate carrying-cost: severe wind risk, 99% chance of damaging wind over 30y; extreme-heat days projected 7→20/yr by 2055 (HVAC capex compounding) — expect insurance premiums to compound above CPI over the hold.
Questions for the listing agent
- It's been on market 76 days. Have you received any prior offers? Is the seller open to a 6% concession, seller financing, or rate buy-down credit?
- Built in 1954 — when were the roof, HVAC, electrical panel, plumbing, and water heater last replaced?
- Why hasn't it sold? Are there any deal-killer items the seller is aware of (foundation, flood, title, zoning, code violations)?
- Is there a deadline driving the sale (1031 exchange, divorce, estate, relocation)? That informs how much negotiation room exists.
- Schools are B-rated — typically a magnet for longer-tenancy family renters. What's the average tenant stay here, and is there a school-zone premium baked into asking?
- What's the average days-on-market for RENTAL listings here right now (not sales)? A rising rental-DOM trend means longer vacancies and softer asking-rent achievability than the comps imply.
- What's the recent tenant-quality profile in this submarket — average credit score on applications, eviction rate, late-payment / NSF rate, and stable-employment percentage? A property-management company in the area should have these aggregated.
- How much new for-sale + rental construction is in the pipeline within 1–3 miles? Heavy new supply typically softens prices + rents 12–24 months out; constrained supply supports both.
Investment metrics
- 1% rule
- 1.22% ✓
- Cap rate
- 8.68%
- Cash-on-cash
- 8.52%
- DSCR
- 1.38
- GRM
- 6.8
CMA / ARV
- ARV (on-the-fly)
- $173,712
- Comps found
- 12
Show comp detail 12 sales within ~0.75 mi
| Address | Dist | Beds/Ba | Sqft | Sold | Price | $/sf | Match |
|---|---|---|---|---|---|---|---|
| 1613 Loyola Dr N | 0.30mi | 3/1.0 | 1,036 (+0%) | 2mo | $160,000 | $154 | 84 |
| 10551 Conrad Dr | 0.22mi | 3/1.0 | 1,068 (+3%) | 5mo | $200,000 | $187 | 80 |
| 10623 Biscayne Blvd | 0.27mi | 3/1.0 | 1,080 (+4%) | 2mo | $215,000 | $199 | 78 |
| 10550 Fairlane Dr | 0.41mi | 3/2.0 | 1,036 (+0%) | 1mo | $170,000 | $164 | 76 |
| 1139 De Paul Dr | 0.29mi | 3/1.0 | 1,130 (+9%) | 1mo | $149,000 | $132 | 70 |
| 10250 Briarcliff Rd E | 0.42mi | 3/1.5 | 1,108 (+7%) | 3mo | $192,000 | $173 | 64 |
| 1614 Loyola Dr N | 0.32mi | 3/1.0 | 1,146 (+11%) | 4mo | $175,000 | $153 | 64 |
| 1023 De Paul Dr | 0.39mi | 3/2.0 | 1,128 (+9%) | 7mo | $190,000 | $168 | 56 |
| 1821 Wofford Ave | 0.50mi | 4/1.0 (+1) | 1,080 (+4%) | 10mo | $209,900 | $194 | 56 |
| 10633 Ithaca Dr | 0.22mi | 2/1.0 (-1) | 881 (-15%) | 6mo | $70,000 | $79 | 56 |
| 10204 Elmhurst Dr | 0.52mi | 3/1.0 | 942 (-9%) | 9mo | $149,000 | $158 | 54 |
| 10258 Elmhurst Dr | 0.42mi | 3/1.5 | 912 (-12%) | 10mo | $165,000 | $181 | 51 |
Match score weights: distance 35% · size 25% · config 20% · recency 20%. Top-matched comps best support the ARV.
Projected returns pro-forma
-3.0% appreciation · 0.0% rent growth · sell at horizon
- IRR
- -7.0%
- Equity multiple
- 0.75×
- Total profit
- $-9,153
- Equity at exit
- $19,383
- IRR
- -2.1%
- Equity multiple
- 0.88×
- Total profit
- $-4,352
- Equity at exit
- $11,240
Cash invested: $36,400 (down + closing). Projections, not guarantees.
Landlord ↔ Tenant lean methodology
- Overall (STATE)
- 87 Strongly Landlord-Friendly
- State Florida
- 87 Strongly Landlord-Friendly · R+3
- County
- — inherits STATE
- City
- — inherits STATE
ZIP-level market 32218
- Home prices YoY
- -25.7%
- Rents YoY
- -0.4%
- Active inventory
- 728
- Price-to-rent
- 6.8×
Monthly cashflow live
- Estimated rent
- $1,582 high interval (Pro) →
- Mortgage (P&I)
- −$682
- Tax from tax record
- −$255 /mo · $3,063/yr
- Insurance
- −$54
- HOA
- −$0
- Vacancy / Maint / Mgmt
- −$332
- Net cashflow
- $259
Break-even live
UW: 25.0% down · 7.5% · 30yr · 1.5% tax · 5.0% vac · 8.0% maint · 8.0% mgmt
Financing live
Cash to close
- Down payment
- $32,500
- Closing costs
- $3,900
- Reserves months
- —
- Total cash needed
- —
Loan-product check · same deal, 3 products live
Conventional
25% down · 7.5% · 30yr
- Down + closing
- —
- Monthly P&I
- —
- Monthly cashflow
- —
- DSCR
- —
- Eligible?
- —
Personal DTI + credit; lowest rate.
DSCR
20% down · 8.5% · 30yr
- Down + closing
- —
- Monthly P&I
- —
- Monthly cashflow
- —
- DSCR
- —
- Eligible?
- —
No personal income docs; deal must DSCR.
Hard money
10% down · 12.0% · 12mo
- Down + closing
- —
- Monthly P&I
- —
- Monthly cashflow
- —
- DSCR
- —
- Eligible?
- —
Short-term bridge; refi at stabilization.
Rent comps 33 comps
| Address | Beds | Baths | Sqft | Rent | $/sqft | DOM | Units | Dist |
|---|---|---|---|---|---|---|---|---|
| 12802 Haverford Rd Jacksonville, FL | 1.0–3.0 | 1.0–2.0 | 1000 | $1,299 | $1.30 | 1d | 15 | 0.13mi |
| 10561 Ashby Rd Jacksonville, FL | 3.0 | 1.0 | 1034 | $1,181 | $1.14 | 23d | 1 | 0.14mi |
| 10529 Keuka Dr Jacksonville, FL | 4.0 | 1.0 | 1101 | $600 | $0.54 | 7d | 1 | 0.15mi |
| 1333 Dunn Ave Jacksonville, FL | 2.0 | 1.0 | 576 | $1,185 | $2.06 | 1d | 16 | 0.22mi |
| 1123 Depaul Dr Jacksonville, FL | 3.0 | 1.5 | 1152 | $1,295 | $1.12 | 21d | 1 | 0.33mi |
| 1033 Ake Ln Jacksonville, FL | 3.0 | 1.0 | 868 | $1,200 | $1.38 | 21d | 1 | 0.33mi |
| 10964 Bacall Rd W Jacksonville, FL | 3.0 | 1.5 | 1138 | $1,550 | $1.36 | 23d | 1 | 0.38mi |
| 1601 Dunn Ave Jacksonville, FL | 1.0–3.0 | 1.0–2.0 | 852 | $1,575 | $1.85 | 2d | 12 | 0.38mi |
| 10310 Briarcliff Rd E Jacksonville, FL | 3.0 | 2.0 | 1285 | $1,399 | $1.09 | 14d | 1 | 0.40mi |
| 10897 Regency Dr Jacksonville, FL | 4.0 | 2.0 | 1391 | $1,650 | $1.19 | 4d | 1 | 0.54mi |
| 10621 Monaco Dr Jacksonville, FL | 1.0–2.0 | 1.0–1.5 | 975 | $1,150 | $1.18 | 23d | 7 | 0.54mi |
| 11050 Harts Rd Jacksonville, FL | 3.0 | 2.0–2.5 | 1145 | $1,511 | $1.32 | 2d | 10 | 0.72mi |
| 11011 Harts Rd Jacksonville, FL | 1.0–3.0 | 1.0–2.0 | 1052 | $1,742 | $1.66 | 1d | 23 | 0.82mi |
| 11029 Traci Lynn Dr Jacksonville, FL | 3.0 | 2.0 | 1402 | $1,550 | $1.11 | 3d | 1 | 0.88mi |
| 950 Turtle Creek Dr S Jacksonville, FL | 3.0 | 2.0 | 1460 | $1,824 | $1.25 | 23d | 1 | 1.00mi |
| 2462 Quail Ave Jacksonville, FL | 3.0 | 1.5 | 1312 | $1,397 | $1.06 | 23d | 1 | 1.02mi |
| 9808 Morgan Marsh Ct Jacksonville, FL | 3.0 | 2.5 | 1380 | $1,599 | $1.16 | 23d | 1 | 1.03mi |
| 9806 Morgan Marsh Ct Unit 9856 Jacksonville, FL | 3.0 | 2.5 | 1380 | $1,609 | $1.17 | 20d | 1 | 1.03mi |
| 9806 Morgan Marsh Ct Jacksonville, FL | 3.0 | 2.5 | 1380 | $1,609 | $1.17 | 23d | 1 | 1.03mi |
| 2482 Quail Ave Jacksonville, FL | 3.0 | 2.0 | 1224 | $1,850 | $1.51 | 17d | 1 | 1.06mi |
| 2489 Quail Ave Jacksonville, FL | 3.0 | 2.0 | 1308 | $1,495 | $1.14 | 23d | 1 | 1.07mi |
| 2489 Quail Ave Jacksonville, FL | 3.0 | 2.0 | 1306 | $1,495 | $1.14 | 16d | 1 | 1.07mi |
| 10735 Merida Dr #14 Jacksonville, FL | 4.0 | 2.0 | 1303 | $1,635 | $1.25 | 7d | 1 | 1.11mi |
| 745 Northpoint Cir N Jacksonville, FL | 2.0 | 2.0 | 897 | $1,600 | $1.78 | 23d | 1 | 1.16mi |
| 1327 Eagle Cove Rd N Jacksonville, FL | 4.0 | 2.0 | 1244 | $1,526 | $1.23 | 17d | 1 | 1.31mi |
| 780 Island Point Dr Jacksonville, FL | 1.0–3.0 | 1.0–2.0 | 1164 | $2,143 | $1.84 | 3d | 16 | 1.35mi |
| 11332 Island Shore Dr W Jacksonville, FL | 3.0 | 1.5 | 1178 | $1,703 | $1.45 | 4d | 1 | 1.37mi |
| 9565 Carbondale Dr W Unit B Jacksonville, FL | 3.0 | 2.0 | 1400 | $2,000 | $1.43 | 23d | 1 | 1.38mi |
| 2346 Blossom Ridge Dr N Jacksonville, FL | 3.0 | 2.0 | 1334 | $1,819 | $1.36 | 10d | 1 | 1.41mi |
| 2445 Dunn Ave Jacksonville, FL | 1.0–3.0 | 1.0–2.0 | 850 | $1,815 | $2.14 | 1d | 11 | 1.41mi |
| 11211 Margarets Landing Pl Jacksonville, FL | 3.0 | 2.0 | 1280 | $1,826 | $1.43 | 7d | 1 | 1.41mi |
| 10535 Lem Turner Rd Jacksonville, FL | 1.0–4.0 | 1.0–2.0 | 1012 | $1,562 | $1.54 | 2d | 40 | 1.45mi |
| 1000 Island Point Dr Jacksonville, FL | 1.0–3.0 | 1.0–2.0 | 949 | $1,684 | $1.77 | 2d | 9 | 1.50mi |
Listing history 25 events
-
2026-06-18days on market $130,000 Active 76 DOM
-
2026-06-17days on market $130,000 Active 75 DOM
-
2026-06-16days on market $130,000 Active 74 DOM
-
2026-06-15days on market $130,000 Active 73 DOM
-
2026-06-13days on market $130,000 Active 70 DOM
-
2026-06-10days on market $130,000 Active 67 DOM
-
2026-06-08days on market $130,000 Active 66 DOM
-
2026-06-07days on market $130,000 Active 65 DOM
-
2026-06-03days on market $130,000 Active 61 DOM
-
2026-06-02days on market $130,000 Active 60 DOM
-
2026-06-01days on market $130,000 Active 59 DOM
-
2026-05-31remarks 641-char remark
-
2026-05-31days on market $130,000 Active 58 DOM
-
2026-04-16price $130,000
-
2026-04-03$140,000 Active
-
2018-08-13soldstatus $105,000 Sold 164-char remark
Show marketing remark (164 chars)
This newly renovated home is move in ready! It has 3 bedrooms and 1 bathroom with 1034 sq feet of living space and updates throughout. Call for your showing today!
-
2018-08-10soldstatus $105,000
-
2018-08-02status Pending 164-char remark
Show marketing remark (164 chars)
This newly renovated home is move in ready! It has 3 bedrooms and 1 bathroom with 1034 sq feet of living space and updates throughout. Call for your showing today!
-
2018-08-01$152,000 Active 164-char remark
Show marketing remark (164 chars)
This newly renovated home is move in ready! It has 3 bedrooms and 1 bathroom with 1034 sq feet of living space and updates throughout. Call for your showing today!
-
2018-05-16soldstatus $37,000
-
2007-08-27historical 348-char remark
Show marketing remark (348 chars)
This home has been completely renovated from top to bottom. Brand new Roof, Remodeled kitchen with new counter tops, sink, and cabinets, Brand new bathroom including tub, tile in shower and floor, toilet and sink. New carpet and paint through out, windows replaced! This home is like new!! ~~~~Will help with closing cost, with reasonable offer!
-
2007-04-27$124,900 348-char remark
Show marketing remark (348 chars)
This home has been completely renovated from top to bottom. Brand new Roof, Remodeled kitchen with new counter tops, sink, and cabinets, Brand new bathroom including tub, tile in shower and floor, toilet and sink. New carpet and paint through out, windows replaced! This home is like new!! ~~~~Will help with closing cost, with reasonable offer!
-
1997-12-29soldstatus $54,000
-
1997-05-07soldstatus $18,000
-
1997-05-07soldstatus $18,000
ⓘ Source: listings_history table (triggers on properties + properties_extension) + one-shot
backfill from property_details.listing_events for pre-trigger history.
Tax reassessment forecast FL · Resets to sale price
- Current annual tax
- $3,063 · $255/mo
- Projected year-2 tax
- $3,063 · $255/mo
- Expected delta
- $0/yr ($0/mo · 0.0%)
ⓘ Screening estimate from a state-policy table — verify with the county assessor before closing.
Climate risk First Street
- Flood 1/10 Low FEMA zone X (unshaded) · 0% chance over 30 yrs
- Wildfire 4/10 Moderate
- Heat 9/10 Extreme 7 d/yr ≥107°F today · 20 d/yr by 30 yrs out
- Wind 9/10 Extreme 99% chance of damaging wind over 30 yrs
- Air quality 4/10 Moderate 6 unhealthy d/yr today · 6 by 30 yrs out
Nearby sold comps map
Loading sold comps map…
Walkable amenities ~0.75 mi
Loading nearby amenities…
Taxation est. · year 1
- Rental income
- $18,983
- − Mortgage interest
- −$7,282
- − Property taxes
- −$3,063
- − Insurance
- −$650
- − Repairs & maintenance
- −$1,519
- − Management
- −$1,519
- − Depreciation
- −$3,782
- Taxable income
- $1,169
- Est. tax owed @ 24.0%
- −$281
- After-tax cash flow
- $2,822/yr
For passive investors: Depreciation is non-cash, so a rental often shows a tax loss while cash-flowing — sheltering income. Rental losses are passive: they offset passive income freely, and up to $25,000/yr can offset ordinary (W-2) income if you actively participate and your MAGI is under $100k (phasing out to $0 by $150k); unused losses carry forward. On sale, claimed depreciation is recaptured at up to 25%, and gains may owe capital-gains tax (a 1031 exchange can defer both). Figures are a year-1 estimate at your 24.0% rate — not tax advice; consult a CPA.
Schools (NCES district)
- District
- Duval
- NCES district ID
- 1200480
- Math proficiency
- 46% ▼ -11.00%
- Reading proficiency
- 45% ▼ -4.00%
- Median HH income
- $48,987
- Composite
- 38.97/100
- National rank
- #4076
- State rank
- #48 of 73 in FL
Livability — Jacksonville
- Score
- 83/100
- State rank
- #50
- US rank
- #911
Category grades
Schools grade is shown separately in the Schools card above.
Census & demographics
- Census place
- Jacksonville, FL
- County
- Duval County · 1,015,274 people
- City population
- 979,034
- Metro
- Jacksonville, FL
- Population (ZIP)
- 72,905
- Household income
- $69,638
- Rent vs Own
- Severe rent burden
- 2289.0
Population outlook (Duval County) Hauer SSP2
- Today (2025)
- 1,013,010 people
- By 2030
- 1,059,228 · +4.6%
- By 2040
- 1,141,439 · +12.7%
- By 2050
- 1,205,258 · +19.0%
- By 2075
- 1,324,282 · +30.7%
- By 2100
- 1,319,620 · +30.3%
Race, ethnicity, and origin ACS 2023
- Neighborhood character
- Diverse neighborhood (Simpson 0.64)
- Race & ethnicity
- Black 48% White 35% Hispanic / Latino 9% Two or more races 8% Asian 2%
- Hispanic origin (detail)
- Mexican 2% Puerto Rican 4%
- Common ancestry
- Slovak 1% Lithuanian 1% Italian 1%
- Foreign-born
- 6% · Canada, Jamaica, Vietnam
- Languages at home
- 89% English-only · Spanish 6% French/Haitian/Cajun 1% Tagalog/Filipino 1%
Political lean MEDSL · Duval
- 2024 margin
- Toss-up / Even · D 48.7% · R 50.1% · Other 1.2%
- 2008→2024 swing
- +0.4pp no change · 2008: -1.9pp · 2024: -1.5pp
- All cycles
- 2024: R+1.5 2020: D+3.8 2016: R+1.5 2012: R+3.6 2008: R+1.9
Not yet ingested
- Civics
- —
Market trends
- HPI YoY
- ▼ -90.73%
- Current HPI
- 262.2329
- Rent YoY
- ▼ -0.40%
- Metro
- Jacksonville, FL
- State GDP YoY
- ▲ 3.28%
- F500 in state
- 36
Industry mix (Fortune 500 HQ in FL)
| Industry | F500 HQs | Revenue |
|---|---|---|
| Industrial Technology | 2 | $29B |
|
||
| Insurance | 2 | $17B |
|
||
| Retail | 1 | $60B |
|
||
| Technology Distribution | 1 | $58B |
|
||
| Homebuilding | 1 | $35B |
|
||
| Technology Manufacturing | 1 | $35B |
|
||
Price history
+622.2% since first listed12 events — show timeline
- 2026-04-16 Price Changed $130,000 realMLS
- 2026-04-03 Listed $140,000 realMLS
- 2018-08-13 Sold (MLS) $105,000 realMLS
- 2018-08-10 Sold (Public Records) $105,000 Public Records
- 2018-08-02 Pending — realMLS
- 2018-08-01 Listed $152,000 realMLS
- 2018-05-16 Sold (Public Records) $37,000 Public Records
- 2007-08-27 Listing Removed — realMLS
- 2007-04-27 Listed $124,900 realMLS
- 1997-12-29 Sold (Public Records) $54,000 Public Records
- 1997-05-07 Sold (Public Records) $18,000 Public Records
- 1997-05-07 Sold (Public Records) $18,000 Public Records
Property tax history
+11.6%/yrLatest (2025): $3,063 · +16.1% YoY. Source: county tax records.
Cash-flow waterfall
monthlySold comps — $/sqft
last 12 mo · ≤1 miLoading sold comps…