 5-Plex
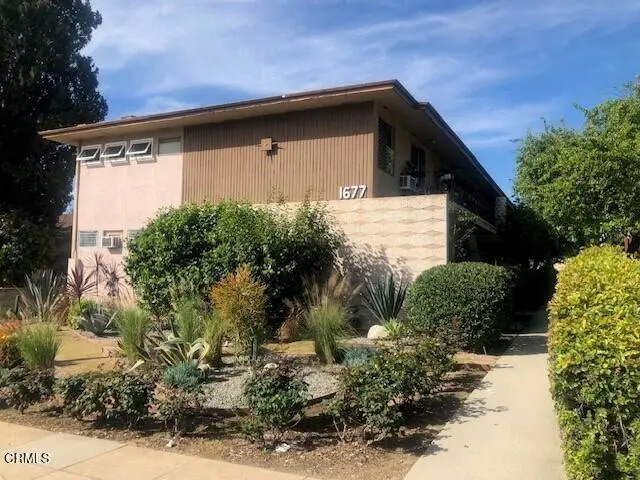
1677 N Lake Ave · Pasadena, CA
Flood risk 1/10 · Minimal
- FEMA flood zone
- X (unshaded)
- Chance of flooding over 30 yrs
- 0.0%
- Est. flood insurance / yr
- $507 – $1,088
Fire risk 2/10 · Minimal
- Est. fire insurance / yr
- $659 – $1,223
Heat risk 6/10 · Moderate
- Hot days now (above 98°F)
- 7 days/yr
- Hot days in 30 yrs
- 19 days/yr
Wind risk 1/10 · Minimal
- Chance of severe wind over 30 yrs
- —
Air-quality risk 9/10 · Severe
- Unhealthy air days now
- 21 days/yr
- Unhealthy air days in 30 yrs
- 24 days/yr
Risk factors via First Street. Map © Google.
Why this score? — see what drove the C- grade
The composite is a weighted blend of 9 inputs, each scored 0–100. Each bar is that input's sub-score; the figure is the points it added to the 100-point composite (weight × sub-score).
- ARV discount +15.0/15.0
- Cash flow +14.2/30.0
- Schools +4.6/10.0
- DSCR +4.3/10.0
- 1% rule +4.0/10.0
- Livability +3.6/5.0
- Condition / age +2.5/5.0
- Rent growth +2.3/5.0
- Appreciation +0.0/10.0
$2,975,000
🖨 Deal sheet 📄 Offer letter ✓ Due diligence
Multi-family units
County records classify this as Multi-Family (5+ Unit). Listing-text estimate: 5 units. confirmed
5+ unit building — per-unit beds/baths from public records are typically unavailable; the breakdown below (if shown) is an estimate from the listing text.
Listing remarks MLS
Located on North Lake Avenue, the major north/south corridor from Pasadena to Altadena providing a variety of eateries, financial services, transportation, personal service establishments, boutique and major retailers, has this multi-family, twelve unit building much to offer to residents and investors alike. Spacious units, covered surface parking, onsite laundry room, and more. Please respect the current tenants and do not go on to the property or make direct contact with the tenants. Thank you
Key facts
- Onsite laundry room
- 0.38 acre lot
- 12 parking spots
Tags
Neighborhood map
What this means for you Summary
Snapshot
- This is a 5 × 3-bed/?-bath units multifamily listed at $2.98M.
Deal economics
- At list price, monthly cash flow is $476 ($6k/yr) — positive. Per door: $95/mo.
- The deal already cash-flows at list — no discount required.
- To meet the 1% rule (rent ≥ 1% of price), the offer needs to be $2.66M (10.5% below list).
- Recommended offer: $2.66M (10.5% below list) — sets the bar for 1% rule.
- Cap rate 6.5% vs local median 1.5% in Pasadena — top-decile yield for the area; either an underpriced asset or a hidden risk that comps aren't pricing in. Stress-test before assuming the spread holds.
Location & tenants
- Location reads 72/100 on livability (#181 in CA) — a middle-class / working-renter tenant base. Strengths: amenities A+, commute A+, employment A+; Watch: schools D+, health & safety D+, crime F.
- Pasadena Unified (urban): math 42% / reading 60% proficiency, ranked #123 of 517 in CA (top 24%) — acceptable for families but not a draw, mixed tenant base, ~2y average lease.
- Market conditions: Rents soft (-0.6%/yr); 44 active listings in the ZIP; solid renter incomes; 19,697 units permitted in Los Angeles County in 2024 (9,426 in 5+ unit buildings).
- At $26,627/mo this rent would consume 302% of the median local household income ($106k/yr) (locally 1486% of renters already pay >50% of income on rent) — very limited rent-growth headroom before tenants either downsize or default.
Forward outlook
- Local home prices are declining (-3.0%/yr); year-one equity from $21k of loan paydown is wiped out by about $89k of value loss. Plan a longer hold.
- Los Angeles County population projected at +9% by 2050 — modest demand growth; plan on rents tracking national, not racing it.
Negotiation context
- It's been on market 106 days — a 9% lower offer ($2.71M) is reasonable based on typical stale-listing flexibility.
Risks & watch-outs
- Watch-outs: built in 1959 — expect roof / HVAC / electrical / plumbing capex.
- Climate carrying-cost: extreme-heat days projected 7→19/yr by 2055 (HVAC capex compounding) — expect insurance premiums to compound above CPI over the hold.
Questions for the listing agent
- It's been on market 106 days. Have you received any prior offers? Is the seller open to a 10% concession, seller financing, or rate buy-down credit?
- Can we see the unit-by-unit rent roll, current vacancy, and any below-market leases? What's the average tenancy length?
- What capital expenditures (roof, boiler, parking lot, exteriors) have been made in the last 5 years, and what's planned in the next 2?
- Built in 1959 — when were the roof, HVAC, electrical panel, plumbing, and water heater last replaced?
- Why hasn't it sold? Are there any deal-killer items the seller is aware of (foundation, flood, title, zoning, code violations)?
- Is there a deadline driving the sale (1031 exchange, divorce, estate, relocation)? That informs how much negotiation room exists.
- Schools are D-rated, which usually means shorter tenancies and higher turnover. Who's the typical renter profile here, and what's been the actual vacancy rate?
- Crime grade is F in this area — have there been break-ins, vandalism, or insurance claims at this property in the last 3 years? What carrier currently insures it and at what premium?
- What's the average days-on-market for RENTAL listings here right now (not sales)? A rising rental-DOM trend means longer vacancies and softer asking-rent achievability than the comps imply.
- What's the recent tenant-quality profile in this submarket — average credit score on applications, eviction rate, late-payment / NSF rate, and stable-employment percentage? A property-management company in the area should have these aggregated.
- How much new apartment / multifamily construction is in the pipeline within 1–3 miles? Heavy new supply (>2% of stock underway) typically softens rents 12–24 months out; light construction supports rent growth.
Investment metrics
- 1% rule
- 0.90% ✗
- Cap rate
- 6.48%
- Cash-on-cash
- 0.69%
- DSCR
- 1.03
- GRM
- 9.3
CMA / ARV
- ARV (median comp)
- $3,900,219
- List price
- $2,975,000
- Delta
- -23.72%
- Verdict
- UNDERPRICED
- Comps
- 2 within 1.0 mi
Projected returns pro-forma
-3.0% appreciation · 0.0% rent growth · sell at horizon
- IRR
- -18.6%
- Equity multiple
- 0.36×
- Total profit
- $-529,407
- Equity at exit
- $443,582
- IRR
- -18.6%
- Equity multiple
- 0.13×
- Total profit
- $-721,915
- Equity at exit
- $257,224
Cash invested: $833,000 (down + closing). Projections, not guarantees.
Landlord ↔ Tenant lean methodology
- Overall (STATE)
- 18 Strongly Tenant-Friendly
- State California
- 18 Strongly Tenant-Friendly · D+13
- County
- — inherits STATE
- City
- — inherits STATE
ZIP-level market 91104
- Rents YoY
- -0.6%
- Active inventory
- 44
- Price-to-rent
- 46.6×
Monthly cashflow live
- Estimated rent
- $26,627 high interval (Pro) →
- Mortgage (P&I)
- −$15,601
- Tax est. 1.5%
- −$3,719 /mo · $44,625/yr
- Insurance
- −$1,240
- HOA
- −$0
- Vacancy / Maint / Mgmt
- −$5,592
- Net cashflow
- $476
Break-even live
5-unit breakdown (identical units grouped — click to expand)
| Units | Beds | Baths | Est. rent |
|---|---|---|---|
| 5× units | 3 | — | $26,625 |
| #1 | 3 | — | $5,325 |
| #2 | 3 | — | $5,325 |
| #3 | 3 | — | $5,325 |
| #4 | 3 | — | $5,325 |
| #5 | 3 | — | $5,325 |
| Total (5 units) | $26,627 | ||
UW: 25.0% down · 7.5% · 30yr · 1.5% tax · 5.0% vac · 8.0% maint · 8.0% mgmt
Financing live
Cash to close
- Down payment
- $743,750
- Closing costs
- $89,250
- Reserves months
- —
- Total cash needed
- —
Loan-product check · same deal, 3 products live
Conventional
25% down · 7.5% · 30yr
- Down + closing
- —
- Monthly P&I
- —
- Monthly cashflow
- —
- DSCR
- —
- Eligible?
- —
Personal DTI + credit; lowest rate.
DSCR
20% down · 8.5% · 30yr
- Down + closing
- —
- Monthly P&I
- —
- Monthly cashflow
- —
- DSCR
- —
- Eligible?
- —
No personal income docs; deal must DSCR.
Hard money
10% down · 12.0% · 12mo
- Down + closing
- —
- Monthly P&I
- —
- Monthly cashflow
- —
- DSCR
- —
- Eligible?
- —
Short-term bridge; refi at stabilization.
Listing history 16 events
-
2026-06-18days on market $2,975,000 Active 106 DOM
-
2026-06-17days on market $2,975,000 Active 105 DOM
-
2026-06-16days on market $2,975,000 Active 104 DOM
-
2026-06-15days on market $2,975,000 Active 103 DOM
-
2026-06-13days on market $2,975,000 Active 101 DOM
-
2026-06-13days on market $2,975,000 Active 100 DOM
-
2026-06-09days on market $2,975,000 Active 97 DOM
-
2026-06-08days on market $2,975,000 Active 96 DOM
-
2026-06-07days on market $2,975,000 Active 95 DOM
-
2026-06-04days on market $2,975,000 Active 92 DOM
-
2026-06-03days on market $2,975,000 Active 91 DOM
-
2026-06-02days on market $2,975,000 Active 90 DOM
-
2026-06-01days on market $2,975,000 Active 89 DOM
-
2026-05-31days on market $2,975,000 Active 88 DOM
-
2026-04-22price $2,975,000 501-char remark
Show marketing remark (501 chars)
Located on North Lake Avenue, the major north/south corridor from Pasadena to Altadena providing a variety of eateries, financial services, transportation, personal service establishments, boutique and major retailers, has this multi-family, twelve unit building much to offer to residents and investors alike. Spacious units, covered surface parking, onsite laundry room, and more. Please respect the current tenants and do not go on to the property or make direct contact with the tenants. Thank you
-
2026-03-04$3,595,000 Active 501-char remark
Show marketing remark (501 chars)
Located on North Lake Avenue, the major north/south corridor from Pasadena to Altadena providing a variety of eateries, financial services, transportation, personal service establishments, boutique and major retailers, has this multi-family, twelve unit building much to offer to residents and investors alike. Spacious units, covered surface parking, onsite laundry room, and more. Please respect the current tenants and do not go on to the property or make direct contact with the tenants. Thank you
ⓘ Source: listings_history table (triggers on properties + properties_extension) + one-shot
backfill from property_details.listing_events for pre-trigger history.
Climate risk First Street
- Flood 1/10 Low FEMA zone X (unshaded) · 0% chance over 30 yrs
- Wildfire 2/10 Low
- Heat 6/10 Major 7 d/yr ≥98°F today · 19 d/yr by 30 yrs out
- Wind 1/10 Low
- Air quality 9/10 Extreme 21 unhealthy d/yr today · 24 by 30 yrs out
Nearby sold comps map
Loading sold comps map…
Walkable amenities ~0.75 mi
Loading nearby amenities…
Taxation est. · year 1
- Rental income
- $319,524
- − Mortgage interest
- −$166,646
- − Property taxes
- −$44,625
- − Insurance
- −$14,875
- − Repairs & maintenance
- −$25,562
- − Management
- −$25,562
- − Depreciation
- −$86,545
- Taxable loss
- −$44,292
- Est. tax savings @ 24.0%
- +$10,630
- After-tax cash flow
- $16,339/yr
For passive investors: Depreciation is non-cash, so a rental often shows a tax loss while cash-flowing — sheltering income. Rental losses are passive: they offset passive income freely, and up to $25,000/yr can offset ordinary (W-2) income if you actively participate and your MAGI is under $100k (phasing out to $0 by $150k); unused losses carry forward. On sale, claimed depreciation is recaptured at up to 25%, and gains may owe capital-gains tax (a 1031 exchange can defer both). Figures are a year-1 estimate at your 24.0% rate — not tax advice; consult a CPA.
Schools (NCES district)
- District
- Pasadena Unified
- NCES district ID
- 0629940
- Math proficiency
- 42% ▲ 7.00%
- Reading proficiency
- 60% ▲ 15.00%
- Median HH income
- $73,762
- Composite
- 45.82/100
- National rank
- #2557
- State rank
- #123 of 517 in CA
Livability — Pasadena
- Score
- 72/100
- State rank
- #181
- US rank
- #5981
Category grades
Schools grade is shown separately in the Schools card above.
Census & demographics
- Census place
- Pasadena, CA
- County
- Los Angeles County · 9,444,647 people
- City population
- 151,001
- Metro
- Los Angeles-Long Beach-Anaheim, CA
- Population (ZIP)
- 35,937
- Household income
- $105,958
- Rent vs Own
- Severe rent burden
- 1486.0
Population outlook (Los Angeles County) Hauer SSP2
- Today (2025)
- 10,940,515 people
- By 2030
- 11,256,481 · +2.9%
- By 2040
- 11,729,929 · +7.2%
- By 2050
- 11,948,407 · +9.2%
- By 2075
- 11,818,114 · +8.0%
- By 2100
- 10,842,928 · -0.9%
Race, ethnicity, and origin ACS 2023
- Neighborhood character
- Diverse neighborhood (Simpson 0.69)
- Race & ethnicity
- Hispanic / Latino 39% White 38% Two or more races 18% Asian 10% Black 6% Native American 1%
- Hispanic origin (detail)
- Mexican 28%
- Common ancestry
- Slovak 2% Scotch-Irish 2% Italian 2%
- Foreign-born
- 30% · Canada, China, South Korea
- Languages at home
- 54% English-only · Spanish 29% Other Indo-European 8% Chinese 2%
Political lean MEDSL · Los Angeles
- 2024 margin
- Solid D (+32.9) · D 64.8% · R 31.9% · Other 3.3%
- 2008→2024 swing
- -7.4pp toward R · 2008: 40.4pp · 2024: 32.9pp
- All cycles
- 2024: D+32.9 2020: D+44.2 2016: D+48.0 2012: D+40.0 2008: D+40.4
Not yet ingested
- Civics
- —
Market trends
- HPI YoY
- ▼ -1490.79%
- Current HPI
- 445.4741
- Rent YoY
- ▼ -0.63%
- Metro
- Los Angeles-Long Beach-Anaheim, CA
- State GDP YoY
- ▲ 3.21%
- F500 in state
- 116
Industry mix (Fortune 500 HQ in CA)
| Industry | F500 HQs | Revenue |
|---|---|---|
| Technology | 27 | $1,492B |
|
||
| Financial Services | 3 | $174B |
|
||
| Retail | 3 | $44B |
|
||
| Insurance | 3 | $26B |
|
||
| Media / Entertainment | 2 | $115B |
|
||
| Pharmaceuticals / Biotech | 2 | $62B |
|
||
Price history
-17.2% since first listed2 events — show timeline
- 2026-04-22 Price Changed $2,975,000 CRMLS
- 2026-03-04 Listed $3,595,000 CRMLS
Property tax history
+2.3%/yrLatest (2025): $5,843 · +6.9% YoY. Source: county tax records.
Cash-flow waterfall
monthlySold comps — $/sqft
last 12 mo · ≤1 miLoading sold comps…