 Duplex
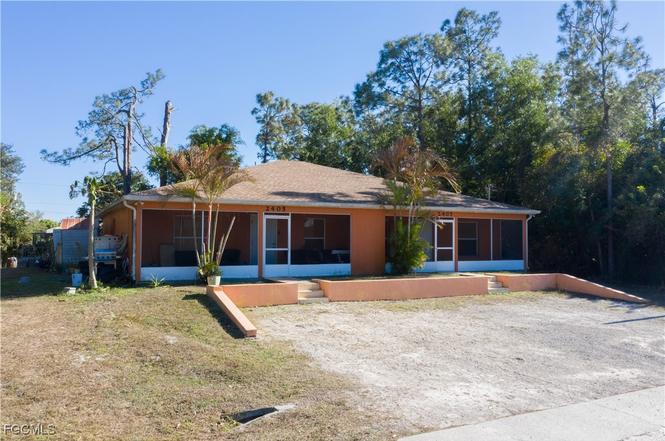
2405/2407 George Ave S · Lehigh Acres, FL
Flood risk 1/10 · Minimal
- FEMA flood zone
- X (unshaded)
- Chance of flooding over 30 yrs
- 0.0%
- Est. flood insurance / yr
- $507 – $1,088
Fire risk 3/10 · Minor
- Est. fire insurance / yr
- $947 – $1,759
Heat risk 10/10 · Severe
- Hot days now (above 107°F)
- 7 days/yr
- Hot days in 30 yrs
- 29 days/yr
Wind risk 10/10 · Severe
- Chance of severe wind over 30 yrs
- 99.0%
Air-quality risk 2/10 · Minimal
- Unhealthy air days now
- 1 days/yr
- Unhealthy air days in 30 yrs
- 1 days/yr
Risk factors via First Street. Map © Google.
Why this score? — see what drove the D+ grade
The composite is a weighted blend of 9 inputs, each scored 0–100. Each bar is that input's sub-score; the figure is the points it added to the 100-point composite (weight × sub-score).
- ARV discount +15.0/15.0
- Cash flow +13.7/30.0
- DSCR +4.1/10.0
- Schools +4.1/10.0
- 1% rule +3.8/10.0
- Livability +3.0/5.0
- Condition / age +2.5/5.0
- Appreciation +0.8/10.0
- Rent growth +0.8/5.0
$390,000
🖨 Deal sheet 📄 Offer letter ✓ Due diligence
Multi-family units
County records classify this as Multi-Family (2-4 Unit). Listing-text estimate: 2 units. confirmed
Listing remarks
Great opportunity in a prime Lehigh Acres location! A versatile property offering strong appeal for both homeowners and investors alike. This well-maintained residence features a newer roof for added peace of mind and a newly remodeled kitchen with modern finishes that make cooking and entertaining a pleasure. Situated in a great location, you’ll enjoy convenient access to shopping, dining, schools, and major roadways while still appreciating the privacy of a quiet neighborhood. Whether you’re looking for a smart investment or a place to call home, this property checks all the boxes with recent upgrades and excellent proximity to everyday amenities.
Key facts
- Newer roof
- 0.29 acre lot
- Built 2003
Tags
Property features AI
Finance
- Other: Tenants responsible for credit check, cable TV, electricity, janitorial service, and telephone; Pets allowed
- Financial info: Gross scheduled income: $40,200; Operating expenses: $1,900; One unit shows actual/pro forma rent of $1,650
- HOA & community: No association fee
Exterior
- Parking: No parking details provided
- Security: No security features listed
- Utilities: Well water; Septic tank sewer; Cable available
- Home design: Multifamily property with 1 building and 2 units; Resale condition; Zoned RM-2
- Construction: Block, concrete, and stucco construction; Shingle roof
- Exterior features: Rectangular lot; No listed exterior amenities
Interior
- Kitchen: Dishwasher; Range; Microwave (in one unit); Refrigerator; Freezer
- Bedrooms: Two 3-bedroom units
- Flooring: Tile flooring
- Bathrooms: Each unit has 2 full bathrooms (4 full bathrooms total)
- Heating & cooling: Central heating (electric); Central air conditioning (electric)
- Interior features: Single hung windows; Screened lanai/porch; Ceiling fans; Great room
- Laundry & utility: Washer and dryer in residence (in-unit laundry)
Neighborhood map
What this means for you Summary
Snapshot
- This is a 2 × 3-bed/2.0-bath units multifamily listed at $390k.
Deal economics
- At list price, monthly cash flow is $29 ($345/yr) — positive. Per door: $14/mo.
- The deal already cash-flows at list — no discount required.
- To meet the 1% rule (rent ≥ 1% of price), the offer needs to be $345k (11.6% below list).
- Recommended offer: $343k (12.0% below list) — sets the bar for market timing.
- Cap rate 6.4% vs local median 4.7% in Lehigh Acres — top-decile yield for the area; either an underpriced asset or a hidden risk that comps aren't pricing in. Stress-test before assuming the spread holds.
Location & tenants
- Location reads 59/100 on livability (#826 in FL) — a working-class tenant base; expect higher turnover. Strengths: cost of living A+, housing A+; Watch: crime C-, employment D+, schools D-.
- Lee (suburban): math 47% / reading 50% proficiency, ranked #42 of 73 in FL (top 58%) — families likely to look elsewhere, expect single-tenant / working-renter base with shorter leases.
- Market conditions: Rents falling (-7.0%/yr); 292 active listings in the ZIP; 4 comparable units currently listed for rent nearby; rentals at typical pace (median 24d on market — plan ~3-4 weeks tenant-placement turnaround); 15,411 units permitted in Lee County in 2024 (4,686 in 5+ unit buildings).
- At $3,448/mo this rent would consume 68% of the median local household income ($61k/yr) (locally 1142% of renters already pay >50% of income on rent) — very limited rent-growth headroom before tenants either downsize or default.
Forward outlook
- Local home prices are declining (-3.0%/yr); year-one equity from $3k of loan paydown is wiped out by about $12k of value loss. Plan a longer hold.
- Lee County population projected at +44% by 2050 — long-run rental-demand tailwind backs the buy-and-hold thesis.
Negotiation context
- It's been on market 132 days — a 12% lower offer ($343k) is reasonable based on typical stale-listing flexibility.
- 3 sale attempts; this cycle's ask is 25900% above the opening price — seller raised mid-cycle; expect resistance to lowballs.
Risks & watch-outs
- Climate carrying-cost: severe wind risk, 99% chance of damaging wind over 30y; extreme-heat days projected 7→29/yr by 2055 (HVAC capex compounding) — expect insurance premiums to compound above CPI over the hold.
Questions for the listing agent
- It's been on market 132 days. Have you received any prior offers? Is the seller open to a 12% concession, seller financing, or rate buy-down credit?
- Can we see the unit-by-unit rent roll, current vacancy, and any below-market leases? What's the average tenancy length?
- What capital expenditures (roof, boiler, parking lot, exteriors) have been made in the last 5 years, and what's planned in the next 2?
- Why hasn't it sold? Are there any deal-killer items the seller is aware of (foundation, flood, title, zoning, code violations)?
- Is there a deadline driving the sale (1031 exchange, divorce, estate, relocation)? That informs how much negotiation room exists.
- Schools are D-rated, which usually means shorter tenancies and higher turnover. Who's the typical renter profile here, and what's been the actual vacancy rate?
- The area grade is low — what's the realistic commute time and amenity access for the typical tenant pool here? Any planned neighborhood developments (good or bad) we should know about?
- What's the average days-on-market for RENTAL listings here right now (not sales)? A rising rental-DOM trend means longer vacancies and softer asking-rent achievability than the comps imply.
- What's the recent tenant-quality profile in this submarket — average credit score on applications, eviction rate, late-payment / NSF rate, and stable-employment percentage? A property-management company in the area should have these aggregated.
- How much new apartment / multifamily construction is in the pipeline within 1–3 miles? Heavy new supply (>2% of stock underway) typically softens rents 12–24 months out; light construction supports rent growth.
Investment metrics
- 1% rule
- 0.88% ✗
- Cap rate
- 6.38%
- Cash-on-cash
- 0.32%
- DSCR
- 1.01
- GRM
- 9.4
CMA / ARV
- ARV (on-the-fly)
- $531,450
- Comps found
- 10
Show comp detail 10 sales within ~0.75 mi
| Address | Dist | Beds/Ba | Sqft | Sold | Price | $/sf | Match |
|---|---|---|---|---|---|---|---|
| 4909-4911 28th St SW | 0.26mi | 6/4.0 | 2,392 (+1%) | 9mo | $550,000 | $230 | 78 |
| 4921 Golfview Blvd | 0.20mi | 6/4.0 | 2,362 (0%) | 22mo | $435,000 | $184 | 72 |
| 4937/4939 Leonard Blvd S | 0.10mi | 6/4.0 | 2,238 (-5%) | 18mo | $400,000 | $179 | 71 |
| 2413-2415 Ansel Ave S | 0.65mi | 6/4.0 | 2,398 (+2%) | 1mo | $460,000 | $192 | 66 |
| 2229/2231 Armour Rd | 0.34mi | 6/4.0 | 2,351 (-0%) | 20mo | $530,000 | $225 | 66 |
| 2206-2208 Leda Ave S | 0.48mi | 6/4.0 | 2,370 (+0%) | 13mo | $540,000 | $228 | 66 |
| 2213/2215 Leda Ave S | 0.44mi | 6/4.0 | 2,330 (-1%) | 18mo | $355,000 | $152 | 63 |
| 2405/2407 Paul Ave S | 0.40mi | 6/4.0 | 2,352 (-0%) | 22mo | $445,000 | $189 | 62 |
| 4452-4454 Golfview Blvd | 0.71mi | 6/4.0 | 2,400 (+2%) | 20mo | $550,000 | $229 | 48 |
| 2220 - 2222 Keith Ave S | 0.70mi | 6/4.0 | 2,350 (-0%) | 24mo | $540,000 | $230 | 47 |
Match score weights: distance 35% · size 25% · config 20% · recency 20%. Top-matched comps best support the ARV.
Projected returns pro-forma
-3.0% appreciation · 0.0% rent growth · sell at horizon
- IRR
- -19.2%
- Equity multiple
- 0.35×
- Total profit
- $-71,420
- Equity at exit
- $58,150
- IRR
- -19.7%
- Equity multiple
- 0.10×
- Total profit
- $-98,676
- Equity at exit
- $33,720
Cash invested: $109,200 (down + closing). Projections, not guarantees.
Landlord ↔ Tenant lean methodology
- Overall (STATE)
- 87 Strongly Landlord-Friendly
- State Florida
- 87 Strongly Landlord-Friendly · R+3
- County
- — inherits STATE
- City
- — inherits STATE
ZIP-level market 33973
- Home prices YoY
- -3.4%
- Rents YoY
- -7.0%
- Active inventory
- 292
- Price-to-rent
- 18.9×
Monthly cashflow live
- Estimated rent
- $3,448 high interval (Pro) →
- Mortgage (P&I)
- −$2,045
- Tax est. 1.5%
- −$488 /mo · $5,850/yr
- Insurance
- −$162
- HOA
- −$0
- Vacancy / Maint / Mgmt
- −$724
- Net cashflow
- $29
Break-even live
2-unit breakdown (identical units grouped — click to expand)
| Units | Beds | Baths | Est. rent |
|---|---|---|---|
| 2× units | 3 | 2 | $3,448 |
| #1 | 3 | 2 | $1,724 |
| #2 | 3 | 2 | $1,724 |
| Total (2 units) | $3,448 | ||
UW: 25.0% down · 7.5% · 30yr · 1.5% tax · 5.0% vac · 8.0% maint · 8.0% mgmt
Financing live
Cash to close
- Down payment
- $97,500
- Closing costs
- $11,700
- Reserves months
- —
- Total cash needed
- —
Loan-product check · same deal, 3 products live
Conventional
25% down · 7.5% · 30yr
- Down + closing
- —
- Monthly P&I
- —
- Monthly cashflow
- —
- DSCR
- —
- Eligible?
- —
Personal DTI + credit; lowest rate.
DSCR
20% down · 8.5% · 30yr
- Down + closing
- —
- Monthly P&I
- —
- Monthly cashflow
- —
- DSCR
- —
- Eligible?
- —
No personal income docs; deal must DSCR.
Hard money
10% down · 12.0% · 12mo
- Down + closing
- —
- Monthly P&I
- —
- Monthly cashflow
- —
- DSCR
- —
- Eligible?
- —
Short-term bridge; refi at stabilization.
Rent comps 4 comps
| Address | Beds | Baths | Sqft | Rent | $/sqft | DOM | Units | Dist |
|---|---|---|---|---|---|---|---|---|
| 2216 Leda Ave S Lehigh Acres, FL | 5.0 | 3.0 | 2750 | $2,470 | $0.90 | 16d | 1 | 0.47mi |
| 5214 25th St SW Lehigh Acres, FL | 6.0 | 4.0 | 2316 | $1,600 | $0.69 | 23d | 1 | 0.80mi |
| 1133 Ichabod Ave Lehigh Acres, FL | 6.0 | 4.0 | 2376 | $2,100 | $0.88 | 23d | 1 | 1.22mi |
| 10849 Timber Creek Dr Fort Myers, FL | 5.0 | 4.5 | 3357 | $4,000 | $1.19 | 23d | 1 | 1.40mi |
Listing history 16 events
-
2026-06-17days on market $390,000 Active 132 DOM
-
2026-06-16days on market $390,000 Active 131 DOM
-
2026-06-15days on market $390,000 Active 130 DOM
-
2026-06-13days on market $390,000 Active 128 DOM
-
2026-06-10days on market $390,000 Active 125 DOM
-
2026-06-09days on market $390,000 Active 124 DOM
-
2026-06-07days on market $390,000 Active 122 DOM
-
2026-06-02days on market $390,000 Active 117 DOM
-
2026-06-01days on market $390,000 Active 116 DOM
-
2026-06-01days on market $390,000 Active 115 DOM
-
2026-05-24$1,500
-
2026-05-14price $390,000
-
2026-02-25price $410,000
-
2026-02-05$435,000 Active
-
2026-01-03historical
-
2025-01-04$450,000 Active
ⓘ Source: listings_history table (triggers on properties + properties_extension) + one-shot
backfill from property_details.listing_events for pre-trigger history.
Climate risk First Street
- Flood 1/10 Low FEMA zone X (unshaded) · 0% chance over 30 yrs
- Wildfire 3/10 Moderate
- Heat 10/10 Extreme 7 d/yr ≥107°F today · 29 d/yr by 30 yrs out
- Wind 10/10 Extreme 99% chance of damaging wind over 30 yrs
- Air quality 2/10 Low 1 unhealthy d/yr today · 1 by 30 yrs out
Nearby sold comps map
Loading sold comps map…
Walkable amenities ~0.75 mi
Loading nearby amenities…
Taxation est. · year 1
- Rental income
- $41,376
- − Mortgage interest
- −$21,846
- − Property taxes
- −$5,850
- − Insurance
- −$1,950
- − Repairs & maintenance
- −$3,310
- − Management
- −$3,310
- − Depreciation
- −$11,345
- Taxable loss
- −$6,236
- Est. tax savings @ 24.0%
- +$1,497
- After-tax cash flow
- $1,841/yr
For passive investors: Depreciation is non-cash, so a rental often shows a tax loss while cash-flowing — sheltering income. Rental losses are passive: they offset passive income freely, and up to $25,000/yr can offset ordinary (W-2) income if you actively participate and your MAGI is under $100k (phasing out to $0 by $150k); unused losses carry forward. On sale, claimed depreciation is recaptured at up to 25%, and gains may owe capital-gains tax (a 1031 exchange can defer both). Figures are a year-1 estimate at your 24.0% rate — not tax advice; consult a CPA.
Schools (NCES district)
- District
- Lee
- NCES district ID
- 1201080
- Math proficiency
- 47% ▼ -11.00%
- Reading proficiency
- 50% ▼ -4.00%
- Median HH income
- $49,518
- Composite
- 41.49/100
- National rank
- #3458
- State rank
- #42 of 73 in FL
Livability — Lehigh Acres
- Score
- 59/100
- State rank
- #826
- US rank
- #20055
Category grades
Schools grade is shown separately in the Schools card above.
Census & demographics
- Census place
- Lehigh Acres, FL
- County
- Lee County · 788,662 people
- City population
- 130,638
- Metro
- Cape Coral-Fort Myers, FL
- Population (ZIP)
- 14,392
- Household income
- $60,530
- Rent vs Own
- Severe rent burden
- 1142.0
Population outlook (Lee County) Hauer SSP2
- Today (2025)
- 871,946 people
- By 2030
- 955,468 · +9.6%
- By 2040
- 1,113,587 · +27.7%
- By 2050
- 1,256,891 · +44.1%
- By 2075
- 1,560,270 · +78.9%
- By 2100
- 1,726,848 · +98.0%
Race, ethnicity, and origin ACS 2023
- Neighborhood character
- Diverse neighborhood (Simpson 0.67)
- Race & ethnicity
- Hispanic / Latino 41% Black 36% Two or more races 21% White 18%
- Hispanic origin (detail)
- Mexican 21% Puerto Rican 7% Cuban 4% Dominican 1%
- Common ancestry
- Hispanic 14% Russian 1% Estonian 1%
- Foreign-born
- 23% · Canada, China
- Languages at home
- 54% English-only · Spanish 31% French/Haitian/Cajun 13% Other Indo-European 1%
Political lean MEDSL · Lee
- 2024 margin
- Strong R (+28.4) · D 35.5% · R 63.9%
- 2008→2024 swing
- -18.0pp toward R · 2008: -10.4pp · 2024: -28.4pp
- All cycles
- 2024: R+28.4 2020: R+19.2 2016: R+20.4 2012: R+16.6 2008: R+10.4
Not yet ingested
- Civics
- —
Market trends
- HPI YoY
- ▼ -8.43%
- Current HPI
- 237.694
- Rent YoY
- ▼ -6.99%
- Metro
- Cape Coral-Fort Myers, FL
- State GDP YoY
- ▲ 3.28%
- F500 in state
- 36
Industry mix (Fortune 500 HQ in FL)
| Industry | F500 HQs | Revenue |
|---|---|---|
| Industrial Technology | 2 | $29B |
|
||
| Insurance | 2 | $17B |
|
||
| Retail | 1 | $60B |
|
||
| Technology Distribution | 1 | $58B |
|
||
| Homebuilding | 1 | $35B |
|
||
| Technology Manufacturing | 1 | $35B |
|
||
Price history
-99.7% since first listed6 events — show timeline
- 2026-05-24 Listed for Rent $1,500 FGCMLS
- 2026-05-14 Price Changed $390,000 FORTMLS
- 2026-02-25 Price Changed $410,000 FORTMLS
- 2026-02-05 Listed $435,000 FORTMLS
- 2026-01-03 Listing Removed — FORTMLS
- 2025-01-04 Listed $450,000 FORTMLS
Cash-flow waterfall
monthlySold comps — $/sqft
last 12 mo · ≤1 miLoading sold comps…