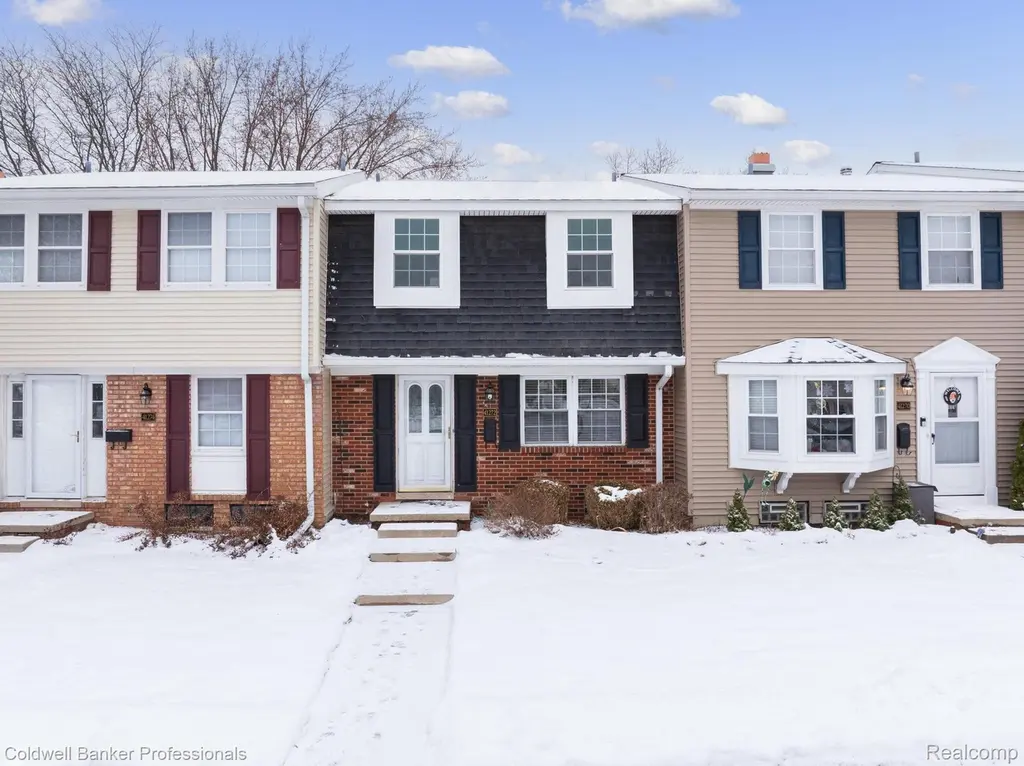
41272 Lehigh Ct · Northville, MI
Flood risk No data
- FEMA flood zone
- —
- Chance of flooding over 30 yrs
- —
- Est. flood insurance / yr
- —
Fire risk No data
- Est. fire insurance / yr
- —
Heat risk No data
- Hot days now (above threshold)
- —
- Hot days in 30 yrs
- —
Wind risk No data
- Chance of severe wind over 30 yrs
- —
Air-quality risk No data
- Unhealthy air days now
- —
- Unhealthy air days in 30 yrs
- —
Risk factors via First Street. Map © Google.
Why this score? — see what drove the D- grade
The composite is a weighted blend of 9 inputs, each scored 0–100. Each bar is that input's sub-score; the figure is the points it added to the 100-point composite (weight × sub-score).
- ARV discount +7.5/15.0
- Schools +6.6/10.0
- Cash flow +6.5/30.0
- Livability +4.4/5.0
- 1% rule +4.2/10.0
- Rent growth +3.5/5.0
- Condition / age +2.5/5.0
- DSCR +0.8/10.0
- Appreciation +0.0/10.0
$220,000
🖨 Deal sheet (PDF) 📄 Offer letter ✓ Due diligence
Listing remarks MLS
Charming 3-bed, 1.5-bath home in Northville! Enjoy a pool, private clubhouse, and proximity to shopping and dining. Your perfect blend of comfort and convenience awaits!
Key facts
- Private clubhouse
- $531 HOA
- Built 1971
Tags
Neighborhood map
What this means for you Summary
Snapshot
- This is a 3-bed/1.5-bath condo listed at $220k.
Deal economics
- At list price, monthly cash flow is $-371 ($-4k/yr) — negative.
- To cash-flow at today's rent, offer at most $154k (29.8% below list).
- To meet the 1% rule (rent ≥ 1% of price), the offer needs to be $201k (8.5% below list).
- Recommended offer: $154k (29.8% below list) — sets the bar for cash-flow.
- Cap rate 4.3% vs local median 1.8% in Northville — top-decile yield for the area; either an underpriced asset or a hidden risk that comps aren't pricing in. Stress-test before assuming the spread holds.
Location & tenants
- Location reads 88/100 on livability (#13 in MI, #205 nationally) — a professional / high-income tenant draw. Strengths: crime A+, amenities A+, employment A+; Watch: commute F.
- Northville Public Schools (suburban): math 68% / reading 75% proficiency, ranked #4 of 540 in MI (top 1%) — strong family-tenant draw, lease renewals of 3-5y typical; only 4% free/reduced lunch — higher-income household profile.
- Zoned schools: Silver Springs Elementary School (math 62% / reading 62%, grade B, #160 of 1,397 statewide, top 13%, 354 students, 19% FRL); Meads Mill Middle School (math 65% / reading 74%, grade A, #28 of 493 statewide, top 6%, 671 students, 9% FRL); Northville High School (math 68% / reading 86%, grade A-, #11 of 713 statewide, top 2%, 2,499 students, 7% FRL).
- Market conditions: Rents rising (+4.0%/yr); 222 active listings in the ZIP; 16 comparable units currently listed for rent nearby; rentals leasing fast (median 7d on market — plan ~1-2 weeks tenant-placement turnaround); high-income renter base; 2,639 units permitted in Wayne County in 2024 (1,216 in 5+ unit buildings).
Forward outlook
- Local home prices are declining (-3.0%/yr); year-one equity from $2k of loan paydown is wiped out by about $7k of value loss. Plan a longer hold.
- Wayne County population projected at -17% by 2050 — secular population decline; favor cash flow + early exit over multi-decade hold.
Negotiation context
- It's been on market 145 days — a 12% lower offer ($194k) is reasonable based on typical stale-listing flexibility.
- 6 sale attempts since 8y ago; this cycle's ask has dropped $19k (8%) from the opening price — seller is motivated, your offer sets the floor, not the list.
Risks & watch-outs
- Watch-outs: HOA is 26% of rent.
Questions for the listing agent
- What do current leases actually rent for vs. the listed asking? Can we see a recent rent roll and the last 12 months of T-12 income?
- It's been on market 145 days. Have you received any prior offers? Is the seller open to a 30% concession, seller financing, or rate buy-down credit?
- Built in 1971 — when were the roof, HVAC, electrical panel, plumbing, and water heater last replaced?
- What does the HOA fee cover, when was the last increase, and are there any pending special assessments or reserve-fund shortfalls?
- Any open or pending special assessments — roof, HVAC, plumbing, elevator, façade? What's the per-unit balance and payoff schedule, and is the seller paying it off at close or rolling it to the buyer?
- Why hasn't it sold? Are there any deal-killer items the seller is aware of (foundation, flood, title, zoning, code violations)?
- Is there a deadline driving the sale (1031 exchange, divorce, estate, relocation)? That informs how much negotiation room exists.
- Schools are A-rated — typically a magnet for longer-tenancy family renters. What's the average tenant stay here, and is there a school-zone premium baked into asking?
- The area grade is low — what's the realistic commute time and amenity access for the typical tenant pool here? Any planned neighborhood developments (good or bad) we should know about?
- What's the average days-on-market for RENTAL listings here right now (not sales)? A rising rental-DOM trend means longer vacancies and softer asking-rent achievability than the comps imply.
- What's the recent tenant-quality profile in this submarket — average credit score on applications, eviction rate, late-payment / NSF rate, and stable-employment percentage? A property-management company in the area should have these aggregated.
- How much new apartment / multifamily construction is in the pipeline within 1–3 miles? Heavy new supply (>2% of stock underway) typically softens rents 12–24 months out; light construction supports rent growth.
Investment metrics
- 1% rule
- 0.92% ✗
- Cap rate
- 4.27%
- Cash-on-cash
- -7.23%
- DSCR
- 0.68
- GRM
- 9.1
CMA / ARV
No comps found within radius.
Projected returns pro-forma
-3.0% appreciation · 3.97% rent growth · sell at horizon
- IRR
- -27.2%
- Equity multiple
- 0.07×
- Total profit
- $-57,008
- Equity at exit
- $32,803
- IRR
- -20.6%
- Equity multiple
- -0.15×
- Total profit
- $-70,557
- Equity at exit
- $19,022
Cash invested: $61,600 (down + closing). Projections, not guarantees.
Landlord ↔ Tenant lean methodology
- Overall (STATE)
- 62 Landlord-Friendly
- State Michigan
- 62 Landlord-Friendly · EVEN
- County
- — inherits STATE
- City
- — inherits STATE
ZIP-level market 48167
- Rents YoY
- 4.0%
- Active inventory
- 222
- Price-to-rent
- 9.1×
Monthly cashflow live
- Estimated rent
- $2,014 high interval (Pro) →
- Mortgage (P&I)
- −$1,154
- Tax from tax record
- −$186 /mo · $2,228/yr
- Insurance
- −$92
- HOA
- −$531
- Vacancy / Maint / Mgmt
- −$423
- Net cashflow
- $-371
Break-even live
Sensitivity live
| Price | -10% $-247 | -5% $-309 | +0% $-371 | +5% $-434 | +10% $-496 |
|---|---|---|---|---|---|
| Rent | -10% $-530 | -5% $-451 | +0% $-371 | +5% $-292 | +10% $-212 |
| Rate | -1.0pp $-260 | -0.5pp $-315 | base $-371 | +0.5pp $-428 | +1.0pp $-486 |
UW: 25.0% down · 7.5% · 30yr · 1.5% tax · 5.0% vac · 8.0% maint · 8.0% mgmt
Financing live
Cash to close
- Down payment
- $55,000
- Closing costs
- $6,600
- Reserves months
- —
- Total cash needed
- —
Loan-product check · same deal, 3 products live
Conventional
25% down · 7.5% · 30yr
- Down + closing
- —
- Monthly P&I
- —
- Monthly cashflow
- —
- DSCR
- —
- Eligible?
- —
Personal DTI + credit; lowest rate.
DSCR
20% down · 8.5% · 30yr
- Down + closing
- —
- Monthly P&I
- —
- Monthly cashflow
- —
- DSCR
- —
- Eligible?
- —
No personal income docs; deal must DSCR.
Hard money
10% down · 12.0% · 12mo
- Down + closing
- —
- Monthly P&I
- —
- Monthly cashflow
- —
- DSCR
- —
- Eligible?
- —
Short-term bridge; refi at stabilization.
Rent comps 16 comps
| Address | Beds | Baths | Sqft | Rent | $/sqft | DOM | Units | Dist |
|---|---|---|---|---|---|---|---|---|
| 42480 Corlina Dr Northville, MI | 2.0 | 2.5 | 1800 | $2,400 | $1.33 | 45d | 1 | 0.32mi |
| 19200 W Harbour Village Dr Northville, MI | 2.0 | 2.0 | 1222 | $1,874 | $1.53 | 13d | 10 | 0.32mi |
| 42824 Swan Lake Dr Northville, MI | 1.0–2.0 | 1.0–2.0 | 1062 | $1,699 | $1.60 | 6d | 15 | 0.37mi |
| 19675 Ironwood Ct Northville, MI | 2.0 | 1.5 | 1208 | $2,000 | $1.66 | 6d | 1 | 0.38mi |
| 19439 Northridge Dr Northville, MI | 2.0 | 1.0–2.0 | 880 | $1,484 | $1.69 | 45d | 4 | 0.44mi |
| 19130 Northridge Dr Northville, MI | 2.0 | 2.0 | 976 | $1,750 | $1.79 | 7d | 1 | 0.47mi |
| 19112 Northridge Dr Northville, MI | 2.0 | 2.0 | 1179 | $1,950 | $1.65 | 45d | 1 | 0.47mi |
| 43001 Northville Place Dr Northville, MI | 1.0–2.0 | 1.0–2.0 | 988 | $2,101 | $2.13 | 0d | 49 | 0.51mi |
| 18800 Innsbrook Dr Northville, MI | 1.0–3.0 | 1.0–2.0 | 1061 | $1,975 | $1.86 | 1d | 4 | 0.52mi |
| 19154 Northridge Dr Northville, MI | 2.0 | 2.0 | 1004 | $1,950 | $1.94 | 45d | 1 | 0.53mi |
| 20828 W Glen Haven Cir Northville, MI | 3.0 | 2.5 | 1863 | $2,000 | $1.07 | 3d | 1 | 0.69mi |
| 20969 Woodland Glen Dr Northville, MI | 1.0–2.0 | 1.0–2.0 | 947 | $1,639 | $1.73 | 5d | 12 | 0.74mi |
| 410 E Main St Northville, MI | 2.0 | 1.0 | 1100 | $2,000 | $1.82 | 26d | 1 | 0.80mi |
| 695 River Park Village Blvd Northville, MI | 2.0 | 1.5 | 1251 | $2,180 | $1.74 | 0d | 1 | 0.85mi |
| 150 Maincentre Northville, MI | 1.0–2.0 | 1.0–2.0 | 900 | $2,524 | $2.80 | 0d | 5 | 1.04mi |
| 646 East St Northville, MI | 2.0 | 2.5 | 1147 | $2,850 | $2.48 | 45d | 1 | 1.26mi |
HOA detail condo
- Monthly dues
- $531 · $6,372/yr
- Likely covers
- pool
- Assessments
- None detected in remarks — confirm with the listing agent.
Listing history 27 events
-
2026-05-06status Pending 169-char remark
Show marketing remark (169 chars)
Charming 3-bed, 1.5-bath home in Northville! Enjoy a pool, private clubhouse, and proximity to shopping and dining. Your perfect blend of comfort and convenience awaits!
-
2026-05-06status Pending 169-char remark
Show marketing remark (169 chars)
Charming 3-bed, 1.5-bath home in Northville! Enjoy a pool, private clubhouse, and proximity to shopping and dining. Your perfect blend of comfort and convenience awaits!
-
2026-03-31price $220,000 169-char remark
Show marketing remark (169 chars)
Charming 3-bed, 1.5-bath home in Northville! Enjoy a pool, private clubhouse, and proximity to shopping and dining. Your perfect blend of comfort and convenience awaits!
-
2026-03-30price $220,000 169-char remark
Show marketing remark (169 chars)
Charming 3-bed, 1.5-bath home in Northville! Enjoy a pool, private clubhouse, and proximity to shopping and dining. Your perfect blend of comfort and convenience awaits!
-
2026-01-23price $234,000 169-char remark
Show marketing remark (169 chars)
Charming 3-bed, 1.5-bath home in Northville! Enjoy a pool, private clubhouse, and proximity to shopping and dining. Your perfect blend of comfort and convenience awaits!
-
2026-01-22price $234,000 169-char remark
Show marketing remark (169 chars)
Charming 3-bed, 1.5-bath home in Northville! Enjoy a pool, private clubhouse, and proximity to shopping and dining. Your perfect blend of comfort and convenience awaits!
-
2025-12-12$239,000 Active 169-char remark
Show marketing remark (169 chars)
Charming 3-bed, 1.5-bath home in Northville! Enjoy a pool, private clubhouse, and proximity to shopping and dining. Your perfect blend of comfort and convenience awaits!
-
2025-12-12$239,000 Active 169-char remark
Show marketing remark (169 chars)
Charming 3-bed, 1.5-bath home in Northville! Enjoy a pool, private clubhouse, and proximity to shopping and dining. Your perfect blend of comfort and convenience awaits!
-
2022-10-25soldstatus $199,900
-
2022-10-24status Pending
-
2022-10-21soldstatus $199,900 Sold
-
2022-10-21soldstatus $199,900 Closed
-
2022-10-01historical
-
2022-09-22historical Accepting Backup Offers
-
2022-09-22historical Accepting Backup Offers
-
2022-09-08price $199,900
-
2022-09-08price $199,900
-
2022-08-22$215,000 Active
-
2022-08-22$215,000 Active
-
2018-07-11soldstatus $103,000
-
2018-06-20soldstatus $103,000 Sold
-
2018-06-20soldstatus $103,000 Closed
-
2018-04-03$99,000
-
2018-04-03historical
-
2018-04-03historical
-
2018-04-03$99,000
-
2006-03-07soldstatus $148,000
ⓘ Source: listings_history table (triggers on properties + properties_extension) + one-shot
backfill from property_details.listing_events for pre-trigger history.
Tax reassessment forecast MI · Partial reset (capped growth)
- Current annual tax
- $2,228 · $186/mo
- Projected year-2 tax
- $2,808 · $234/mo
- Expected delta
- +$580/yr (+$48/mo · 26.0%)
ⓘ Screening estimate from a state-policy table — verify with the county assessor before closing.
Nearby sold comps map
Loading sold comps map…
Walkable amenities ~0.75 mi
Loading nearby amenities…
Taxation est. · year 1
- Rental income
- $24,164
- − Mortgage interest
- −$12,323
- − Property taxes
- −$2,228
- − Insurance
- −$1,100
- − Repairs & maintenance
- −$1,933
- − Management
- −$1,933
- − HOA
- −$6,372
- − Depreciation
- −$6,400
- Taxable loss
- −$8,126
- Est. tax savings @ 24.0%
- +$1,950
- After-tax cash flow
- $-2,505/yr
For passive investors: Depreciation is non-cash, so a rental often shows a tax loss while cash-flowing — sheltering income. Rental losses are passive: they offset passive income freely, and up to $25,000/yr can offset ordinary (W-2) income if you actively participate and your MAGI is under $100k (phasing out to $0 by $150k); unused losses carry forward. On sale, claimed depreciation is recaptured at up to 25%, and gains may owe capital-gains tax (a 1031 exchange can defer both). Figures are a year-1 estimate at your 24.0% rate — not tax advice; consult a CPA.
Schools (NCES district)
- District
- Northville Public Schools
- NCES district ID
- 2625980
- Math proficiency
- 68% ▼ -5.00%
- Reading proficiency
- 75% ▼ -4.00%
- Median HH income
- $108,824
- Composite
- 66.21/100
- National rank
- #431
- State rank
- #4 of 540 in MI
Livability — Northville
- Score
- 88/100
- State rank
- #13
- US rank
- #205
Category grades
Schools grade is shown separately in the Schools card above.
Census & demographics
- County
- Wayne County · 1,562,939 people
- City population
- 24,713
- Metro
- Detroit-Warren-Dearborn, MI
- Population (ZIP)
- 24,713
- Household income
- $124,630
- Rent vs Own
- Severe rent burden
- 441.0
Population outlook (Wayne County) Hauer SSP2
- Today (2025)
- 1,675,273 people
- By 2030
- 1,620,300 · -3.3%
- By 2040
- 1,502,341 · -10.3%
- By 2050
- 1,384,039 · -17.4%
- By 2075
- 1,124,592 · -32.9%
- By 2100
- 881,193 · -47.4%
Race, ethnicity, and origin ACS 2023
- Neighborhood character
- Predominantly White (78%)
- Race & ethnicity
- White 78% Asian 10% Two or more races 5% Hispanic / Latino 4% Black 4%
- Common ancestry
- Romanian 11% Lithuanian 4% Slovak 3%
- Foreign-born
- 15% · Canada, China, South Korea
- Languages at home
- 85% English-only · Other Indo-European 4% Other Asian/Pacific 3% Chinese 2%
Political lean MEDSL · Wayne
- 2024 margin
- Strong D (+29.0) · D 62.7% · R 33.7% · Other 3.6%
- 2008→2024 swing
- -20.5pp toward R · 2008: 49.5pp · 2024: 29.0pp
- All cycles
- 2024: D+29.0 2020: D+38.1 2016: D+37.3 2012: D+46.9 2008: D+49.5
Not yet ingested
- Civics
- —
Market trends
- HPI YoY
- ▼ -275.65%
- Current HPI
- 176.171
- Rent YoY
- ▲ 3.97%
- Metro
- Detroit-Warren-Dearborn, MI
- State GDP YoY
- ▲ 1.37%
- F500 in state
- 28
Industry mix (Fortune 500 HQ in MI)
| Industry | F500 HQs | Revenue |
|---|---|---|
| Automotive Parts | 3 | $48B |
|
||
| Automotive | 2 | $372B |
|
||
| Chemicals | 1 | $45B |
|
||
| Automotive Retail | 1 | $29B |
|
||
| Healthcare / Medical Devices | 1 | $23B |
|
||
| Automotive Technology | 1 | $20B |
|
||
Price history
+48.6% since first listed27 events — show timeline
- 2026-05-06 Pending — MiRealSource-MiMLS
- 2026-05-06 Pending — REALCOMP
- 2026-03-31 Price Changed $220,000 MiRealSource-MiMLS
- 2026-03-30 Price Changed $220,000 REALCOMP
- 2026-01-23 Price Changed $234,000 MiRealSource-MiMLS
- 2026-01-22 Price Changed $234,000 REALCOMP
- 2025-12-12 Listed $239,000 REALCOMP
- 2025-12-12 Listed $239,000 MiRealSource-MiMLS
- 2022-10-25 Sold (Public Records) $199,900 Public Records
- 2022-10-24 Pending — REALCOMP
- 2022-10-21 Sold (MLS) $199,900 MiRealSource-MiMLS
- 2022-10-21 Sold (MLS) $199,900 REALCOMP
- 2022-10-01 Listing Removed — MiRealSource-MiMLS
- 2022-09-22 Contingent — MiRealSource-MiMLS
- 2022-09-22 Contingent — REALCOMP
- 2022-09-08 Price Changed $199,900 MiRealSource-MiMLS
- 2022-09-08 Price Changed $199,900 REALCOMP
- 2022-08-22 Listed $215,000 MiRealSource-MiMLS
- 2022-08-22 Listed $215,000 REALCOMP
- 2018-07-11 Sold (Public Records) $103,000 Public Records
- 2018-06-20 Sold (MLS) $103,000 MiRealSource-MiMLS
- 2018-06-20 Sold (MLS) $103,000 REALCOMP
- 2018-04-03 Listed $99,000 MiRealSource-MiMLS
- 2018-04-03 Listing Removed — MiRealSource-MiMLS
- 2018-04-03 Listing Removed — REALCOMP
- 2018-04-03 Listed $99,000 REALCOMP
- 2006-03-07 Sold (Public Records) $148,000 Public Records
Property tax history
+3.9%/yrLatest (2025): $2,228 · -38.3% YoY. Source: county tax records.
Cash-flow waterfall
monthlySold comps — $/sqft
last 12 mo · ≤1 miLoading sold comps…