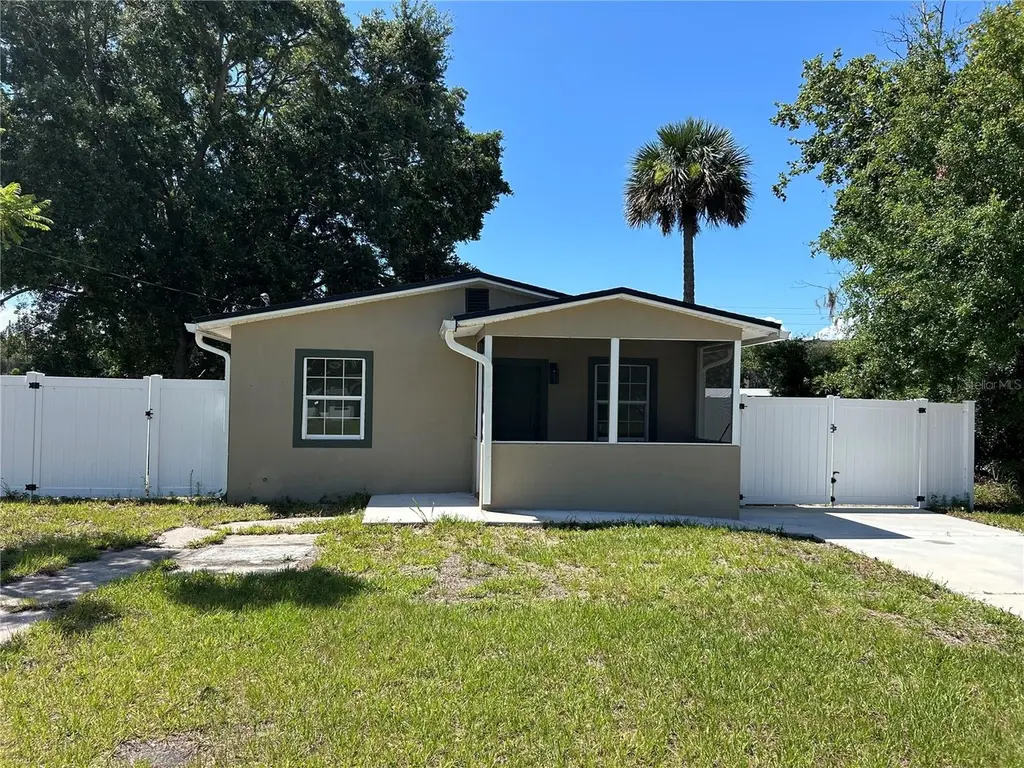
719 Lucky St · Titusville, FL
Flood risk 3/10 · Minor
- FEMA flood zone
- X (unshaded)
- Chance of flooding over 30 yrs
- 0.09%
- Est. flood insurance / yr
- $507 – $1,088
Fire risk 2/10 · Minimal
- Est. fire insurance / yr
- $947 – $1,759
Heat risk 10/10 · Severe
- Hot days now (above 108°F)
- 7 days/yr
- Hot days in 30 yrs
- 22 days/yr
Wind risk 10/10 · Severe
- Chance of severe wind over 30 yrs
- 99.0%
Air-quality risk 1/10 · Minimal
- Unhealthy air days now
- 0 days/yr
- Unhealthy air days in 30 yrs
- 0 days/yr
Risk factors via First Street. Map © Google.
Why this score? — see what drove the C- grade
The composite is a weighted blend of 9 inputs, each scored 0–100. Each bar is that input's sub-score; the figure is the points it added to the 100-point composite (weight × sub-score).
- Cash flow +18.9/30.0
- ARV discount +7.5/15.0
- DSCR +5.9/10.0
- Schools +4.7/10.0
- 1% rule +4.3/10.0
- Livability +4.2/5.0
- Rent growth +2.8/5.0
- Condition / age +2.5/5.0
- Appreciation +0.0/10.0
$144,900
🖨 Deal sheet 📄 Offer letter ✓ Due diligence
Listing remarks MLS
NICE INVESTMENT OR 1ST TIME HOME BUYER HOME. HOME HAS NEW TILE, AND CARPET, NEW WINDOWS, WILL HAVE CH & A, NEWER HOT WATER HEATER. NEW INTERIOR DOORS. CENTRALLY LOCATED
Key facts
- Spacious yard
- Renovated home
- Natural light
Tags
Property features AI
Finance
- Other: Property type: Residential, single family; Zoning: R1C; Lot size approximately 0.11 acre (45 x 100); Total rooms: 3; Unfurnished
- HOA & community: No association fees
Exterior
- Utilities: Public water; Public sewer; Electricity connected; Sewer connected; Water connected
- Home design: Single-family home; One story; Northwest facing; Entry level: One
- Construction: Block and concrete construction; Shingle roof; Slab foundation; Built area about 906 sq ft
- Exterior features: Screened porch; Storage; Vinyl fencing; Paved road access
Interior
- Kitchen: Dishwasher; Microwave; Range; Refrigerator
- Bedrooms: 2 bedrooms
- Bathrooms: 1 full bathroom
- Heating & cooling: Heat pump; Mini-split cooling unit(s)
- Interior features: Ceiling fans
- Laundry & utility: Outdoor laundry area
Neighborhood map
What this means for you Summary
Snapshot
- This is a 2-bed/1.0-bath single-family listed at $145k.
Deal economics
- At list price, monthly cash flow is $148 ($2k/yr) — positive.
- The deal already cash-flows at list — no discount required.
- To meet the 1% rule (rent ≥ 1% of price), the offer needs to be $135k (6.9% below list).
- Recommended offer: $135k (6.9% below list) — sets the bar for 1% rule.
Location & tenants
- Location reads 84/100 on livability (#42 in FL, #668 nationally) — a professional / high-income tenant draw. Strengths: commute A+, cost of living A+, housing A+; Watch: schools C-, crime D, employment D.
- Brevard (suburban): math 53% / reading 57% proficiency, ranked #19 of 73 in FL (top 26%) — acceptable for families but not a draw, mixed tenant base, ~2y average lease.
- Market conditions: Rents rising (+1.3%/yr); 462 active listings in the ZIP; 11 comparable units currently listed for rent nearby; rentals at typical pace (median 23d on market — plan ~3-4 weeks tenant-placement turnaround); 4,602 units permitted in Brevard County in 2024 (702 in 5+ unit buildings).
Forward outlook
- Local home prices are declining (-3.0%/yr); year-one equity from $1k of loan paydown is wiped out by about $4k of value loss. Plan a longer hold.
- Brevard County population projected at +15% by 2050 — modest demand growth; plan on rents tracking national, not racing it.
Negotiation context
- It's been on market 20 days — a 2% lower offer ($143k) is reasonable based on typical stale-listing flexibility.
- 2 sale attempts since 10y ago with the ask held roughly flat each time — persistent listings suggest the price (not the market) is what's stuck; bring a comps-based counter.
Risks & watch-outs
- Climate carrying-cost: severe wind risk, 99% chance of damaging wind over 30y; extreme-heat days projected 7→22/yr by 2055 (HVAC capex compounding) — expect insurance premiums to compound above CPI over the hold.
Questions for the listing agent
- Built in 1965 — when were the roof, HVAC, electrical panel, plumbing, and water heater last replaced?
- Is there a deadline driving the sale (1031 exchange, divorce, estate, relocation)? That informs how much negotiation room exists.
- Crime grade is D in this area — have there been break-ins, vandalism, or insurance claims at this property in the last 3 years? What carrier currently insures it and at what premium?
- What's the average days-on-market for RENTAL listings here right now (not sales)? A rising rental-DOM trend means longer vacancies and softer asking-rent achievability than the comps imply.
- What's the recent tenant-quality profile in this submarket — average credit score on applications, eviction rate, late-payment / NSF rate, and stable-employment percentage? A property-management company in the area should have these aggregated.
- How much new for-sale + rental construction is in the pipeline within 1–3 miles? Heavy new supply typically softens prices + rents 12–24 months out; constrained supply supports both.
Investment metrics
- 1% rule
- 0.93% ✗
- Cap rate
- 7.51%
- Cash-on-cash
- 4.36%
- DSCR
- 1.19
- GRM
- 8.9
CMA / ARV
No comps found within radius.
Projected returns pro-forma
-3.0% appreciation · 1.29% rent growth · sell at horizon
- IRR
- -11.3%
- Equity multiple
- 0.60×
- Total profit
- $-16,397
- Equity at exit
- $21,605
- IRR
- -4.6%
- Equity multiple
- 0.72×
- Total profit
- $-11,355
- Equity at exit
- $12,528
Cash invested: $40,572 (down + closing). Projections, not guarantees.
Landlord ↔ Tenant lean methodology
- Overall (STATE)
- 87 Strongly Landlord-Friendly
- State Florida
- 87 Strongly Landlord-Friendly · R+3
- County
- — inherits STATE
- City
- — inherits STATE
ZIP-level market 32780
- Rents YoY
- 1.3%
- Active inventory
- 462
- Price-to-rent
- 8.9×
Monthly cashflow live
- Estimated rent
- $1,349 high interval (Pro) →
- Mortgage (P&I)
- −$760
- Tax from tax record
- −$98 /mo · $1,179/yr
- Insurance
- −$60
- HOA
- −$0
- Vacancy / Maint / Mgmt
- −$283
- Net cashflow
- $148
Break-even live
UW: 25.0% down · 7.5% · 30yr · 1.5% tax · 5.0% vac · 8.0% maint · 8.0% mgmt
Financing live
Cash to close
- Down payment
- $36,225
- Closing costs
- $4,347
- Reserves months
- —
- Total cash needed
- —
Loan-product check · same deal, 3 products live
Conventional
25% down · 7.5% · 30yr
- Down + closing
- —
- Monthly P&I
- —
- Monthly cashflow
- —
- DSCR
- —
- Eligible?
- —
Personal DTI + credit; lowest rate.
DSCR
20% down · 8.5% · 30yr
- Down + closing
- —
- Monthly P&I
- —
- Monthly cashflow
- —
- DSCR
- —
- Eligible?
- —
No personal income docs; deal must DSCR.
Hard money
10% down · 12.0% · 12mo
- Down + closing
- —
- Monthly P&I
- —
- Monthly cashflow
- —
- DSCR
- —
- Eligible?
- —
Short-term bridge; refi at stabilization.
Rent comps 11 comps
| Address | Beds | Baths | Sqft | Rent | $/sqft | DOM | Units | Dist |
|---|---|---|---|---|---|---|---|---|
| 1516 Roger Dr Unit 2 Titusville, FL | 1.0 | 1.0 | 550 | $1,600 | $2.91 | 23d | 1 | 0.39mi |
| 1111 Kennedy Ct Titusville, FL | 2.0 | 1.0 | 550 | $1,275 | $2.32 | 23d | 1 | 0.45mi |
| 1710 S Washington Ave Unit 1 Titusville, FL | 2.0 | 1.0 | 710 | $1,250 | $1.76 | 23d | 1 | 0.61mi |
| 1710 S Washington Ave #16 Titusville, FL | 2.0 | 1.0 | 710 | $1,100 | $1.55 | 23d | 1 | 0.61mi |
| 320 Dummitt Ave Unit B Titusville, FL | 1.0 | 1.0 | 400 | $835 | $2.09 | 14d | 1 | 0.76mi |
| 1800 South St Titusville, FL | 1.0 | 1.0 | 657 | $900 | $1.37 | 23d | 1 | 0.83mi |
| 500 Rockpit Rd Titusville, FL | 2.0 | 1.0 | 700 | $1,050 | $1.50 | 23d | 1 | 0.92mi |
| 1600 Garden St Titusville, FL | 1.0 | 1.0 | 509 | $1,010 | $1.98 | 14d | 2 | 1.27mi |
| 3142 Sir Hamilton Cir Titusville, FL | 1.0 | 1.0 | 736 | $1,250 | $1.70 | 23d | 1 | 1.33mi |
| 2825 S Washington Ave Titusville, FL | 2.0 | 1.0 | 613 | $2,050 | $3.34 | 14d | 31 | 1.40mi |
| 2825 S Washington Ave Titusville, FL | 2.0 | 1.0 | 613 | $2,050 | $3.34 | 13d | 31 | 1.40mi |
Listing history 16 events
-
2026-06-18days on market $144,900 Active 20 DOM
-
2026-06-17days on market $144,900 Active 19 DOM
-
2026-06-16days on market $144,900 Active 18 DOM
-
2026-06-15days on market $144,900 Active 17 DOM
-
2026-06-14days on market $144,900 Active 15 DOM
-
2026-06-10days on market $144,900 Active 12 DOM
-
2026-06-08days on market $144,900 Active 10 DOM
-
2026-06-07days on market $144,900 Active 9 DOM
-
2026-06-05days on market $144,900 Active 6 DOM
-
2026-06-03days on market $144,900 Active 5 DOM
-
2026-06-02days on market $144,900 Active 4 DOM
-
2026-06-01days on market $144,900 Active 3 DOM
-
2026-05-31days on market $144,900 Active 2 DOM
-
2026-05-29$144,900 Active
-
2016-08-16historical 174-char remark
Show marketing remark (174 chars)
NICE INVESTMENT OR 1ST TIME HOME BUYER HOME. HOME HAS NEW TILE, AND CARPET, NEW WINDOWS, WILL HAVE CH & A, NEWER HOT WATER HEATER. NEW INTERIOR DOORS. CENTRALLY LOCATED
-
2016-02-04$37,500 174-char remark
Show marketing remark (174 chars)
NICE INVESTMENT OR 1ST TIME HOME BUYER HOME. HOME HAS NEW TILE, AND CARPET, NEW WINDOWS, WILL HAVE CH & A, NEWER HOT WATER HEATER. NEW INTERIOR DOORS. CENTRALLY LOCATED
ⓘ Source: listings_history table (triggers on properties + properties_extension) + one-shot
backfill from property_details.listing_events for pre-trigger history.
Tax reassessment forecast FL · Resets to sale price
- Current annual tax
- $1,179 · $98/mo
- Projected year-2 tax
- $1,203 · $100/mo
- Expected delta
- +$23/yr (+$2/mo · 2.0%)
ⓘ Screening estimate from a state-policy table — verify with the county assessor before closing.
Climate risk First Street
- Flood 3/10 Moderate FEMA zone X (unshaded) · 9% chance over 30 yrs
- Wildfire 2/10 Low
- Heat 10/10 Extreme 7 d/yr ≥108°F today · 22 d/yr by 30 yrs out
- Wind 10/10 Extreme 99% chance of damaging wind over 30 yrs
- Air quality 1/10 Low 0 unhealthy d/yr today · 0 by 30 yrs out
Nearby sold comps map
Loading sold comps map…
Walkable amenities ~0.75 mi
Loading nearby amenities…
Taxation est. · year 1
- Rental income
- $16,193
- − Mortgage interest
- −$8,117
- − Property taxes
- −$1,179
- − Insurance
- −$724
- − Repairs & maintenance
- −$1,295
- − Management
- −$1,295
- − Depreciation
- −$4,215
- Taxable loss
- −$633
- Est. tax savings @ 24.0%
- +$152
- After-tax cash flow
- $1,922/yr
For passive investors: Depreciation is non-cash, so a rental often shows a tax loss while cash-flowing — sheltering income. Rental losses are passive: they offset passive income freely, and up to $25,000/yr can offset ordinary (W-2) income if you actively participate and your MAGI is under $100k (phasing out to $0 by $150k); unused losses carry forward. On sale, claimed depreciation is recaptured at up to 25%, and gains may owe capital-gains tax (a 1031 exchange can defer both). Figures are a year-1 estimate at your 24.0% rate — not tax advice; consult a CPA.
Schools (NCES district)
- District
- Brevard
- NCES district ID
- 1200150
- Math proficiency
- 53% ▼ -9.00%
- Reading proficiency
- 57% ▼ -4.00%
- Median HH income
- $49,426
- Composite
- 46.86/100
- National rank
- #2370
- State rank
- #19 of 73 in FL
Livability — Titusville
- Score
- 84/100
- State rank
- #42
- US rank
- #668
Category grades
Schools grade is shown separately in the Schools card above.
Census & demographics
- Census place
- Titusville, FL
- County
- Brevard County · 602,871 people
- City population
- 60,286
- Metro
- Palm Bay-Melbourne-Titusville, FL
- Population (ZIP)
- 40,064
- Household income
- $67,690
- Rent vs Own
- Severe rent burden
- 1141.0
Population outlook (Brevard County) Hauer SSP2
- Today (2025)
- 623,254 people
- By 2030
- 648,420 · +4.0%
- By 2040
- 690,009 · +10.7%
- By 2050
- 715,669 · +14.8%
- By 2075
- 775,744 · +24.5%
- By 2100
- 776,687 · +24.6%
Race, ethnicity, and origin ACS 2023
- Neighborhood character
- Predominantly White (70%)
- Race & ethnicity
- White 70% Black 13% Hispanic / Latino 8% Two or more races 8% Asian 3%
- Hispanic origin (detail)
- Mexican 1% Puerto Rican 4% Cuban 1%
- Common ancestry
- Romanian 2% Slovak 2% Lithuanian 2%
- Foreign-born
- 8% · Canada, China
- Languages at home
- 89% English-only · Spanish 6% Other Indo-European 1% German/W. Germanic 1%
Political lean MEDSL · Brevard
- 2024 margin
- Strong R (+20.8) · D 39.1% · R 59.9% · Other 1.0%
- 2008→2024 swing
- -10.4pp toward R · 2008: -10.4pp · 2024: -20.8pp
- All cycles
- 2024: R+20.8 2020: R+16.4 2016: R+19.8 2012: R+12.7 2008: R+10.4
Not yet ingested
- Civics
- —
Market trends
- HPI YoY
- ▼ -162.54%
- Current HPI
- 297.151
- Rent YoY
- ▲ 1.29%
- Metro
- Palm Bay-Melbourne-Titusville, FL
- State GDP YoY
- ▲ 3.28%
- F500 in state
- 36
Industry mix (Fortune 500 HQ in FL)
| Industry | F500 HQs | Revenue |
|---|---|---|
| Industrial Technology | 2 | $29B |
|
||
| Insurance | 2 | $17B |
|
||
| Retail | 1 | $60B |
|
||
| Technology Distribution | 1 | $58B |
|
||
| Homebuilding | 1 | $35B |
|
||
| Technology Manufacturing | 1 | $35B |
|
||
Price history
+286.4% since first listed3 events — show timeline
- 2026-05-29 Listed $144,900 Stellar MLS as Distributed by MLS Grid
- 2016-08-16 Listing Removed — SCMLS
- 2016-02-04 Listed $37,500 SCMLS
Property tax history
+7.7%/yrLatest (2025): $1,179 · +3.8% YoY. Source: county tax records.
Cash-flow waterfall
monthlySold comps — $/sqft
last 12 mo · ≤1 miLoading sold comps…