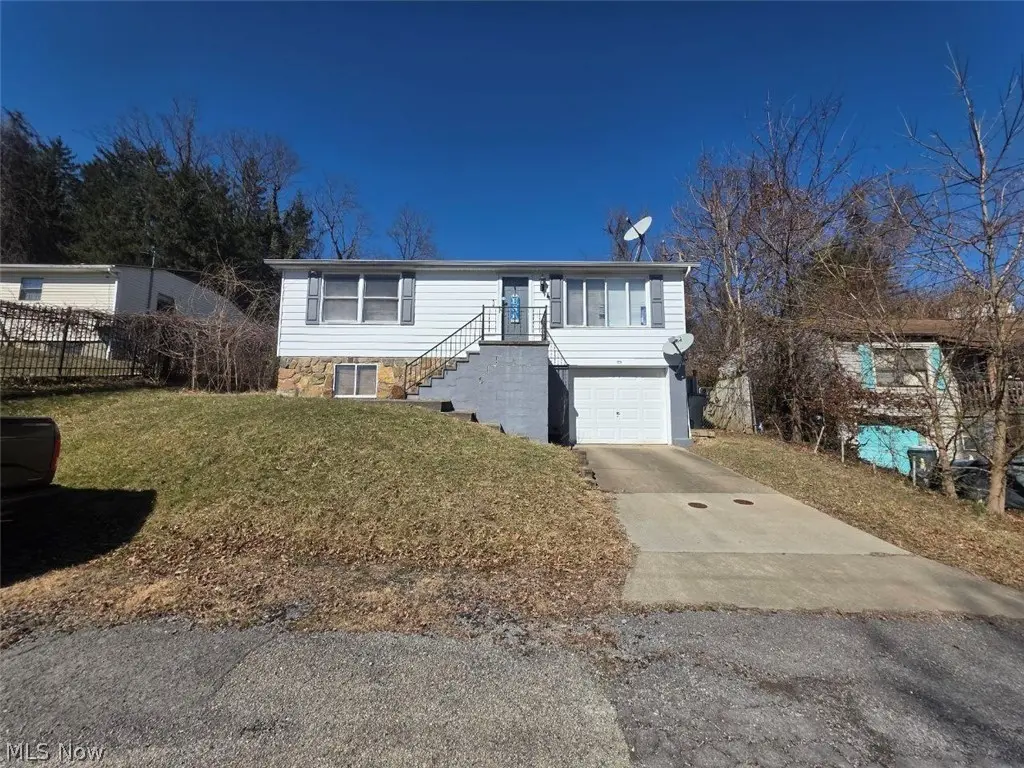
379 Spencer Ave · Morgantown, WV
Flood risk 1/10 · Minimal
- FEMA flood zone
- X (unshaded)
- Chance of flooding over 30 yrs
- 0.0%
- Est. flood insurance / yr
- $473 – $860
Fire risk 1/10 · Minimal
- Est. fire insurance / yr
- $787 – $1,461
Heat risk 4/10 · Minor
- Hot days now (above 97°F)
- 7 days/yr
- Hot days in 30 yrs
- 18 days/yr
Wind risk 1/10 · Minimal
- Chance of severe wind over 30 yrs
- —
Air-quality risk 2/10 · Minimal
- Unhealthy air days now
- 1 days/yr
- Unhealthy air days in 30 yrs
- 2 days/yr
Risk factors via First Street. Map © Google.
Why this score? — see what drove the D+ grade
The composite is a weighted blend of 9 inputs, each scored 0–100. Each bar is that input's sub-score; the figure is the points it added to the 100-point composite (weight × sub-score).
- ARV discount +15.0/15.0
- Cash flow +11.1/30.0
- Livability +4.2/5.0
- Schools +4.1/10.0
- DSCR +3.2/10.0
- Rent growth +2.9/5.0
- Condition / age +2.5/5.0
- 1% rule +2.4/10.0
- Appreciation +0.0/10.0
$135,000
🖨 Deal sheet (PDF) 📄 Offer letter ✓ Due diligence
Listing remarks
GREAT POTENTIAL! This 2-bedroom, 2-bath raised ranch offers 1,440 sq ft of living space and endless possibilities for the right buyer. The home features a finished basement, fenced-in backyard, and a spacious lot with room to expand or enjoy outdoor living. Great opportunity for investors, flippers, or buyers looking to build sweat equity!
Key facts
- Finished basement
- Spacious lot
- Fenced-in backyard
Tags
Property features AI
Finance
- Financial info: Annual tax amount available
Exterior
- Parking: Attached garage; Two garage spaces
- Utilities: Public water; Public sewer
- Home design: Single-story home
- Construction: Metal siding construction; Built per public records
- Exterior features: Metal siding
Interior
- Bedrooms: Two main-level bedrooms
- Bathrooms: Two full bathrooms; One main-level bathroom
- Heating & cooling: Central air conditioning
- Interior features: Finished basement
Neighborhood map
What this means for you Summary
Snapshot
- This is a 1-bed/1.5-bath single-family listed at $135k.
Deal economics
- At list price, monthly cash flow is $-54 ($-652/yr) — negative.
- To cash-flow at today's rent, offer at most $125k (7.1% below list).
- To meet the 1% rule (rent ≥ 1% of price), the offer needs to be $100k (25.6% below list).
- Recommended offer: $100k (25.6% below list) — sets the bar for 1% rule.
- Cap rate 5.8% vs local median 3.0% in Morgantown — top-decile yield for the area; either an underpriced asset or a hidden risk that comps aren't pricing in. Stress-test before assuming the spread holds.
Location & tenants
- Location reads 84/100 on livability (#5 in WV, #674 nationally) — a professional / high-income tenant draw. Strengths: amenities A+, commute A+, cost of living A+; Watch: employment D-.
- Monongalia County Schools (urban): math 45% / reading 53% proficiency, ranked #1 of 55 in WV (top 2%) — families likely to look elsewhere, expect single-tenant / working-renter base with shorter leases.
- Zoned schools: Mountainview Elementary School (math 43% / reading 43%, grade F, #86 of 377 statewide, top 23%, 703 students, 0% FRL); South Middle School (math 33% / reading 48%, grade F, #16 of 109 statewide, top 16%, 755 students, 0% FRL); Morgantown High School (math 49% / reading 73%, grade C+, #2 of 110 statewide, top 1%, 1,859 students, 0% FRL) — zoned schools average 0% FRL vs 32% district-wide (32 pts lower); this property's tenant base skews higher-income than the district average.
- Market conditions: Rents rising (+1.4%/yr); 127 active listings in the ZIP; 23 units permitted in Monongalia County in 2024 (15 in 5+ unit buildings).
Forward outlook
- Local home prices are declining (-3.0%/yr); year-one equity from $933 of loan paydown is wiped out by about $4k of value loss. Plan a longer hold.
- Monongalia County population projected at +38% by 2050 — long-run rental-demand tailwind backs the buy-and-hold thesis.
Negotiation context
- Only 4 days on market — expect competitive offers; lowballing is unlikely to land.
- Current owner paid $72k; list at $135k implies a 88% gain — meaningful room to come down on a strong offer.
Questions for the listing agent
- What do current leases actually rent for vs. the listed asking? Can we see a recent rent roll and the last 12 months of T-12 income?
- Built in 1979 — when were the roof, HVAC, electrical panel, plumbing, and water heater last replaced?
- Is there a deadline driving the sale (1031 exchange, divorce, estate, relocation)? That informs how much negotiation room exists.
- Schools are D-rated, which usually means shorter tenancies and higher turnover. Who's the typical renter profile here, and what's been the actual vacancy rate?
- The area grade is low — what's the realistic commute time and amenity access for the typical tenant pool here? Any planned neighborhood developments (good or bad) we should know about?
- What's the average days-on-market for RENTAL listings here right now (not sales)? A rising rental-DOM trend means longer vacancies and softer asking-rent achievability than the comps imply.
- What's the recent tenant-quality profile in this submarket — average credit score on applications, eviction rate, late-payment / NSF rate, and stable-employment percentage? A property-management company in the area should have these aggregated.
- How much new for-sale + rental construction is in the pipeline within 1–3 miles? Heavy new supply typically softens prices + rents 12–24 months out; constrained supply supports both.
Investment metrics
- 1% rule
- 0.74% ✗
- Cap rate
- 5.81%
- Cash-on-cash
- -1.73%
- DSCR
- 0.92
- GRM
- 11.2
CMA / ARV
- ARV (on-the-fly)
- $226,080
- Comps found
- 7
Show comp detail 7 sales within ~0.75 mi
| Address | Dist | Beds/Ba | Sqft | Sold | Price | $/sf | Match |
|---|---|---|---|---|---|---|---|
| 379 Spencer Ave | 0.00mi | 2/2.0 (+1) | 1,440 (0%) | 1mo | $130,000 | $90 | 92 |
| 313 Ross | 0.33mi | 2/2.0 (+1) | 1,392 (-3%) | 13mo | $242,000 | $174 | 62 |
| 416 E Brockway Ave | 0.38mi | 2/1.0 (+1) | 1,261 (-12%) | 12mo | $225,000 | $178 | 45 |
| 420 E Brockway Ave | 0.36mi | 2/1.5 (+1) | 1,620 (+12%) | 17mo | $163,000 | $101 | 43 |
| 145 Grandview Ave | 0.39mi | 2/2.0 (+1) | 1,260 (-12%) | 14mo | $235,000 | $187 | 43 |
| 529 Arch St | 0.53mi | 2/1.0 (+1) | 1,340 (-7%) | 19mo | $210,000 | $157 | 41 |
| 1004 Curtis | 0.44mi | 2/1.0 (+1) | 1,604 (+11%) | 22mo | $175,000 | $109 | 36 |
Match score weights: distance 35% · size 25% · config 20% · recency 20%. Top-matched comps best support the ARV.
Projected returns pro-forma
-3.0% appreciation · 1.42% rent growth · sell at horizon
- IRR
- -20.8%
- Equity multiple
- 0.29×
- Total profit
- $-26,946
- Equity at exit
- $20,129
- IRR
- -17.8%
- Equity multiple
- 0.09×
- Total profit
- $-34,319
- Equity at exit
- $11,672
Cash invested: $37,800 (down + closing). Projections, not guarantees.
Landlord ↔ Tenant lean methodology
- Overall (STATE)
- 83 Strongly Landlord-Friendly
- State West Virginia
- 83 Strongly Landlord-Friendly · R+22
- County
- — inherits STATE
- City
- — inherits STATE
ZIP-level market 26501
- Home prices YoY
- -30.1%
- Rents YoY
- 1.4%
- Active inventory
- 127
- Price-to-rent
- 11.2×
Monthly cashflow live
- Estimated rent
- $1,004 medium interval (Pro) →
- Mortgage (P&I)
- −$708
- Tax from tax record
- −$83 /mo · $998/yr
- Insurance
- −$56
- HOA
- −$0
- Vacancy / Maint / Mgmt
- −$211
- Net cashflow
- $-54
Break-even live
Sensitivity live
| Price | -10% $22 | -5% $-16 | +0% $-54 | +5% $-93 | +10% $-131 |
|---|---|---|---|---|---|
| Rent | -10% $-134 | -5% $-94 | +0% $-54 | +5% $-15 | +10% $25 |
| Rate | -1.0pp $14 | -0.5pp $-20 | base $-54 | +0.5pp $-89 | +1.0pp $-125 |
UW: 25.0% down · 7.5% · 30yr · 1.5% tax · 5.0% vac · 8.0% maint · 8.0% mgmt
Financing live
Cash to close
- Down payment
- $33,750
- Closing costs
- $4,050
- Reserves months
- —
- Total cash needed
- —
Loan-product check · same deal, 3 products live
Conventional
25% down · 7.5% · 30yr
- Down + closing
- —
- Monthly P&I
- —
- Monthly cashflow
- —
- DSCR
- —
- Eligible?
- —
Personal DTI + credit; lowest rate.
DSCR
20% down · 8.5% · 30yr
- Down + closing
- —
- Monthly P&I
- —
- Monthly cashflow
- —
- DSCR
- —
- Eligible?
- —
No personal income docs; deal must DSCR.
Hard money
10% down · 12.0% · 12mo
- Down + closing
- —
- Monthly P&I
- —
- Monthly cashflow
- —
- DSCR
- —
- Eligible?
- —
Short-term bridge; refi at stabilization.
Listing history 3 events
-
2026-05-12status Pending
-
2026-05-06$135,000 Active
-
1999-04-29soldstatus $72,000
ⓘ Source: listings_history table (triggers on properties + properties_extension) + one-shot
backfill from property_details.listing_events for pre-trigger history.
Tax reassessment forecast WV · Resets to sale price
- Current annual tax
- $998 · $83/mo
- Projected year-2 tax
- $998 · $83/mo
- Expected delta
- $0/yr ($0/mo · 0.0%)
ⓘ Screening estimate from a state-policy table — verify with the county assessor before closing.
Climate risk First Street
- Flood 1/10 Low FEMA zone X (unshaded) · 0% chance over 30 yrs
- Wildfire 1/10 Low
- Heat 4/10 Moderate 7 d/yr ≥97°F today · 18 d/yr by 30 yrs out
- Wind 1/10 Low
- Air quality 2/10 Low 1 unhealthy d/yr today · 2 by 30 yrs out
Nearby sold comps map
Loading sold comps map…
Walkable amenities ~0.75 mi
Loading nearby amenities…
Taxation est. · year 1
- Rental income
- $12,045
- − Mortgage interest
- −$7,562
- − Property taxes
- −$998
- − Insurance
- −$675
- − Repairs & maintenance
- −$964
- − Management
- −$964
- − Depreciation
- −$3,927
- Taxable loss
- −$3,044
- Est. tax savings @ 24.0%
- +$731
- After-tax cash flow
- $78/yr
For passive investors: Depreciation is non-cash, so a rental often shows a tax loss while cash-flowing — sheltering income. Rental losses are passive: they offset passive income freely, and up to $25,000/yr can offset ordinary (W-2) income if you actively participate and your MAGI is under $100k (phasing out to $0 by $150k); unused losses carry forward. On sale, claimed depreciation is recaptured at up to 25%, and gains may owe capital-gains tax (a 1031 exchange can defer both). Figures are a year-1 estimate at your 24.0% rate — not tax advice; consult a CPA.
Schools (NCES district)
- District
- Monongalia County Schools
- NCES district ID
- 5400930
- Math proficiency
- 45% ▼ -5.00%
- Reading proficiency
- 53% ▼ -2.00%
- Median HH income
- $43,820
- Composite
- 41.34/100
- National rank
- #3503
- State rank
- #1 of 55 in WV
Livability — Morgantown
- Score
- 84/100
- State rank
- #5
- US rank
- #674
Category grades
Schools grade is shown separately in the Schools card above.
Census & demographics
- Census place
- Morgantown, WV
- County
- Monongalia County · 97,252 people
- City population
- 97,252
- Metro
- Morgantown, WV
- Population (ZIP)
- 19,529
- Household income
- $63,529
- Rent vs Own
- Severe rent burden
- 595.0
Population outlook (Monongalia County) Hauer SSP2
- Today (2025)
- 122,188 people
- By 2030
- 131,536 · +7.7%
- By 2040
- 149,777 · +22.6%
- By 2050
- 168,245 · +37.7%
- By 2075
- 207,979 · +70.2%
- By 2100
- 239,430 · +96.0%
Race, ethnicity, and origin ACS 2023
- Neighborhood character
- Predominantly White (88%)
- Race & ethnicity
- White 88% Black 6% Two or more races 3% Hispanic / Latino 2% Asian 1%
- Common ancestry
- Slovak 4% Italian 3% Romanian 3%
- Foreign-born
- 2% · Canada
- Languages at home
- 96% English-only · Spanish 2%
Political lean MEDSL · Monongalia
- 2024 margin
- Toss-up / Even · D 46.5% · R 50.9% · Other 2.7%
- 2008→2024 swing
- -8.2pp toward R · 2008: 3.9pp · 2024: -4.4pp
- All cycles
- 2024: R+4.4 2020: R+1.2 2016: R+10.4 2012: R+9.7 2008: D+3.9
Not yet ingested
- Civics
- —
Market trends
- HPI YoY
- ▼ -95.15%
- Current HPI
- 220.911
- Rent YoY
- ▲ 1.42%
- Metro
- Morgantown, WV
- State GDP YoY
- —
- F500 in state
- 0
Price history
+87.5% since first listed3 events — show timeline
- 2026-05-12 Pending — MLSNOW
- 2026-05-06 Listed $135,000 MLSNOW
- 1999-04-29 Sold (Public Records) $72,000 Public Records
Property tax history
+2.6%/yrLatest (2025): $998 · -0.7% YoY. Source: county tax records.
Cash-flow waterfall
monthlySold comps — $/sqft
last 12 mo · ≤1 miLoading sold comps…