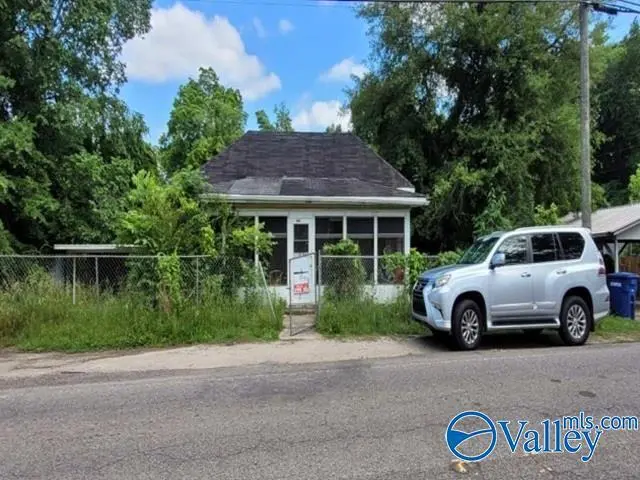
20591 Eastern Valley Rd · Woodstock, AL
Flood risk 5/10 · Moderate
- FEMA flood zone
- X (unshaded)
- Chance of flooding over 30 yrs
- 0.65%
- Est. flood insurance / yr
- $507 – $1,088
Fire risk 5/10 · Moderate
- Est. fire insurance / yr
- $916 – $1,700
Heat risk 6/10 · Moderate
- Hot days now (above 107°F)
- 7 days/yr
- Hot days in 30 yrs
- 19 days/yr
Wind risk 6/10 · Moderate
- Chance of severe wind over 30 yrs
- 59.0%
Air-quality risk 2/10 · Minimal
- Unhealthy air days now
- 1 days/yr
- Unhealthy air days in 30 yrs
- 3 days/yr
Risk factors via First Street. Map © Google.
Why this score? — see what drove the D+ grade
The composite is a weighted blend of 9 inputs, each scored 0–100. Each bar is that input's sub-score; the figure is the points it added to the 100-point composite (weight × sub-score).
- Cash flow +15.0/30.0
- ARV discount +7.5/15.0
- 1% rule +5.0/10.0
- DSCR +5.0/10.0
- Appreciation +4.8/10.0
- Livability +3.0/5.0
- Rent growth +2.5/5.0
- Condition / age +2.5/5.0
- Schools +1.8/10.0
$18,000
🖨 Deal sheet 📄 Offer letter ✓ Due diligence
Listing remarks
NO ACCESS OR VIEWINGS of this property. Please DO NOT DISTURB the occupant. Take a drive by this two bedroom, two bath home and see if it may be your next investment. "As is" cash only sale with no contingencies or inspections. Buyer will be responsible for obtaining possession of the property upon closing. Property may be subject to right of redemption.
Key facts
- 0.48 acre lot
- Parking
- Built 1900
Property features AI
Finance
- HOA & community: No homeowners association
Exterior
- Parking: Carport (1 space)
- Utilities: Public water; Public sewer
- Home design: Single-family residence; One level; Built in 1900; Frame construction
- Construction: Frame construction; One-story; Built in 1900
- Exterior features: Public water; Public sewer; Lot nearly half an acre (0.48 acre)
Interior
- Bedrooms: 5 total rooms (includes bedrooms and living spaces)
- Bathrooms: 2 full bathrooms
- Heating & cooling: Central heating; Central cooling
- Interior features: Basement; One fireplace
Neighborhood map
What this means for you Summary
Snapshot
- This is a 2-bed/2.0-bath single-family listed at $18k.
Deal economics
- At list price, monthly cash flow is $721 ($9k/yr) — positive.
- The deal already cash-flows at list — no discount required.
- Meets the 1% rule at list price ($1k rent vs $18k).
- Cap rate 54.3% vs local median 4.2% in Woodstock — top-decile yield for the area; either an underpriced asset or a hidden risk that comps aren't pricing in. Stress-test before assuming the spread holds.
Location & tenants
- Location reads 59/100 on livability (#320 in AL) — a working-class tenant base; expect higher turnover. Strengths: cost of living A+, housing A+; Watch: schools D, health & safety D, crime F.
- Bibb County (rural): math 12% / reading 31% proficiency, ranked #105 of 129 in AL (top 81%) — low school quality limits family demand, transient renter base, plan for 1-2y turnover.
- Market conditions: 32 active listings in the ZIP; 16 units permitted in Bibb County in 2024 (0 in 5+ unit buildings).
Forward outlook
- In year one you build about $39 of equity ($124 loan paydown + $-85 appreciation (-0.5% local appreciation)).
- Bibb County population projected at -13% by 2050 — secular population decline; favor cash flow + early exit over multi-decade hold.
- At projected returns (-0.5% appreciation + 3.0% rent growth), your $5k cash investment doubles in ~1 year — after that, you're playing with house money.
Negotiation context
- Only 9 days on market — expect competitive offers; lowballing is unlikely to land.
Risks & watch-outs
- Watch-outs: built in 1900 — expect roof / HVAC / electrical / plumbing capex.
- Climate carrying-cost: moderate flood risk; major wind risk, 59% chance of damaging wind over 30y; moderate wildfire risk; extreme-heat days projected 7→19/yr by 2055 (HVAC capex compounding) — expect insurance premiums to compound above CPI over the hold.
Questions for the listing agent
- Built in 1900 — when were the roof, HVAC, electrical panel, plumbing, and water heater last replaced?
- Is there a deadline driving the sale (1031 exchange, divorce, estate, relocation)? That informs how much negotiation room exists.
- Schools are D-rated, which usually means shorter tenancies and higher turnover. Who's the typical renter profile here, and what's been the actual vacancy rate?
- Crime grade is F in this area — have there been break-ins, vandalism, or insurance claims at this property in the last 3 years? What carrier currently insures it and at what premium?
- The area grade is low — what's the realistic commute time and amenity access for the typical tenant pool here? Any planned neighborhood developments (good or bad) we should know about?
- What's the average days-on-market for RENTAL listings here right now (not sales)? A rising rental-DOM trend means longer vacancies and softer asking-rent achievability than the comps imply.
- What's the recent tenant-quality profile in this submarket — average credit score on applications, eviction rate, late-payment / NSF rate, and stable-employment percentage? A property-management company in the area should have these aggregated.
- How much new for-sale + rental construction is in the pipeline within 1–3 miles? Heavy new supply typically softens prices + rents 12–24 months out; constrained supply supports both.
Investment metrics
- 1% rule
- 5.85% ✓
- Cap rate
- 54.34%
- Cash-on-cash
- 171.61%
- DSCR
- 8.64
- GRM
- 1.4
CMA / ARV
- ARV (on-the-fly)
- $226,144
- Comps found
- 6
Show comp detail 6 sales within ~0.75 mi
| Address | Dist | Beds/Ba | Sqft | Sold | Price | $/sf | Match |
|---|---|---|---|---|---|---|---|
| 222 Horn Cir | 0.06mi | 3/1.0 (+1) | 1,216 (+3%) | 11mo | $145,000 | $119 | 74 |
| 174 Worthington Dr | 0.17mi | 3/2.0 (+1) | 1,257 (+6%) | 19mo | $165,000 | $131 | 61 |
| 17152 Crescent Dr | 0.30mi | 3/2.0 (+1) | 1,200 (+1%) | 23mo | $238,500 | $199 | 60 |
| 21792 Eastern Valley Rd | 0.69mi | 3/2.0 (+1) | 1,200 (+1%) | 4mo | $75,000 | $63 | 57 |
| 12258 Richard St | 0.56mi | 3/2.0 (+1) | 1,260 (+6%) | 6mo | $257,500 | $204 | 53 |
| 1935 Grey Hill Rd | 0.38mi | 3/1.5 (+1) | 1,048 (-12%) | 24mo | $199,900 | $191 | 36 |
Match score weights: distance 35% · size 25% · config 20% · recency 20%. Top-matched comps best support the ARV.
Projected returns pro-forma
-0.47% appreciation · 3.0% rent growth · sell at horizon
- IRR
- —
- Equity multiple
- 9.93×
- Total profit
- $44,993
- Equity at exit
- $4,807
- IRR
- —
- Equity multiple
- 20.89×
- Total profit
- $100,248
- Equity at exit
- $5,453
Cash invested: $5,040 (down + closing). Projections, not guarantees.
Landlord ↔ Tenant lean methodology
- Overall (STATE)
- 90 Strongly Landlord-Friendly
- State Alabama
- 90 Strongly Landlord-Friendly · R+15
- County
- — inherits STATE
- City
- — inherits STATE
ZIP-level market 35188
- Home prices YoY
- -0.3%
- Active inventory
- 32
- Price-to-rent
- 1.4×
Monthly cashflow live
- Estimated rent
- $1,053 medium interval (Pro) →
- Mortgage (P&I)
- −$94
- Tax from tax record
- −$9 /mo · $111/yr
- Insurance
- −$8
- HOA
- −$0
- Vacancy / Maint / Mgmt
- −$221
- Net cashflow
- $721
Break-even live
UW: 25.0% down · 7.5% · 30yr · 1.5% tax · 5.0% vac · 8.0% maint · 8.0% mgmt
Financing live
Cash to close
- Down payment
- $4,500
- Closing costs
- $540
- Reserves months
- —
- Total cash needed
- —
Loan-product check · same deal, 3 products live
Conventional
25% down · 7.5% · 30yr
- Down + closing
- —
- Monthly P&I
- —
- Monthly cashflow
- —
- DSCR
- —
- Eligible?
- —
Personal DTI + credit; lowest rate.
DSCR
20% down · 8.5% · 30yr
- Down + closing
- —
- Monthly P&I
- —
- Monthly cashflow
- —
- DSCR
- —
- Eligible?
- —
No personal income docs; deal must DSCR.
Hard money
10% down · 12.0% · 12mo
- Down + closing
- —
- Monthly P&I
- —
- Monthly cashflow
- —
- DSCR
- —
- Eligible?
- —
Short-term bridge; refi at stabilization.
Listing history 7 events
-
2026-06-13statusdays on market $18,000 Pending 9 DOM
-
2026-06-10days on market $18,000 Active 7 DOM
-
2026-06-09days on market $18,000 Active 6 DOM
-
2026-06-08days on market $18,000 Active 5 DOM
-
2026-06-07days on market $18,000 Active 4 DOM
-
2026-06-03remarks 359-char remark
-
2026-06-03$18,000 Active 1 DOM
ⓘ Source: listings_history table (triggers on properties + properties_extension) + one-shot
backfill from property_details.listing_events for pre-trigger history.
Tax reassessment forecast AL · Resets to sale price
- Current annual tax
- $111 · $9/mo
- Projected year-2 tax
- $111 · $9/mo
- Expected delta
- $0/yr ($0/mo · 0.0%)
ⓘ Screening estimate from a state-policy table — verify with the county assessor before closing.
Climate risk First Street
- Flood 5/10 Major FEMA zone X (unshaded) · 65% chance over 30 yrs
- Wildfire 5/10 Major
- Heat 6/10 Major 7 d/yr ≥107°F today · 19 d/yr by 30 yrs out
- Wind 6/10 Major 59% chance of damaging wind over 30 yrs
- Air quality 2/10 Low 1 unhealthy d/yr today · 3 by 30 yrs out
Nearby sold comps map
Loading sold comps map…
Walkable amenities ~0.75 mi
Loading nearby amenities…
Taxation est. · year 1
- Rental income
- $12,637
- − Mortgage interest
- −$1,008
- − Property taxes
- −$111
- − Insurance
- −$90
- − Repairs & maintenance
- −$1,011
- − Management
- −$1,011
- − Depreciation
- −$524
- Taxable income
- $8,882
- Est. tax owed @ 24.0%
- −$2,132
- After-tax cash flow
- $6,518/yr
For passive investors: Depreciation is non-cash, so a rental often shows a tax loss while cash-flowing — sheltering income. Rental losses are passive: they offset passive income freely, and up to $25,000/yr can offset ordinary (W-2) income if you actively participate and your MAGI is under $100k (phasing out to $0 by $150k); unused losses carry forward. On sale, claimed depreciation is recaptured at up to 25%, and gains may owe capital-gains tax (a 1031 exchange can defer both). Figures are a year-1 estimate at your 24.0% rate — not tax advice; consult a CPA.
Schools (NCES district)
- District
- Bibb County
- NCES district ID
- 0100360
- Math proficiency
- 12% ▼ -22.00%
- Reading proficiency
- 31% ▼ -6.00%
- Median HH income
- $40,196
- Composite
- 18.14/100
- National rank
- #8964
- State rank
- #105 of 129 in AL
Livability — Woodstock
- Score
- 59/100
- State rank
- #320
- US rank
- #19763
Category grades
Schools grade is shown separately in the Schools card above.
Census & demographics
- Population (ZIP)
- 2,659
Population outlook (Bibb County) Hauer SSP2
- Today (2025)
- 21,965 people
- By 2030
- 21,437 · -2.4%
- By 2040
- 20,248 · -7.8%
- By 2050
- 19,023 · -13.4%
- By 2075
- 16,513 · -24.8%
- By 2100
- 14,871 · -32.3%
Race, ethnicity, and origin ACS 2023
- Neighborhood character
- Predominantly White (94%)
- Race & ethnicity
- White 94% Hispanic / Latino 3% Two or more races 3% Black 2%
- Common ancestry
- Lithuanian 1% Slovak 1% Portuguese 1%
- Foreign-born
- 1% · Canada
- Languages at home
- 98% English-only · Spanish 2%
Political lean MEDSL · Bibb
- 2024 margin
- Solid R (+64.4) · D 17.5% · R 81.9%
- 2008→2024 swing
- -18.6pp toward R · 2008: -45.8pp · 2024: -64.4pp
- All cycles
- 2024: R+64.4 2020: R+57.7 2016: R+55.5 2012: R+46.9 2008: R+45.8
Not yet ingested
- Civics
- —
Market trends
- HPI YoY
- ▼ -0.47%
- Current HPI
- 156.5471
- Rent YoY
- —
- Metro
- —
- State GDP YoY
- ▲ 2.94%
- F500 in state
- 4
Industry mix (Fortune 500 HQ in AL)
| Industry | F500 HQs | Revenue |
|---|---|---|
| Financial Services | 1 | $8B |
|
||
| Healthcare | 1 | $5B |
|
||
Price history
-70.0% since first listed2 events — show timeline
- 2026-06-03 Listed $18,000 VMLS
- 2004-11-04 Sold (Public Records) $60,000 Public Records
Property tax history
-1.9%/yrLatest (2025): $111 · +0.0% YoY. Source: county tax records.
Cash-flow waterfall
monthlySold comps — $/sqft
last 12 mo · ≤1 miLoading sold comps…