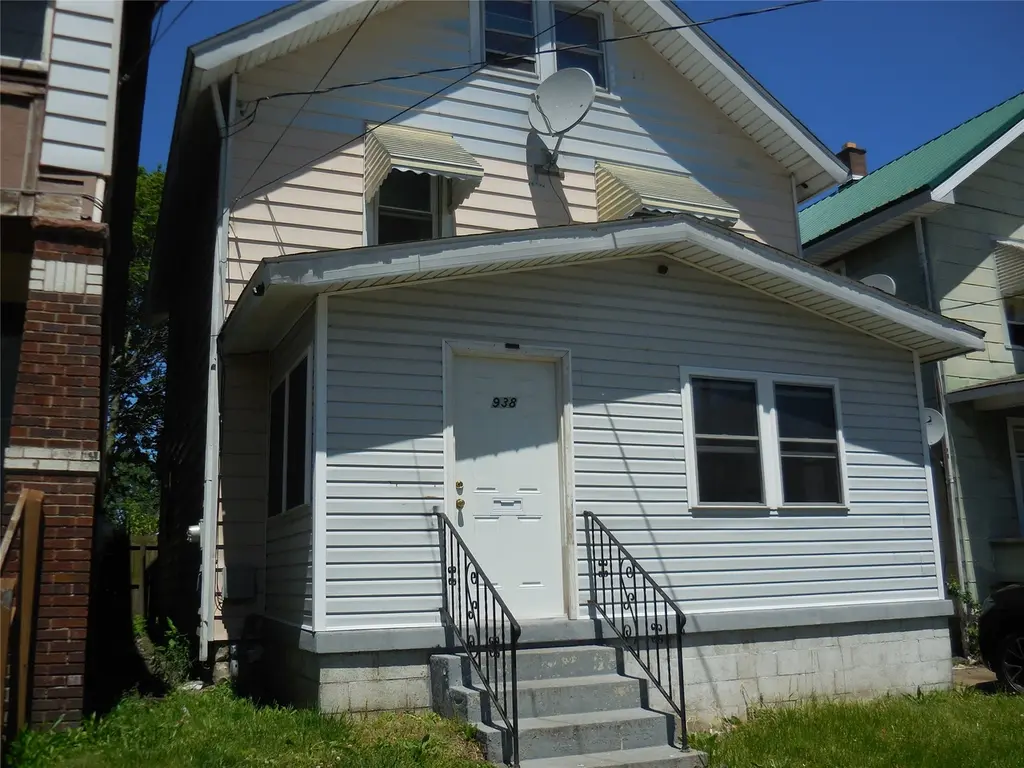
938 E 8 St · Erie, PA
Flood risk 1/10 · Minimal
- FEMA flood zone
- X (unshaded)
- Chance of flooding over 30 yrs
- 0.0%
- Est. flood insurance / yr
- $473 – $860
Fire risk 1/10 · Minimal
- Est. fire insurance / yr
- $511 – $949
Heat risk 3/10 · Minor
- Hot days now (above 90°F)
- 7 days/yr
- Hot days in 30 yrs
- 18 days/yr
Wind risk 1/10 · Minimal
- Chance of severe wind over 30 yrs
- —
Air-quality risk 2/10 · Minimal
- Unhealthy air days now
- 1 days/yr
- Unhealthy air days in 30 yrs
- 3 days/yr
Risk factors via First Street. Map © Google.
Why this score? — see what drove the D+ grade
The composite is a weighted blend of 9 inputs, each scored 0–100. Each bar is that input's sub-score; the figure is the points it added to the 100-point composite (weight × sub-score).
- Cash flow +16.2/30.0
- Appreciation +7.9/10.0
- DSCR +5.0/10.0
- 1% rule +4.2/10.0
- Livability +4.2/5.0
- Rent growth +2.5/5.0
- Condition / age +2.5/5.0
- ARV discount +2.0/15.0
- Schools +1.3/10.0
$105,000
🖨 Deal sheet 📄 Offer letter ✓ Due diligence
Listing remarks
This well-kept home offers comfort, updates and functionality throughout. Enjoy a large, deep fenced-in backyard-perfect for outdoor entertaining, pets or gardening. Inside you'll find numerous improvements including updated electric, new roof, newer vinyl windows, new furnace, newer hot water tank, updated kitchen with stainless appliances and new neutral carpet throughout the first floor providing peace of mind for years to come. The main bath has also been updated with granite and surround tub. Additional features include a walk up attic offering excellent storage space and a classic Pittsburgh toilet in the lower level for added convenience. At the end of the street is a Country Fair fo
Key facts
- New furnace
- Newer vinyl windows
- Updated electric
Tags
Property features AI
Finance
- Other: Lot dimensions approximately 27 x 165
- HOA & community: Sidewalks in the community
Exterior
- Utilities: Public water; Public sewer; Cable available; Natural gas available
- Home design: Single-family residence; Two levels; Residential property; R-1 zoning
- Construction: Aluminum siding; Composition roof; Full basement
- Exterior features: Storage area; Patio; Level lot; Paved road access; Shed(s)
Interior
- Kitchen: Gas oven; Gas range; Refrigerator
- Flooring: Carpet; Ceramic tile; Vinyl
- Bathrooms: 1 full bathroom
- Heating & cooling: Forced air heating; Ceiling fan(s); No central air
- Interior features: Ceiling fans; Window coverings and drapes; Exhaust fan
- Laundry & utility: Washer; Dryer
Neighborhood map
What this means for you Summary
Snapshot
- This is a 2-bed/1.0-bath single-family listed at $105k.
Deal economics
- At list price, monthly cash flow is $56 ($666/yr) — positive.
- The deal already cash-flows at list — no discount required.
- To meet the 1% rule (rent ≥ 1% of price), the offer needs to be $97k (7.6% below list).
- Recommended offer: $97k (7.6% below list) — sets the bar for 1% rule.
- Cap rate 6.9% vs local median 5.2% in Erie — top-decile yield for the area; either an underpriced asset or a hidden risk that comps aren't pricing in. Stress-test before assuming the spread holds.
Location & tenants
- Location reads 83/100 on livability (#109 in PA, #840 nationally) — a professional / high-income tenant draw. Strengths: amenities A+, commute A+, cost of living A+; Watch: crime D+, employment F.
- Erie City SD (urban): math 12% / reading 19% proficiency, ranked #510 of 539 in PA (top 95%) — low school quality limits family demand, transient renter base, plan for 1-2y turnover; 81% free/reduced lunch — lower-income household profile, screen leases tightly.
- Market conditions: 47 active listings in the ZIP; 9 comparable units currently listed for rent nearby; rentals lingering (median 44d on market — plan ~5-8 weeks vacancy on turnover, expect pricing pressure); 100% of comp listings sitting > 30 days — soft ceiling on asking rent; 364 units permitted in Erie County in 2024 (188 in 5+ unit buildings).
Forward outlook
- In year one you build about $7k of equity ($726 loan paydown + $6k appreciation (5.7% local appreciation)).
- Erie County population projected at -14% by 2050 — secular population decline; favor cash flow + early exit over multi-decade hold.
- At projected returns (5.7% appreciation + 3.0% rent growth), your $29k cash investment doubles in ~4 years — after that, you're playing with house money.
- By year 6, paydown + projected appreciation supports a ~$37k cash-out refi (75% LTV) — recoverable capital for the next deal without selling this one.
Negotiation context
- It's been on market 19 days — a 2% lower offer ($103k) is reasonable based on typical stale-listing flexibility.
- Current owner paid $31k; list at $105k implies a 240% gain — meaningful room to come down on a strong offer.
Risks & watch-outs
- Watch-outs: built in 1918 — expect roof / HVAC / electrical / plumbing capex.
Questions for the listing agent
- Built in 1918 — when were the roof, HVAC, electrical panel, plumbing, and water heater last replaced?
- Is there a deadline driving the sale (1031 exchange, divorce, estate, relocation)? That informs how much negotiation room exists.
- Crime grade is D in this area — have there been break-ins, vandalism, or insurance claims at this property in the last 3 years? What carrier currently insures it and at what premium?
- The area grade is low — what's the realistic commute time and amenity access for the typical tenant pool here? Any planned neighborhood developments (good or bad) we should know about?
- What's the average days-on-market for RENTAL listings here right now (not sales)? A rising rental-DOM trend means longer vacancies and softer asking-rent achievability than the comps imply.
- What's the recent tenant-quality profile in this submarket — average credit score on applications, eviction rate, late-payment / NSF rate, and stable-employment percentage? A property-management company in the area should have these aggregated.
- How much new for-sale + rental construction is in the pipeline within 1–3 miles? Heavy new supply typically softens prices + rents 12–24 months out; constrained supply supports both.
Investment metrics
- 1% rule
- 0.92% ✗
- Cap rate
- 6.93%
- Cash-on-cash
- 2.27%
- DSCR
- 1.10
- GRM
- 9.0
CMA / ARV
- ARV (on-the-fly)
- $93,632
- Comps found
- 12
Show comp detail 12 sales within ~0.75 mi
| Address | Dist | Beds/Ba | Sqft | Sold | Price | $/sf | Match |
|---|---|---|---|---|---|---|---|
| 1018 Pennsylvania Ave | 0.27mi | 3/1.0 (+1) | 1,294 (+5%) | 10mo | $45,000 | $35 | 66 |
| 734 E 7th St | 0.27mi | 3/1.0 (+1) | 1,320 (+7%) | 8mo | $81,000 | $61 | 64 |
| 614 Elm Ct | 0.47mi | 3/1.5 (+1) | 1,216 (-1%) | 9mo | $129,000 | $106 | 62 |
| 762 E 7th St | 0.23mi | 3/1.0 (+1) | 1,320 (+7%) | 13mo | $30,000 | $23 | 62 |
| 715 E 7th St | 0.30mi | 3/1.0 (+1) | 1,320 (+7%) | 11mo | $58,500 | $44 | 60 |
| 633 E 11th St | 0.47mi | 3/1.0 (+1) | 1,347 (+9%) | 2mo | $60,000 | $45 | 56 |
| 313 East Ave | 0.32mi | 3/1.0 (+1) | 1,100 (-11%) | 9mo | $163,000 | $148 | 55 |
| 424 Lighthouse St | 0.39mi | 3/1.5 (+1) | 1,385 (+12%) | 2mo | $105,000 | $76 | 53 |
| 1038 Queen St | 0.48mi | 3/1.0 (+1) | 1,364 (+11%) | 7mo | $130,000 | $95 | 49 |
| 716 Wallace St | 0.60mi | 3/1.0 (+1) | 1,312 (+6%) | 10mo | $75,200 | $57 | 47 |
| 618 Brandes St | 0.33mi | 3/1.0 (+1) | 1,056 (-14%) | 13mo | $105,000 | $99 | 45 |
| 403 Ash St | 0.53mi | 3/2.5 (+1) | 1,386 (+12%) | 13mo | $130,000 | $94 | 33 |
Match score weights: distance 35% · size 25% · config 20% · recency 20%. Top-matched comps best support the ARV.
Projected returns pro-forma
5.73% appreciation · 3.0% rent growth · sell at horizon
- IRR
- 16.6%
- Equity multiple
- 2.09×
- Total profit
- $32,180
- Equity at exit
- $64,224
- IRR
- 16.6%
- Equity multiple
- 4.14×
- Total profit
- $92,369
- Equity at exit
- $114,958
Cash invested: $29,400 (down + closing). Projections, not guarantees.
Landlord ↔ Tenant lean methodology
- Overall (STATE)
- 62 Landlord-Friendly
- State Pennsylvania
- 62 Landlord-Friendly · EVEN
- County
- — inherits STATE
- City
- — inherits STATE
ZIP-level market 16503
- Home prices YoY
- 4.4%
- Active inventory
- 47
- Price-to-rent
- 9.0×
Monthly cashflow live
- Estimated rent
- $970 high interval (Pro) →
- Mortgage (P&I)
- −$551
- Tax from tax record
- −$116 /mo · $1,398/yr
- Insurance
- −$44
- HOA
- −$0
- Vacancy / Maint / Mgmt
- −$204
- Net cashflow
- $56
Break-even live
UW: 25.0% down · 7.5% · 30yr · 1.5% tax · 5.0% vac · 8.0% maint · 8.0% mgmt
Financing live
Cash to close
- Down payment
- $26,250
- Closing costs
- $3,150
- Reserves months
- —
- Total cash needed
- —
Loan-product check · same deal, 3 products live
Conventional
25% down · 7.5% · 30yr
- Down + closing
- —
- Monthly P&I
- —
- Monthly cashflow
- —
- DSCR
- —
- Eligible?
- —
Personal DTI + credit; lowest rate.
DSCR
20% down · 8.5% · 30yr
- Down + closing
- —
- Monthly P&I
- —
- Monthly cashflow
- —
- DSCR
- —
- Eligible?
- —
No personal income docs; deal must DSCR.
Hard money
10% down · 12.0% · 12mo
- Down + closing
- —
- Monthly P&I
- —
- Monthly cashflow
- —
- DSCR
- —
- Eligible?
- —
Short-term bridge; refi at stabilization.
Rent comps 9 comps
| Address | Beds | Baths | Sqft | Rent | $/sqft | DOM | Units | Dist |
|---|---|---|---|---|---|---|---|---|
| 622 E 4th St Erie, PA | 3.0 | 1.0 | 1500 | $1,250 | $0.83 | 43d | 1 | 0.51mi |
| 519 E 6th St Unit 3 Erie, PA | 2.0 | 1.0 | 900 | $775 | $0.86 | 43d | 1 | 0.54mi |
| 612 E 14th St #1 Erie, PA | 3.0 | 1.0 | 775 | $850 | $1.10 | 43d | 1 | 0.57mi |
| 1404 E Lake Rd Unit 2 Erie, PA | 2.0 | 1.0 | 800 | $750 | $0.94 | 43d | 1 | 0.58mi |
| 407 E 13th St Unit 2 Erie, PA | 2.0 | 1.0 | 750 | $850 | $1.13 | 43d | 1 | 0.76mi |
| 614 E 22nd St Unit 1 Erie, PA | 3.0 | 1.0 | 1300 | $1,000 | $0.77 | 43d | 1 | 1.00mi |
| 626 E 23rd St Unit 2 Erie, PA | 3.0 | 1.0 | 850 | $800 | $0.94 | 43d | 1 | 1.05mi |
| 100 Erie Insurance Pl Erie, PA | 3.0 | 1.0 | 1120 | $1,425 | $1.27 | 43d | 1 | 1.12mi |
| 16 W 5th St Apt 504 Erie, PA | 2.0 | 1.5 | 1072 | $2,499 | $2.33 | 43d | 1 | 1.25mi |
Listing history 16 events
-
2026-06-19days on market $105,000 Active 19 DOM
-
2026-06-18days on market $105,000 Active 18 DOM
-
2026-06-17days on market $105,000 Active 17 DOM
-
2026-06-16days on market $105,000 Active 16 DOM
-
2026-06-15days on market $105,000 Active 15 DOM
-
2026-06-14days on market $105,000 Active 13 DOM
-
2026-06-13days on market $105,000 Active 12 DOM
-
2026-06-10days on market $105,000 Active 10 DOM
-
2026-06-09days on market $105,000 Active 9 DOM
-
2026-06-08days on market $105,000 Active 8 DOM
-
2026-06-07days on market $105,000 Active 7 DOM
-
2026-06-05days on market $105,000 Active 4 DOM
-
2026-06-03days on market $105,000 Active 3 DOM
-
2026-06-02days on market $105,000 Active 2 DOM
-
2026-06-01remarks 699-char remark
-
2026-06-01$105,000 Active 1 DOM
ⓘ Source: listings_history table (triggers on properties + properties_extension) + one-shot
backfill from property_details.listing_events for pre-trigger history.
Tax reassessment forecast PA · Partial reset (capped growth)
- Current annual tax
- $1,398 · $116/mo
- Projected year-2 tax
- $1,528 · $127/mo
- Expected delta
- +$131/yr (+$11/mo · 9.3%)
ⓘ Screening estimate from a state-policy table — verify with the county assessor before closing.
Climate risk First Street
- Flood 1/10 Low FEMA zone X (unshaded) · 0% chance over 30 yrs
- Wildfire 1/10 Low
- Heat 3/10 Moderate 7 d/yr ≥90°F today · 18 d/yr by 30 yrs out
- Wind 1/10 Low
- Air quality 2/10 Low 1 unhealthy d/yr today · 3 by 30 yrs out
Nearby sold comps map
Loading sold comps map…
Walkable amenities ~0.75 mi
Loading nearby amenities…
Taxation est. · year 1
- Rental income
- $11,641
- − Mortgage interest
- −$5,882
- − Property taxes
- −$1,398
- − Insurance
- −$525
- − Repairs & maintenance
- −$931
- − Management
- −$931
- − Depreciation
- −$3,055
- Taxable loss
- −$1,080
- Est. tax savings @ 24.0%
- +$259
- After-tax cash flow
- $925/yr
For passive investors: Depreciation is non-cash, so a rental often shows a tax loss while cash-flowing — sheltering income. Rental losses are passive: they offset passive income freely, and up to $25,000/yr can offset ordinary (W-2) income if you actively participate and your MAGI is under $100k (phasing out to $0 by $150k); unused losses carry forward. On sale, claimed depreciation is recaptured at up to 25%, and gains may owe capital-gains tax (a 1031 exchange can defer both). Figures are a year-1 estimate at your 24.0% rate — not tax advice; consult a CPA.
Schools (NCES district)
- District
- Erie City SD
- NCES district ID
- 4209300
- Math proficiency
- 12% ▼ -11.00%
- Reading proficiency
- 19% ▼ -16.00%
- Median HH income
- $33,625
- Composite
- 12.59/100
- National rank
- #9617
- State rank
- #510 of 539 in PA
Livability — Erie
- Score
- 83/100
- State rank
- #109
- US rank
- #840
Category grades
Schools grade is shown separately in the Schools card above.
Census & demographics
- Census place
- Erie, PA
- City population
- 92,215
- Population (ZIP)
- 15,204
Population outlook (Erie County) Hauer SSP2
- Today (2025)
- 272,159 people
- By 2030
- 266,299 · -2.2%
- By 2040
- 250,987 · -7.8%
- By 2050
- 234,925 · -13.7%
- By 2075
- 199,164 · -26.8%
- By 2100
- 162,985 · -40.1%
Race, ethnicity, and origin ACS 2023
- Neighborhood character
- Diverse neighborhood (Simpson 0.65)
- Race & ethnicity
- White 45% Black 37% Hispanic / Latino 10% Two or more races 8% Asian 2%
- Hispanic origin (detail)
- Mexican 2% Puerto Rican 7%
- Common ancestry
- Romanian 6% Scotch-Irish 1% Lithuanian 1%
- Foreign-born
- 6% · India, Canada
- Languages at home
- 90% English-only · Spanish 4% Arabic 2% Other Indo-European 2%
Political lean MEDSL · Erie
- 2024 margin
- Toss-up / Even · D 49.0% · R 50.0%
- 2008→2024 swing
- -20.9pp toward R · 2008: 19.9pp · 2024: -1.0pp
- All cycles
- 2024: R+1.0 2020: D+1.0 2016: R+2.0 2012: D+16.9 2008: D+19.9
Not yet ingested
- Civics
- —
Market trends
- HPI YoY
- ▲ 5.73%
- Current HPI
- 135.5955
- Rent YoY
- —
- Metro
- —
- State GDP YoY
- ▲ 1.68%
- F500 in state
- 34
Industry mix (Fortune 500 HQ in PA)
| Industry | F500 HQs | Revenue |
|---|---|---|
| Healthcare | 2 | $309B |
|
||
| Insurance | 2 | $27B |
|
||
| Telecommunications / Media | 1 | $124B |
|
||
| Industrial Distribution | 1 | $22B |
|
||
| Financial Services | 1 | $20B |
|
||
| Chemicals / Materials | 1 | $18B |
|
||
Price history
+281.8% since first listed3 events — show timeline
- 2026-06-01 Listed $105,000 GEBOR
- 2003-01-21 Sold (Public Records) $30,900 Public Records
- 1987-10-02 Sold (Public Records) $27,500 Public Records
Property tax history
+1.9%/yrLatest (2026): $1,398 · +3.4% YoY. Source: county tax records.
Cash-flow waterfall
monthlySold comps — $/sqft
last 12 mo · ≤1 miLoading sold comps…