2850 Hidden Springs Cir · Placerville, CA
Flood risk 1/10 · Minimal
- FEMA flood zone
- X (unshaded)
- Chance of flooding over 30 yrs
- 0.0%
- Est. flood insurance / yr
- $507 – $1,088
Fire risk 9/10 · Severe
- Est. fire insurance / yr
- $659 – $1,223
Heat risk 6/10 · Moderate
- Hot days now (above 99°F)
- 7 days/yr
- Hot days in 30 yrs
- 16 days/yr
Wind risk 1/10 · Minimal
- Chance of severe wind over 30 yrs
- —
Air-quality risk 10/10 · Severe
- Unhealthy air days now
- 31 days/yr
- Unhealthy air days in 30 yrs
- 38 days/yr
Risk factors via First Street. Map © Google.
Why this score? — see what drove the B grade
The composite is a weighted blend of 9 inputs, each scored 0–100. Each bar is that input's sub-score; the figure is the points it added to the 100-point composite (weight × sub-score).
- Cash flow +30.0/30.0
- 1% rule +10.0/10.0
- DSCR +10.0/10.0
- ARV discount +7.6/15.0
- Rent growth +5.0/5.0
- Schools +3.3/10.0
- Livability +3.1/5.0
- Condition / age +2.5/5.0
- Appreciation +0.0/10.0
$98,000
🖨 Deal sheet 📄 Offer letter ✓ Due diligence
Listing remarks
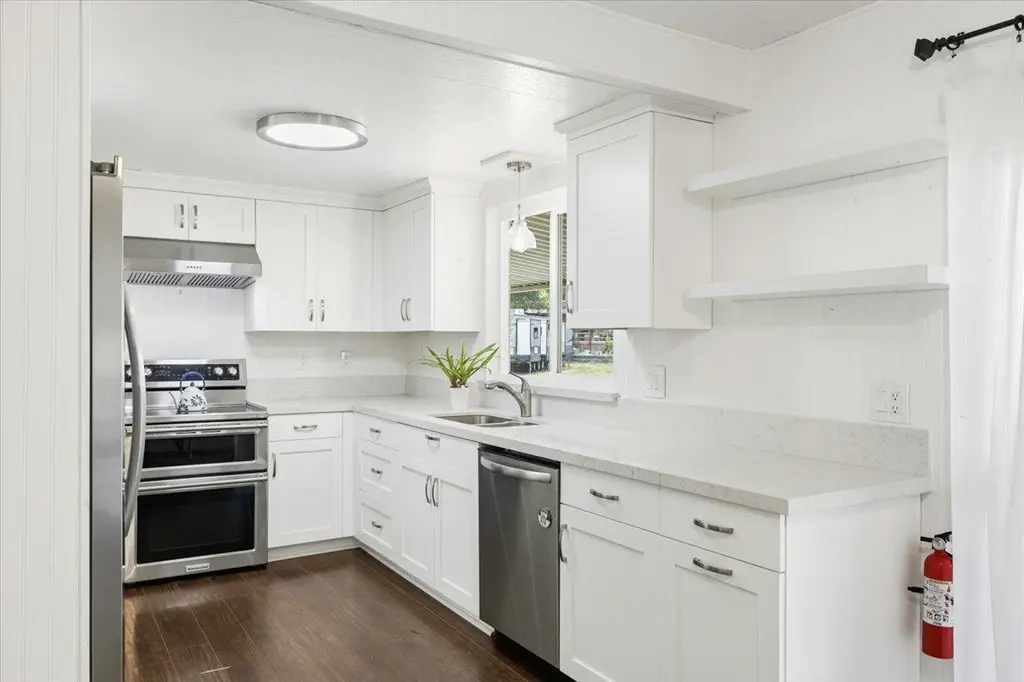
Beautifully updated double wide mobile home in a desirable El Dorado County park. This home features a spacious covered porch perfect for relaxing or entertaining, along with a bright, modern kitchen complete with updated cabinetry, countertops, and stainless steel appliances. Additional upgrades include central heat and air, dual-pane windows, a composition roof, and a Generac backup power system for added comfort and peace of mind. Clean, move-in ready interior with a functional layout and great natural light. A quality storage shed provides added convenience. An exceptional opportunity for affordable living with style and comfort. Buyer to verify park approval and financing options. Mobi
Key facts
- Covered porch
- Central heat and air
- Dual-pane windows
Tags
Property features AI
Finance
- Financial info: Land lease (yes) — monthly amount $1,020
- HOA & community: No homeowners association; Senior community
Exterior
- Parking: Attached parking; Carport
- Utilities: Public water; Public sewer; Propane available; Cable available; Internet available; Electric with 220V in kitchen and laundry; Generator
- Home design: Manufactured home in park (double wide); Updated/remodeled; Built in 1974; Skirted with aluminum; Manufacturer: Taylor List, Make: Signature
- Construction: Composition roof; Aluminum skirting
- Exterior features: Patio awning; Carport awning; Covered patio; Storage area / shed(s); Regular lot shape with landscaped front; Greenbelt
Interior
- Kitchen: Synthetic countertops; Hood over range; Ice maker; Dishwasher; Microwave; Free-standing electric oven and range
- Bedrooms: 2 bedrooms (possible 3rd bedroom); Master bedroom approx. 13 x 12; Second bedroom approx. 10 x 11
- Flooring: Carpet; Laminate; Linoleum
- Bathrooms: 2 full bathrooms; Tub with shower over
- Heating & cooling: Central heating; Propane heating; Central cooling; Ceiling fan(s)
- Interior features: Covered patio; Deck attached to living room; Dual-pane full windows; Patio awning and carport awning; Storage area / shed(s); Updated/remodeled interior
- Laundry & utility: Washer and dryer included; Laundry located inside (inside room); Electric dryer
Neighborhood map
What this means for you Summary
Snapshot
- This is a 2-bed/2.0-bath manufactured listed at $98k.
Deal economics
- At list price, monthly cash flow is $983 ($12k/yr) — positive.
- The deal already cash-flows at list — no discount required.
- Meets the 1% rule at list price ($2k rent vs $98k).
- Recommended offer: $92k (6.0% below list) — sets the bar for market timing.
- Cap rate 18.3% vs local median 2.8% in Placerville — top-decile yield for the area; either an underpriced asset or a hidden risk that comps aren't pricing in. Stress-test before assuming the spread holds.
Location & tenants
- Location reads 61/100 on livability (#553 in CA) — a middle-class / working-renter tenant base. Strengths: housing B+; Watch: schools D+, amenities D, crime F.
- Placerville Union Elementary (town): math 29% / reading 46% proficiency, ranked #248 of 517 in CA (top 48%) — families likely to look elsewhere, expect single-tenant / working-renter base with shorter leases.
- Market conditions: Rents rising fast (+12.5%/yr); 351 active listings in the ZIP; 1 comparable units currently listed for rent nearby; solid renter incomes; 437 units permitted in El Dorado County in 2024 (0 in 5+ unit buildings).
Forward outlook
- Local home prices are declining (-3.0%/yr); year-one equity from $678 of loan paydown is wiped out by about $3k of value loss. Plan a longer hold.
- El Dorado County population projected to shrink 3% by 2050 — rents likely to lag national; underwrite the cash flow, not the appreciation.
- At projected returns (-3.0% appreciation + 8.0% rent growth), your $27k cash investment doubles in ~3 years — after that, you're playing with house money.
Negotiation context
- It's been on market 65 days — a 6% lower offer ($92k) is reasonable based on typical stale-listing flexibility.
Risks & watch-outs
- Climate carrying-cost: severe wildfire risk; extreme-heat days projected 7→16/yr by 2055 (HVAC capex compounding) — expect insurance premiums to compound above CPI over the hold.
Questions for the listing agent
- It's been on market 65 days. Have you received any prior offers? Is the seller open to a 6% concession, seller financing, or rate buy-down credit?
- Built in 1974 — when were the roof, HVAC, electrical panel, plumbing, and water heater last replaced?
- Why hasn't it sold? Are there any deal-killer items the seller is aware of (foundation, flood, title, zoning, code violations)?
- Is there a deadline driving the sale (1031 exchange, divorce, estate, relocation)? That informs how much negotiation room exists.
- Schools are D-rated, which usually means shorter tenancies and higher turnover. Who's the typical renter profile here, and what's been the actual vacancy rate?
- Crime grade is F in this area — have there been break-ins, vandalism, or insurance claims at this property in the last 3 years? What carrier currently insures it and at what premium?
- What's the average days-on-market for RENTAL listings here right now (not sales)? A rising rental-DOM trend means longer vacancies and softer asking-rent achievability than the comps imply.
- What's the recent tenant-quality profile in this submarket — average credit score on applications, eviction rate, late-payment / NSF rate, and stable-employment percentage? A property-management company in the area should have these aggregated.
- How much new for-sale + rental construction is in the pipeline within 1–3 miles? Heavy new supply typically softens prices + rents 12–24 months out; constrained supply supports both.
Investment metrics
- 1% rule
- 2.14% ✓
- Cap rate
- 18.33%
- Cash-on-cash
- 42.98%
- DSCR
- 2.91
- GRM
- 3.9
CMA / ARV
- ARV (on-the-fly)
- $98,112
- Comps found
- 10
Show comp detail 10 sales within ~0.75 mi
| Address | Dist | Beds/Ba | Sqft | Sold | Price | $/sf | Match |
|---|---|---|---|---|---|---|---|
| 2874 Hidden Springs Cir | 0.14mi | 2/2.0 | 1,400 (+4%) | 1mo | $75,000 | $54 | 86 |
| 2820 Hidden Spgs | 0.15mi | 2/2.0 | 1,344 (0%) | 8mo | $102,000 | $76 | 86 |
| 2860 Hidden Springs Cir | 0.08mi | 2/2.0 | 1,344 (0%) | 19mo | $98,000 | $73 | 81 |
| 2768 Hidden Springs Cir | 0.16mi | 2/2.0 | 1,440 (+7%) | 1mo | $110,000 | $76 | 80 |
| 2854 Hidden Springs Cir | 0.05mi | 2/2.0 | 1,464 (+9%) | 8mo | $156,900 | $107 | 76 |
| 2794 Hidden Springs Cir #15a | 0.18mi | 2/2.0 | 1,440 (+7%) | 5mo | $80,000 | $56 | 76 |
| 2923 Glenwood Ln | 0.13mi | 2/2.0 | 1,440 (+7%) | 13mo | $89,000 | $62 | 71 |
| 2846 Hidden Springs Cir | 0.03mi | 2/2.0 | 1,152 (-14%) | 4mo | $70,000 | $61 | 71 |
| 2799 Hidden Springs Cir | 0.15mi | 2/2.0 | 1,440 (+7%) | 21mo | $105,000 | $73 | 64 |
| 2786 Hidden Springs Cir | 0.17mi | 2/2.0 | 1,152 (-14%) | 18mo | $43,875 | $38 | 53 |
Match score weights: distance 35% · size 25% · config 20% · recency 20%. Top-matched comps best support the ARV.
Projected returns pro-forma
-3.0% appreciation · 8.0% rent growth · sell at horizon
- IRR
- 45.4%
- Equity multiple
- 3.11×
- Total profit
- $57,859
- Equity at exit
- $14,612
- IRR
- 53.4%
- Equity multiple
- 7.62×
- Total profit
- $181,668
- Equity at exit
- $8,473
Cash invested: $27,440 (down + closing). Projections, not guarantees.
Landlord ↔ Tenant lean methodology
- Overall (STATE)
- 18 Strongly Tenant-Friendly
- State California
- 18 Strongly Tenant-Friendly · D+13
- County
- — inherits STATE
- City
- — inherits STATE
ZIP-level market 95667
- Rents YoY
- 12.5%
- Active inventory
- 351
- Price-to-rent
- 3.9×
Monthly cashflow live
- Estimated rent
- $2,101 medium interval (Pro) →
- Mortgage (P&I)
- −$514
- Tax est. 1.5%
- −$122 /mo · $1,470/yr
- Insurance
- −$41
- HOA
- −$0
- Vacancy / Maint / Mgmt
- −$441
- Net cashflow
- $983
Break-even live
UW: 25.0% down · 7.5% · 30yr · 1.5% tax · 5.0% vac · 8.0% maint · 8.0% mgmt
Financing live
Cash to close
- Down payment
- $24,500
- Closing costs
- $2,940
- Reserves months
- —
- Total cash needed
- —
Loan-product check · same deal, 3 products live
Conventional
25% down · 7.5% · 30yr
- Down + closing
- —
- Monthly P&I
- —
- Monthly cashflow
- —
- DSCR
- —
- Eligible?
- —
Personal DTI + credit; lowest rate.
DSCR
20% down · 8.5% · 30yr
- Down + closing
- —
- Monthly P&I
- —
- Monthly cashflow
- —
- DSCR
- —
- Eligible?
- —
No personal income docs; deal must DSCR.
Hard money
10% down · 12.0% · 12mo
- Down + closing
- —
- Monthly P&I
- —
- Monthly cashflow
- —
- DSCR
- —
- Eligible?
- —
Short-term bridge; refi at stabilization.
Rent comps 1 comps
| Address | Beds | Baths | Sqft | Rent | $/sqft | DOM | Units | Dist |
|---|---|---|---|---|---|---|---|---|
| 3010 Traci Ct Placerville, CA | 2.0 | 2.0 | 1195 | $2,475 | $2.07 | 12d | 1 | 1.11mi |
Listing history 14 events
-
2026-06-18days on market $98,000 Active 65 DOM
-
2026-06-17days on market $98,000 Active 64 DOM
-
2026-06-16days on market $98,000 Active 63 DOM
-
2026-06-15days on market $98,000 Active 62 DOM
-
2026-06-13days on market $98,000 Active 60 DOM
-
2026-06-09days on market $98,000 Active 56 DOM
-
2026-06-08days on market $98,000 Active 55 DOM
-
2026-06-08price $98,000 Active 54 DOM
-
2026-06-07days on market $105,000 Active 54 DOM
-
2026-06-05days on market $105,000 Active 51 DOM
-
2026-06-03days on market $105,000 Active 50 DOM
-
2026-06-02days on market $105,000 Active 49 DOM
-
2026-06-01days on market $105,000 Active 48 DOM
-
2026-05-31days on market $105,000 Active 47 DOM
ⓘ Source: listings_history table (triggers on properties + properties_extension) + one-shot
backfill from property_details.listing_events for pre-trigger history.
Climate risk First Street
- Flood 1/10 Low FEMA zone X (unshaded) · 0% chance over 30 yrs
- Wildfire 9/10 Extreme
- Heat 6/10 Major 7 d/yr ≥99°F today · 16 d/yr by 30 yrs out
- Wind 1/10 Low
- Air quality 10/10 Extreme 31 unhealthy d/yr today · 38 by 30 yrs out
Nearby sold comps map
Loading sold comps map…
Walkable amenities ~0.75 mi
Loading nearby amenities…
Taxation est. · year 1
- Rental income
- $25,218
- − Mortgage interest
- −$5,490
- − Property taxes
- −$1,470
- − Insurance
- −$490
- − Repairs & maintenance
- −$2,017
- − Management
- −$2,017
- − Depreciation
- −$2,851
- Taxable income
- $10,882
- Est. tax owed @ 24.0%
- −$2,612
- After-tax cash flow
- $9,183/yr
For passive investors: Depreciation is non-cash, so a rental often shows a tax loss while cash-flowing — sheltering income. Rental losses are passive: they offset passive income freely, and up to $25,000/yr can offset ordinary (W-2) income if you actively participate and your MAGI is under $100k (phasing out to $0 by $150k); unused losses carry forward. On sale, claimed depreciation is recaptured at up to 25%, and gains may owe capital-gains tax (a 1031 exchange can defer both). Figures are a year-1 estimate at your 24.0% rate — not tax advice; consult a CPA.
Schools (NCES district)
- District
- Placerville Union Elementary
- NCES district ID
- 0630780
- Math proficiency
- 29% ▼ -16.00%
- Reading proficiency
- 46% ▼ -11.00%
- Median HH income
- $54,662
- Composite
- 32.8/100
- National rank
- #5626
- State rank
- #248 of 517 in CA
Livability — Placerville
- Score
- 61/100
- State rank
- #553
- US rank
- #18366
Category grades
Schools grade is shown separately in the Schools card above.
Census & demographics
- Census place
- Placerville, CA
- County
- El Dorado County · 144,198 people
- City population
- 73,077
- Metro
- Sacramento-Roseville-Folsom, CA
- Population (ZIP)
- 36,830
- Household income
- $89,938
- Rent vs Own
- Severe rent burden
- 1147.0
Population outlook (El Dorado County) Hauer SSP2
- Today (2025)
- 191,666 people
- By 2030
- 193,662 · +1.0%
- By 2040
- 192,583 · +0.5%
- By 2050
- 185,904 · -3.0%
- By 2075
- 169,543 · -11.5%
- By 2100
- 139,623 · -27.2%
Race, ethnicity, and origin ACS 2023
- Neighborhood character
- Predominantly White (78%)
- Race & ethnicity
- White 78% Hispanic / Latino 14% Two or more races 8% Native American 1%
- Hispanic origin (detail)
- Mexican 11%
- Common ancestry
- Italian 4% Slovak 4% Lithuanian 3%
- Foreign-born
- 6% · Canada, China
- Languages at home
- 92% English-only · Spanish 6%
Political lean MEDSL · El Dorado
- 2024 margin
- R (+12.0) · D 42.6% · R 54.6% · Other 2.8%
- 2008→2024 swing
- -1.5pp toward R · 2008: -10.5pp · 2024: -12.0pp
- All cycles
- 2024: R+12.0 2020: R+8.8 2016: R+13.9 2012: R+18.2 2008: R+10.5
Not yet ingested
- Civics
- —
Market trends
- HPI YoY
- ▼ -480.50%
- Current HPI
- 262.6014
- Rent YoY
- ▲ 12.48%
- Metro
- Sacramento-Roseville-Folsom, CA
- State GDP YoY
- ▲ 3.21%
- F500 in state
- 116
Industry mix (Fortune 500 HQ in CA)
| Industry | F500 HQs | Revenue |
|---|---|---|
| Technology | 27 | $1,492B |
|
||
| Financial Services | 3 | $174B |
|
||
| Retail | 3 | $44B |
|
||
| Insurance | 3 | $26B |
|
||
| Media / Entertainment | 2 | $115B |
|
||
| Pharmaceuticals / Biotech | 2 | $62B |
|
||
Cash-flow waterfall
monthlySold comps — $/sqft
last 12 mo · ≤1 miLoading sold comps…