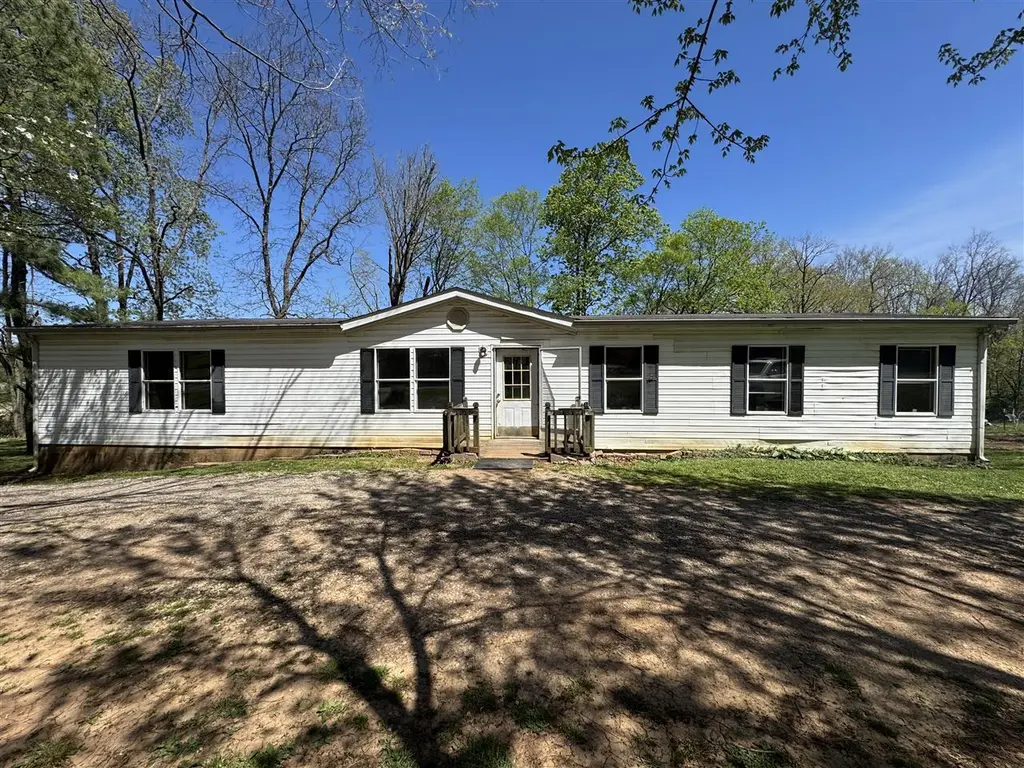
286 Coonhunters Rd · Bowling Green, KY
Flood risk 1/10 · Minimal
- FEMA flood zone
- X (unshaded)
- Chance of flooding over 30 yrs
- 0.0%
- Est. flood insurance / yr
- $507 – $1,088
Fire risk 4/10 · Minor
- Est. fire insurance / yr
- $839 – $1,559
Heat risk 5/10 · Moderate
- Hot days now (above 108°F)
- 7 days/yr
- Hot days in 30 yrs
- 19 days/yr
Wind risk 3/10 · Minor
- Chance of severe wind over 30 yrs
- 7.0%
Air-quality risk 1/10 · Minimal
- Unhealthy air days now
- 0 days/yr
- Unhealthy air days in 30 yrs
- 0 days/yr
Risk factors via First Street. Map © Google.
Why this score? — see what drove the C grade
The composite is a weighted blend of 9 inputs, each scored 0–100. Each bar is that input's sub-score; the figure is the points it added to the 100-point composite (weight × sub-score).
- Cash flow +25.5/30.0
- DSCR +8.4/10.0
- ARV discount +7.5/15.0
- 1% rule +6.7/10.0
- Schools +3.2/10.0
- Livability +3.2/5.0
- Condition / age +2.8/5.0
- Rent growth +2.6/5.0
- Appreciation +0.0/10.0
$129,900
🖨 Deal sheet 📄 Offer letter ✓ Due diligence
Listing remarks MLS
Spacious 3-bedroom, 2-bath manufactured home on a permanent foundation offering approximately 1,700 sq ft of living space on nearly half an acre. This home features an open-concept layout with generous living areas and a large back deck—perfect for relaxing or entertaining. With great bones and just minor updates needed, this property presents an excellent opportunity for investors or buyers looking to add their personal touch. Enjoy the space, potential, and value this property has to offer!
Key facts
- 0.46 acre lot
- Built 1998
- Listed 72 days
Neighborhood map
What this means for you Summary
Snapshot
- This is a 3-bed/2.0-bath single-family listed at $130k. Condition is rated average.
Deal economics
- At list price, monthly cash flow is $302 ($4k/yr) — positive.
- The deal already cash-flows at list — no discount required.
- Meets the 1% rule at list price ($2k rent vs $130k).
- Recommended offer: $122k (6.0% below list) — sets the bar for market timing.
- Cap rate 9.1% vs local median 3.2% in Bowling Green — top-decile yield for the area; either an underpriced asset or a hidden risk that comps aren't pricing in. Stress-test before assuming the spread holds.
Location & tenants
- Location reads 65/100 on livability (#255 in KY) — a middle-class / working-renter tenant base. Strengths: cost of living A+, housing A+; Watch: crime C-, schools D+, amenities F.
- Warren County (rural): math 30% / reading 43% proficiency, ranked #48 of 165 in KY (top 29%) — families likely to look elsewhere, expect single-tenant / working-renter base with shorter leases.
- Market conditions: Rents flat; 591 active listings in the ZIP; 2 comparable units currently listed for rent nearby; 2,286 units permitted in Warren County in 2024 (1,410 in 5+ unit buildings).
- This rent runs 38% of the median local income ($48k/yr) — at the standard rent-burdened threshold; future hikes will face affordability resistance.
Forward outlook
- Local home prices are declining (-3.0%/yr); year-one equity from $898 of loan paydown is wiped out by about $4k of value loss. Plan a longer hold.
- Warren County population projected at +41% by 2050 — long-run rental-demand tailwind backs the buy-and-hold thesis.
Negotiation context
- It's been on market 73 days — a 6% lower offer ($122k) is reasonable based on typical stale-listing flexibility.
Risks & watch-outs
- Climate carrying-cost: extreme-heat days projected 7→19/yr by 2055 (HVAC capex compounding) — expect insurance premiums to compound above CPI over the hold.
Questions for the listing agent
- It's been on market 73 days. Have you received any prior offers? Is the seller open to a 6% concession, seller financing, or rate buy-down credit?
- Why hasn't it sold? Are there any deal-killer items the seller is aware of (foundation, flood, title, zoning, code violations)?
- Is there a deadline driving the sale (1031 exchange, divorce, estate, relocation)? That informs how much negotiation room exists.
- Schools are D-rated, which usually means shorter tenancies and higher turnover. Who's the typical renter profile here, and what's been the actual vacancy rate?
- What's the average days-on-market for RENTAL listings here right now (not sales)? A rising rental-DOM trend means longer vacancies and softer asking-rent achievability than the comps imply.
- What's the recent tenant-quality profile in this submarket — average credit score on applications, eviction rate, late-payment / NSF rate, and stable-employment percentage? A property-management company in the area should have these aggregated.
- How much new for-sale + rental construction is in the pipeline within 1–3 miles? Heavy new supply typically softens prices + rents 12–24 months out; constrained supply supports both.
Investment metrics
- 1% rule
- 1.17% ✓
- Cap rate
- 9.08%
- Cash-on-cash
- 9.96%
- DSCR
- 1.44
- GRM
- 7.1
CMA / ARV
- ARV (median comp)
- $298,129
- List price
- $129,900
- Delta
- -56.43%
- Verdict
- UNDERPRICED
- Comps
- 20 within 1.0 mi
Show comp detail 12 sales within ~0.75 mi
| Address | Dist | Beds/Ba | Sqft | Sold | Price | $/sf | Match |
|---|---|---|---|---|---|---|---|
| 7106 Stone Meade Ln | 0.30mi | 3/2.0 | 1,798 (+2%) | 3mo | $280,000 | $156 | 80 |
| 7060 Stone Meade Ct | 0.35mi | 3/2.5 | 1,764 (+0%) | 1mo | $249,900 | $142 | 80 |
| 7046 Stone Meade Ct | 0.37mi | 4/2.5 (+1) | 1,685 (-4%) | 6mo | $279,900 | $166 | 64 |
| 7195 Weatherstone Blvd | 0.50mi | 3/2.5 | 1,764 (+0%) | 12mo | $285,000 | $162 | 64 |
| 285 Stone Crest Ave | 0.70mi | 3/2.0 | 1,698 (-3%) | 1mo | $319,000 | $188 | 61 |
| 363 Hillwood Dr | 0.46mi | 3/2.0 | 1,800 (+2%) | 17mo | $295,000 | $164 | 60 |
| 7148 Weatherstone Blvd | 0.38mi | 4/2.0 (+1) | 1,792 (+2%) | 20mo | $301,000 | $168 | 58 |
| 7211 Weatherstone Blvd | 0.54mi | 3/2.5 | 1,704 (-3%) | 18mo | $285,000 | $167 | 53 |
| 744 Browning Rd | 0.58mi | 3/2.0 | 1,580 (-10%) | 10mo | $350,000 | $222 | 48 |
| 7202 Centerstone Dr | 0.48mi | 3/2.0 | 1,520 (-13%) | 9mo | $274,000 | $180 | 48 |
| 7174 Seagraves Ct | 0.38mi | 3/2.0 | 1,522 (-13%) | 17mo | $236,000 | $155 | 46 |
| 7202 Eagle Stone Ln | 0.60mi | 3/2.0 | 1,544 (-12%) | 18mo | $255,000 | $165 | 37 |
Match score weights: distance 35% · size 25% · config 20% · recency 20%. Top-matched comps best support the ARV.
Projected returns pro-forma
-3.0% appreciation · 0.28% rent growth · sell at horizon
- IRR
- -4.4%
- Equity multiple
- 0.84×
- Total profit
- $-5,849
- Equity at exit
- $19,369
- IRR
- 1.8%
- Equity multiple
- 1.11×
- Total profit
- $4,032
- Equity at exit
- $11,231
Cash invested: $36,372 (down + closing). Projections, not guarantees.
Landlord ↔ Tenant lean methodology
- Overall (STATE)
- 83 Strongly Landlord-Friendly
- State Kentucky
- 83 Strongly Landlord-Friendly · R+16
- County
- — inherits STATE
- City
- — inherits STATE
ZIP-level market 42101
- Home prices YoY
- -20.9%
- Rents YoY
- 0.3%
- Active inventory
- 591
- Price-to-rent
- 7.1×
Monthly cashflow live
- Estimated rent
- $1,518 medium interval (Pro) →
- Mortgage (P&I)
- −$681
- Tax est. 1.5%
- −$162 /mo · $1,948/yr
- Insurance
- −$54
- HOA
- −$0
- Vacancy / Maint / Mgmt
- −$319
- Net cashflow
- $302
Break-even live
UW: 25.0% down · 7.5% · 30yr · 1.5% tax · 5.0% vac · 8.0% maint · 8.0% mgmt
Financing live
Cash to close
- Down payment
- $32,475
- Closing costs
- $3,897
- Reserves months
- —
- Total cash needed
- —
Loan-product check · same deal, 3 products live
Conventional
25% down · 7.5% · 30yr
- Down + closing
- —
- Monthly P&I
- —
- Monthly cashflow
- —
- DSCR
- —
- Eligible?
- —
Personal DTI + credit; lowest rate.
DSCR
20% down · 8.5% · 30yr
- Down + closing
- —
- Monthly P&I
- —
- Monthly cashflow
- —
- DSCR
- —
- Eligible?
- —
No personal income docs; deal must DSCR.
Hard money
10% down · 12.0% · 12mo
- Down + closing
- —
- Monthly P&I
- —
- Monthly cashflow
- —
- DSCR
- —
- Eligible?
- —
Short-term bridge; refi at stabilization.
Rent comps 2 comps
| Address | Beds | Baths | Sqft | Rent | $/sqft | DOM | Units | Dist |
|---|---|---|---|---|---|---|---|---|
| 7437 Russellville Rd Apt 814 Bowling Green, KY | 2.0 | 2.5 | 1390 | $1,395 | $1.00 | 43d | 1 | 0.34mi |
| 360 Cedar Hollow Dr Bowling Green, KY | 3.0 | 1.0 | 1349 | $1,600 | $1.19 | 43d | 1 | 1.42mi |
Listing history 19 events
-
2026-06-19days on market $129,900 Active 73 DOM
-
2026-06-18days on market $129,900 Active 72 DOM
-
2026-06-17price $129,900 Active 71 DOM
-
2026-06-17days on market $139,500 Active 71 DOM
-
2026-06-16days on market $139,500 Active 70 DOM
-
2026-06-15days on market $139,500 Active 69 DOM
-
2026-06-14days on market $139,500 Active 67 DOM
-
2026-06-13days on market $139,500 Active 66 DOM
-
2026-06-10days on market $139,500 Active 64 DOM
-
2026-06-09days on market $139,500 Active 63 DOM
-
2026-06-08days on market $139,500 Active 62 DOM
-
2026-06-07days on market $139,500 Active 61 DOM
-
2026-06-05days on market $139,500 Active 58 DOM
-
2026-06-02days on market $139,500 Active 56 DOM
-
2026-06-01days on market $139,500 Active 55 DOM
-
2026-05-31days on market $139,500 Active 54 DOM
-
2026-05-30days on market $139,500 Active 53 DOM
-
2026-05-06price $139,500 503-char remark
Show marketing remark (503 chars)
Spacious 3-bedroom, 2-bath manufactured home on a permanent foundation offering approximately 1,700 sq ft of living space on nearly half an acre. This home features an open-concept layout with generous living areas and a large back deck—perfect for relaxing or entertaining. With great bones and just minor updates needed, this property presents an excellent opportunity for investors or buyers looking to add their personal touch. Enjoy the space, potential, and value this property has to offer!
-
2026-04-07$149,500 Active 503-char remark
Show marketing remark (503 chars)
Spacious 3-bedroom, 2-bath manufactured home on a permanent foundation offering approximately 1,700 sq ft of living space on nearly half an acre. This home features an open-concept layout with generous living areas and a large back deck—perfect for relaxing or entertaining. With great bones and just minor updates needed, this property presents an excellent opportunity for investors or buyers looking to add their personal touch. Enjoy the space, potential, and value this property has to offer!
ⓘ Source: listings_history table (triggers on properties + properties_extension) + one-shot
backfill from property_details.listing_events for pre-trigger history.
Climate risk First Street
- Flood 1/10 Low FEMA zone X (unshaded) · 0% chance over 30 yrs
- Wildfire 4/10 Moderate
- Heat 5/10 Major 7 d/yr ≥108°F today · 19 d/yr by 30 yrs out
- Wind 3/10 Moderate 7% chance of damaging wind over 30 yrs
- Air quality 1/10 Low 0 unhealthy d/yr today · 0 by 30 yrs out
Nearby sold comps map
Loading sold comps map…
Walkable amenities ~0.75 mi
Loading nearby amenities…
Taxation est. · year 1
- Rental income
- $18,221
- − Mortgage interest
- −$7,276
- − Property taxes
- −$1,948
- − Insurance
- −$650
- − Repairs & maintenance
- −$1,458
- − Management
- −$1,458
- − Depreciation
- −$3,779
- Taxable income
- $1,652
- Est. tax owed @ 24.0%
- −$397
- After-tax cash flow
- $3,225/yr
For passive investors: Depreciation is non-cash, so a rental often shows a tax loss while cash-flowing — sheltering income. Rental losses are passive: they offset passive income freely, and up to $25,000/yr can offset ordinary (W-2) income if you actively participate and your MAGI is under $100k (phasing out to $0 by $150k); unused losses carry forward. On sale, claimed depreciation is recaptured at up to 25%, and gains may owe capital-gains tax (a 1031 exchange can defer both). Figures are a year-1 estimate at your 24.0% rate — not tax advice; consult a CPA.
Condition & rehab AI · 12 photos
This home has average condition with minor repairs and maintenance needed. Painting and landscaping can significantly increase its value.
Repairs flagged
- Minor kitchen cabinets — existing cabinets need touch-up paint
- Minor bathroom fixtures — existing fixtures need cleaning
- Minor exterior siding — existing siding needs touch-up paint
- Minor interior walls — existing paint needs touch-up
- Minor HVAC units — existing units need cleaning
Value-add opportunities
- Both painting — painting can improve the home's appearance and value
- Both landscaping — landscaping can enhance curb appeal and property value
Renovation cost estimate screening
| Repair item | Severity | Est. cost |
|---|---|---|
| kitchen cabinets · existing cabinets need touch-up paint | Minor | $500–3,000 |
| bathroom fixtures · existing fixtures need cleaning | Minor | $500–3,000 |
| exterior siding · existing siding needs touch-up paint | Minor | $500–3,000 |
| interior walls · existing paint needs touch-up | Minor | $500–3,000 |
| HVAC units · existing units need cleaning | Minor | $500–3,000 |
| Total estimated repair cost · 5 items | $2,500–15,000 |
Value-add ROI direction
- Both painting — painting can improve the home's appearance and value ↑
- Both landscaping — landscaping can enhance curb appeal and property value ↑
ⓘ Cost ranges are severity-bucket heuristics (US national rule-of-thumb). Get contractor quotes + a written scope before underwriting a rehab budget.
Schools (NCES district)
- District
- Warren County
- NCES district ID
- 2105730
- Math proficiency
- 30% ▼ -18.00%
- Reading proficiency
- 43% ▼ -16.00%
- Median HH income
- $50,092
- Composite
- 31.55/100
- National rank
- #5958
- State rank
- #48 of 165 in KY
Livability — Bowling Green
- Score
- 65/100
- State rank
- #255
- US rank
- #12782
Category grades
Schools grade is shown separately in the Schools card above.
Census & demographics
- County
- Warren County · 129,408 people
- City population
- 129,408
- Metro
- Bowling Green, KY
- Population (ZIP)
- 65,421
- Household income
- $48,217
- Rent vs Own
- Severe rent burden
- 3855.0
Population outlook (Warren County) Hauer SSP2
- Today (2025)
- 144,620 people
- By 2030
- 155,977 · +7.9%
- By 2040
- 179,381 · +24.0%
- By 2050
- 203,713 · +40.9%
- By 2075
- 267,291 · +84.8%
- By 2100
- 314,019 · +117.1%
Race, ethnicity, and origin ACS 2023
- Neighborhood character
- Predominantly White (68%)
- Race & ethnicity
- White 68% Black 13% Hispanic / Latino 10% Two or more races 7% Asian 3%
- Hispanic origin (detail)
- Mexican 6%
- Common ancestry
- Slovak 2% American 1% Italian 1%
- Foreign-born
- 10% · Canada, Philippines
- Languages at home
- 84% English-only · Spanish 8% Other Asian/Pacific 2% Russian/Polish/Slavic 2%
Political lean MEDSL · Warren
- 2024 margin
- Strong R (+24.3) · D 37.0% · R 61.3% · Other 1.6%
- 2008→2024 swing
- -5.4pp toward R · 2008: -18.9pp · 2024: -24.3pp
- All cycles
- 2024: R+24.3 2020: R+16.8 2016: R+24.2 2012: R+21.8 2008: R+18.9
Not yet ingested
- Civics
- —
Market trends
- HPI YoY
- ▼ -73.34%
- Current HPI
- 277.6554
- Rent YoY
- ▲ 0.28%
- Metro
- Bowling Green, KY
- State GDP YoY
- ▲ 1.81%
- F500 in state
- 4
Industry mix (Fortune 500 HQ in KY)
| Industry | F500 HQs | Revenue |
|---|---|---|
| Healthcare | 1 | $118B |
|
||
| Food / Beverage | 1 | $7B |
|
||
Price history
-6.7% since first listed2 events — show timeline
- 2026-05-06 Price Changed $139,500 RASKMLS
- 2026-04-07 Listed $149,500 RASKMLS
Cash-flow waterfall
monthlySold comps — $/sqft
last 12 mo · ≤1 miLoading sold comps…