 6-Plex
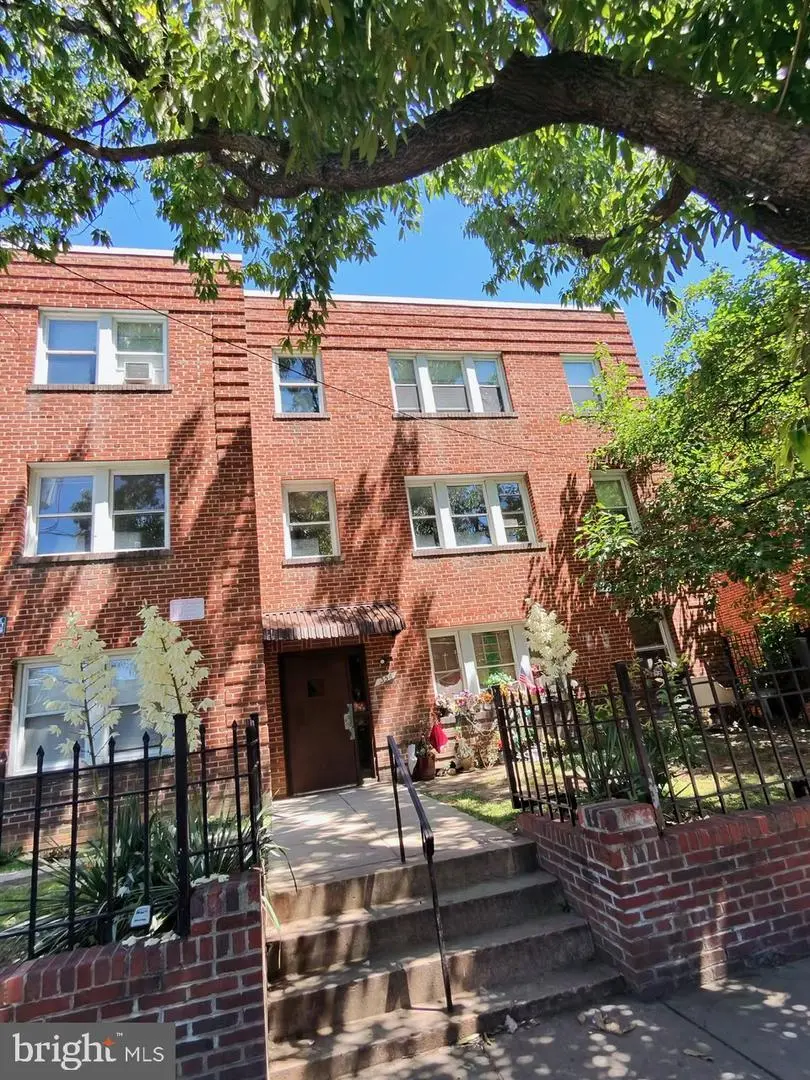
356 Raleigh St SE · Washington, DC
Flood risk 1/10 · Minimal
- FEMA flood zone
- X (unshaded)
- Chance of flooding over 30 yrs
- 0.0%
- Est. flood insurance / yr
- $473 – $860
Fire risk 1/10 · Minimal
- Est. fire insurance / yr
- $631 – $1,173
Heat risk 7/10 · Major
- Hot days now (above 104°F)
- 7 days/yr
- Hot days in 30 yrs
- 15 days/yr
Wind risk 4/10 · Minor
- Chance of severe wind over 30 yrs
- 20.0%
Air-quality risk 3/10 · Minor
- Unhealthy air days now
- 2 days/yr
- Unhealthy air days in 30 yrs
- 3 days/yr
Risk factors via First Street. Map © Google.
Why this score? — see what drove the C+ grade
The composite is a weighted blend of 9 inputs, each scored 0–100. Each bar is that input's sub-score; the figure is the points it added to the 100-point composite (weight × sub-score).
- Cash flow +27.7/30.0
- DSCR +9.7/10.0
- ARV discount +7.5/15.0
- 1% rule +6.5/10.0
- Livability +3.7/5.0
- Schools +3.6/10.0
- Rent growth +3.5/5.0
- Condition / age +2.5/5.0
- Appreciation +0.0/10.0
$847,900
🖨 Deal sheet 📄 Offer letter ✓ Due diligence
Multi-family units
County records classify this as Multi-Family (5+ Unit). Listing-text estimate: 6 units. confirmed
5+ unit building — per-unit beds/baths from public records are typically unavailable; the breakdown below (if shown) is an estimate from the listing text.
Listing remarks MLS
An all brick building fully occupied. Just off MLK, JR. Ave & Malcom X (formerly Portland Street)
Key facts
- 4,602 sq ft lot
- Built 1942
- Listed 16 days
Property features AI
Finance
- Financial info: Property is owner-held fee simple; Existing leases are month-to-month; Total actual rent reported as $700; Ground rent paid annually
Exterior
- Parking: On-street parking
- Utilities: Public water; Public sewer; Natural gas hot water
- Home design: Brick construction
- Construction: Brick exterior; Wood frame windows; Unknown roof type; Basement with connecting stairway, side entrance and outside entrance; Above-grade structures present
- Exterior features: Sidewalks; Shed
Interior
- Bedrooms: Total units include three 1-bedroom units and three 2-bedroom units; Unit list: Unit 1, Unit 2, Unit 3, Unit 4, Unit 5, Unit 6
- Flooring: Wood floors
- Heating & cooling: Hot water heating; Natural gas heat
- Interior features: Window treatments; Wood floors; Drywall walls and ceilings
Neighborhood map
What this means for you Summary
Snapshot
- This is a 3×1bd/1ba + 3×2bd/1ba units multifamily listed at $848k.
Deal economics
- At list price, monthly cash flow is $3k ($31k/yr) — positive. Per door: $426/mo.
- The deal already cash-flows at list — no discount required.
- Meets the 1% rule at list price ($10k rent vs $848k).
- Recommended offer: $835k (1.5% below list) — sets the bar for market timing.
- Cap rate 9.9% vs local median 2.5% in Washington — top-decile yield for the area; either an underpriced asset or a hidden risk that comps aren't pricing in. Stress-test before assuming the spread holds.
Location & tenants
- Location reads 73/100 on livability (#1 in DC) — a middle-class / working-renter tenant base. Strengths: amenities A+, commute A+, employment A+; Watch: crime F, cost of living F.
- District Of Columbia Public Schools (urban): math 33% / reading 40% proficiency, ranked #8 of 32 in DC (top 25%) — families likely to look elsewhere, expect single-tenant / working-renter base with shorter leases; 65% free/reduced lunch — lower-income household profile, screen leases tightly.
- Market conditions: Rents rising (+4.0%/yr); 145 active listings in the ZIP; 1,737 units permitted in District of Columbia in 2024 (1,506 in 5+ unit buildings).
- At $9,752/mo this rent would consume 238% of the median local household income ($49k/yr) (locally 4530% of renters already pay >50% of income on rent) — very limited rent-growth headroom before tenants either downsize or default.
Forward outlook
- Local home prices are declining (-3.0%/yr); year-one equity from $6k of loan paydown is wiped out by about $25k of value loss. Plan a longer hold.
- District of Columbia County population projected at +50% by 2050 — long-run rental-demand tailwind backs the buy-and-hold thesis.
- At projected returns (-3.0% appreciation + 4.0% rent growth), your $237k cash investment doubles in ~9 years — after that, you're playing with house money.
Negotiation context
- It's been on market 17 days — a 2% lower offer ($835k) is reasonable based on typical stale-listing flexibility.
- Current owner paid $420k; list at $848k implies a 102% gain — meaningful room to come down on a strong offer.
Risks & watch-outs
- Watch-outs: built in 1942 — expect roof / HVAC / electrical / plumbing capex.
- Climate carrying-cost: extreme-heat days projected 7→15/yr by 2055 (HVAC capex compounding) — expect insurance premiums to compound above CPI over the hold.
Questions for the listing agent
- Can we see the unit-by-unit rent roll, current vacancy, and any below-market leases? What's the average tenancy length?
- What capital expenditures (roof, boiler, parking lot, exteriors) have been made in the last 5 years, and what's planned in the next 2?
- Built in 1942 — when were the roof, HVAC, electrical panel, plumbing, and water heater last replaced?
- Is there a deadline driving the sale (1031 exchange, divorce, estate, relocation)? That informs how much negotiation room exists.
- Crime grade is F in this area — have there been break-ins, vandalism, or insurance claims at this property in the last 3 years? What carrier currently insures it and at what premium?
- What's the average days-on-market for RENTAL listings here right now (not sales)? A rising rental-DOM trend means longer vacancies and softer asking-rent achievability than the comps imply.
- What's the recent tenant-quality profile in this submarket — average credit score on applications, eviction rate, late-payment / NSF rate, and stable-employment percentage? A property-management company in the area should have these aggregated.
- How much new apartment / multifamily construction is in the pipeline within 1–3 miles? Heavy new supply (>2% of stock underway) typically softens rents 12–24 months out; light construction supports rent growth.
Investment metrics
- 1% rule
- 1.15% ✓
- Cap rate
- 9.91%
- Cash-on-cash
- 12.92%
- DSCR
- 1.57
- GRM
- 7.2
CMA / ARV
No comps found within radius.
Projected returns pro-forma
-3.0% appreciation · 3.96% rent growth · sell at horizon
- IRR
- 3.7%
- Equity multiple
- 1.15×
- Total profit
- $34,626
- Equity at exit
- $126,425
- IRR
- 14.0%
- Equity multiple
- 2.17×
- Total profit
- $278,398
- Equity at exit
- $73,311
Cash invested: $237,412 (down + closing). Projections, not guarantees.
Landlord ↔ Tenant lean methodology
- Overall (CITY)
- 0 Strongly Tenant-Friendly
- State District of Columbia
- 12 Strongly Tenant-Friendly · D+43
- County
- — inherits STATE
- City Washington
- 0 Strongly Tenant-Friendly · D+43
ZIP-level market 20032
- Home prices YoY
- -15.6%
- Rents YoY
- 4.0%
- Active inventory
- 145
- Price-to-rent
- 46.6×
Monthly cashflow live
- Estimated rent
- $9,752 high interval (Pro) →
- Mortgage (P&I)
- −$4,446
- Tax from tax record
- −$348 /mo · $4,178/yr
- Insurance
- −$353
- HOA
- −$0
- Vacancy / Maint / Mgmt
- −$2,048
- Net cashflow
- $2,556
Break-even live
6-unit breakdown (identical units grouped — click to expand)
| Units | Beds | Baths | Est. rent |
|---|---|---|---|
| 3× units | 1 | 1 | $4,545 |
| #1 | 1 | 1 | $1,515 |
| #2 | 1 | 1 | $1,515 |
| #3 | 1 | 1 | $1,515 |
| 3× units | 2 | 1 | $5,205 |
| #4 | 2 | 1 | $1,735 |
| #5 | 2 | 1 | $1,735 |
| #6 | 2 | 1 | $1,735 |
| Total (6 units) | $9,752 | ||
UW: 25.0% down · 7.5% · 30yr · 1.5% tax · 5.0% vac · 8.0% maint · 8.0% mgmt
Financing live
Cash to close
- Down payment
- $211,975
- Closing costs
- $25,437
- Reserves months
- —
- Total cash needed
- —
Loan-product check · same deal, 3 products live
Conventional
25% down · 7.5% · 30yr
- Down + closing
- —
- Monthly P&I
- —
- Monthly cashflow
- —
- DSCR
- —
- Eligible?
- —
Personal DTI + credit; lowest rate.
DSCR
20% down · 8.5% · 30yr
- Down + closing
- —
- Monthly P&I
- —
- Monthly cashflow
- —
- DSCR
- —
- Eligible?
- —
No personal income docs; deal must DSCR.
Hard money
10% down · 12.0% · 12mo
- Down + closing
- —
- Monthly P&I
- —
- Monthly cashflow
- —
- DSCR
- —
- Eligible?
- —
Short-term bridge; refi at stabilization.
Listing history 13 events
-
2026-06-18days on market $847,900 Active 17 DOM
-
2026-06-17days on market $847,900 Active 16 DOM
-
2026-06-16days on market $847,900 Active 15 DOM
-
2026-06-15days on market $847,900 Active 14 DOM
-
2026-06-13days on market $847,900 Active 12 DOM
-
2026-06-09days on market $847,900 Active 8 DOM
-
2026-06-08days on market $847,900 Active 7 DOM
-
2026-06-07days on market $847,900 Active 6 DOM
-
2026-06-04days on market $847,900 Active 3 DOM
-
2026-06-03days on market $847,900 Active 2 DOM
-
2026-06-02status $847,900 Active 1 DOM
-
2026-05-31remarks 699-char remark
-
2026-05-31$847,900 Coming Soon 1 DOM
ⓘ Source: listings_history table (triggers on properties + properties_extension) + one-shot
backfill from property_details.listing_events for pre-trigger history.
Tax reassessment forecast DC · Partial reset (capped growth)
- Current annual tax
- $4,178 · $348/mo
- Projected year-2 tax
- $4,675 · $390/mo
- Expected delta
- +$497/yr (+$41/mo · 11.9%)
ⓘ Screening estimate from a state-policy table — verify with the county assessor before closing.
Climate risk First Street
- Flood 1/10 Low FEMA zone X (unshaded) · 0% chance over 30 yrs
- Wildfire 1/10 Low
- Heat 7/10 Severe 7 d/yr ≥104°F today · 15 d/yr by 30 yrs out
- Wind 4/10 Moderate 20% chance of damaging wind over 30 yrs
- Air quality 3/10 Moderate 2 unhealthy d/yr today · 3 by 30 yrs out
Nearby sold comps map
Loading sold comps map…
Walkable amenities ~0.75 mi
Loading nearby amenities…
Taxation est. · year 1
- Rental income
- $117,024
- − Mortgage interest
- −$47,496
- − Property taxes
- −$4,178
- − Insurance
- −$4,240
- − Repairs & maintenance
- −$9,362
- − Management
- −$9,362
- − Depreciation
- −$24,666
- Taxable income
- $17,721
- Est. tax owed @ 24.0%
- −$4,253
- After-tax cash flow
- $26,421/yr
For passive investors: Depreciation is non-cash, so a rental often shows a tax loss while cash-flowing — sheltering income. Rental losses are passive: they offset passive income freely, and up to $25,000/yr can offset ordinary (W-2) income if you actively participate and your MAGI is under $100k (phasing out to $0 by $150k); unused losses carry forward. On sale, claimed depreciation is recaptured at up to 25%, and gains may owe capital-gains tax (a 1031 exchange can defer both). Figures are a year-1 estimate at your 24.0% rate — not tax advice; consult a CPA.
Schools (NCES district)
- District
- District Of Columbia Public Schools
- NCES district ID
- 1100030
- Math proficiency
- 33% ▲ 3.00%
- Reading proficiency
- 40% ▲ 5.00%
- Median HH income
- $67,671
- Composite
- 35.84/100
- National rank
- #9606
- State rank
- #8 of 32 in DC
Livability — Washington
- Score
- 73/100
- State rank
- #1
- US rank
- #5327
Category grades
Schools grade is shown separately in the Schools card above.
Census & demographics
- Census place
- Washington, DC
- County
- District of Columbia · 671,873 people
- City population
- 671,873
- Metro
- Washington-Arlington-Alexandria, DC-VA-MD-WV
- Population (ZIP)
- 40,920
- Household income
- $49,139
- Rent vs Own
- Severe rent burden
- 4530.0
Population outlook (District of Columbia County) Hauer SSP2
- Today (2025)
- 821,926 people
- By 2030
- 899,517 · +9.4%
- By 2040
- 1,061,162 · +29.1%
- By 2050
- 1,231,493 · +49.8%
- By 2075
- 1,603,312 · +95.1%
- By 2100
- 1,847,141 · +124.7%
Race, ethnicity, and origin ACS 2023
- Neighborhood character
- Predominantly Black (80%)
- Race & ethnicity
- Black 80% White 8% Two or more races 7% Hispanic / Latino 5%
- Foreign-born
- 4% · Canada
- Languages at home
- 95% English-only · Spanish 3%
Political lean MEDSL · District of Columbia
- 2024 margin
- Solid D (+86.1) · D 91.2% · R 5.1% · Other 3.8%
- 2008→2024 swing
- +0.1pp no change · 2008: 85.9pp · 2024: 86.1pp
- All cycles
- 2024: D+86.1 2020: D+86.8 2016: D+88.7 2012: D+84.2 2008: D+85.9
Not yet ingested
- Civics
- —
Market trends
- HPI YoY
- ▼ -60.34%
- Current HPI
- 326.4077
- Rent YoY
- ▲ 3.96%
- Metro
- Washington-Arlington-Alexandria, DC-VA-MD-WV
- State GDP YoY
- ▲ 1.33%
- F500 in state
- 6
Industry mix (Fortune 500 HQ in DC)
| Industry | F500 HQs | Revenue |
|---|---|---|
| Financial Services | 1 | $153B |
|
||
| Life Sciences / Industrials | 1 | $25B |
|
||
| Industrial Machinery | 1 | $8B |
|
||
Price history
+88.4% since first listed5 events — show timeline
- 2026-05-31 Coming Soon $847,900 BRIGHT MLS
- 2007-03-06 Sold (Public Records) $419,999 Public Records
- 2007-02-22 Sold (MLS) $420,000 MRIS
- 2007-01-26 Delisted — MRIS
- 2006-11-08 Listed $450,000 MRIS
Property tax history
+1.8%/yrLatest (2025): $4,178 · -8.0% YoY. Source: county tax records.
Cash-flow waterfall
monthlySold comps — $/sqft
last 12 mo · ≤1 miLoading sold comps…