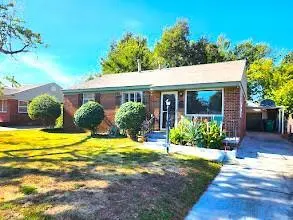
1715 N Utah Ave · Oklahoma City, OK
Flood risk 1/10 · Minimal
- FEMA flood zone
- X (unshaded)
- Chance of flooding over 30 yrs
- 0.0%
- Est. flood insurance / yr
- $507 – $1,088
Fire risk 1/10 · Minimal
- Est. fire insurance / yr
- $2,463 – $4,575
Heat risk 6/10 · Moderate
- Hot days now (above 107°F)
- 7 days/yr
- Hot days in 30 yrs
- 19 days/yr
Wind risk 2/10 · Minimal
- Chance of severe wind over 30 yrs
- 3.0%
Air-quality risk 2/10 · Minimal
- Unhealthy air days now
- 1 days/yr
- Unhealthy air days in 30 yrs
- 2 days/yr
Risk factors via First Street. Map © Google.
Why this score? — see what drove the D- grade
The composite is a weighted blend of 9 inputs, each scored 0–100. Each bar is that input's sub-score; the figure is the points it added to the 100-point composite (weight × sub-score).
- ARV discount +10.1/15.0
- Cash flow +9.0/30.0
- Rent growth +4.3/5.0
- Livability +4.0/5.0
- DSCR +2.5/10.0
- Condition / age +2.5/5.0
- 1% rule +2.3/10.0
- Schools +0.7/10.0
- Appreciation +0.0/10.0
$175,000
🖨 Deal sheet 📄 Offer letter ✓ Due diligence
Listing remarks MLS
WOW! Very spacious, 4 bedroom, 2 bath, 1575 square foot home. Large living room, dinette off the kitchen and formal dining room with built-in bookshelves. 3 bedrooms have restored wood floors the 4th bedroom has new vinyl flooring. The kitchen comes with stainless steel refrigerator, electric stove, dishwasher. There are Interior laundry connections. Lovely backyard with mature trees plus a storage building and garden shed. The 1 car garage with carport can accommodate 2 vehicles from the sun. Home is across the street from Buchanan Elementary School. Call today to view this amazing home!! The home is occupied by tenant need 24 hr to show. Rent is $1175/mo Deposit $1,000. 1 year lease 1/6/26-12/31/2026.
Key facts
- Formal dining room
- Living room
- Dinette
Tags
Neighborhood map
What this means for you Summary
Snapshot
- This is a 3-bed/2.0-bath single-family listed at $175k.
Deal economics
- At list price, monthly cash flow is $-139 ($-2k/yr) — negative.
- To cash-flow at today's rent, offer at most $151k (14.0% below list).
- To meet the 1% rule (rent ≥ 1% of price), the offer needs to be $128k (26.7% below list).
- Recommended offer: $128k (26.7% below list) — sets the bar for 1% rule.
- Cap rate 5.3% vs local median 3.7% in Oklahoma City — top-decile yield for the area; either an underpriced asset or a hidden risk that comps aren't pricing in. Stress-test before assuming the spread holds.
Location & tenants
- Location reads 80/100 on livability (#3 in OK, #1,635 nationally) — a professional / high-income tenant draw. Strengths: amenities A+, commute A+, cost of living A+; Watch: schools F, crime F.
- Oklahoma City (urban): math 7% / reading 10% proficiency, ranked #254 of 270 in OK (top 94%) — low school quality limits family demand, transient renter base, plan for 1-2y turnover; 82% free/reduced lunch — lower-income household profile, screen leases tightly.
- Market conditions: Rents rising fast (+7.3%/yr); 216 active listings in the ZIP; 26 comparable units currently listed for rent nearby; rentals at typical pace (median 24d on market — plan ~3-4 weeks tenant-placement turnaround); 5,365 units permitted in Oklahoma County in 2024 (569 in 5+ unit buildings).
Forward outlook
- Local home prices are declining (-3.0%/yr); year-one equity from $1k of loan paydown is wiped out by about $5k of value loss. Plan a longer hold.
- Oklahoma County population projected at +41% by 2050 — long-run rental-demand tailwind backs the buy-and-hold thesis.
Negotiation context
- It's been on market 313 days — a 12% lower offer ($154k) is reasonable based on typical stale-listing flexibility.
- 8 sale attempts since 11y ago; this cycle's ask is 14794% above the opening price — seller raised mid-cycle; expect resistance to lowballs.
- Current owner paid $65k; list at $175k implies a 169% gain — meaningful room to come down on a strong offer.
Risks & watch-outs
- Watch-outs: built in 1951 — expect roof / HVAC / electrical / plumbing capex.
- Climate carrying-cost: extreme-heat days projected 7→19/yr by 2055 (HVAC capex compounding) — expect insurance premiums to compound above CPI over the hold.
Questions for the listing agent
- What do current leases actually rent for vs. the listed asking? Can we see a recent rent roll and the last 12 months of T-12 income?
- It's been on market 313 days. Have you received any prior offers? Is the seller open to a 27% concession, seller financing, or rate buy-down credit?
- Built in 1951 — when were the roof, HVAC, electrical panel, plumbing, and water heater last replaced?
- Why hasn't it sold? Are there any deal-killer items the seller is aware of (foundation, flood, title, zoning, code violations)?
- Is there a deadline driving the sale (1031 exchange, divorce, estate, relocation)? That informs how much negotiation room exists.
- Schools are F-rated, which usually means shorter tenancies and higher turnover. Who's the typical renter profile here, and what's been the actual vacancy rate?
- Crime grade is F in this area — have there been break-ins, vandalism, or insurance claims at this property in the last 3 years? What carrier currently insures it and at what premium?
- The area grade is low — what's the realistic commute time and amenity access for the typical tenant pool here? Any planned neighborhood developments (good or bad) we should know about?
- What's the average days-on-market for RENTAL listings here right now (not sales)? A rising rental-DOM trend means longer vacancies and softer asking-rent achievability than the comps imply.
- What's the recent tenant-quality profile in this submarket — average credit score on applications, eviction rate, late-payment / NSF rate, and stable-employment percentage? A property-management company in the area should have these aggregated.
- How much new for-sale + rental construction is in the pipeline within 1–3 miles? Heavy new supply typically softens prices + rents 12–24 months out; constrained supply supports both.
Investment metrics
- 1% rule
- 0.73% ✗
- Cap rate
- 5.34%
- Cash-on-cash
- -3.39%
- DSCR
- 0.85
- GRM
- 11.4
CMA / ARV
- ARV (median comp)
- $185,717
- List price
- $175,000
- Delta
- -5.77%
- Verdict
- FAIR
- Comps
- 20 within 1.0 mi
Show comp detail 12 sales within ~0.75 mi
| Address | Dist | Beds/Ba | Sqft | Sold | Price | $/sf | Match |
|---|---|---|---|---|---|---|---|
| 4203 NW 16th Ter | 0.03mi | 3/2.0 | 1,572 (-0%) | 4mo | $175,000 | $111 | 95 |
| 1818 N Shawnee Ave | 0.24mi | 3/1.5 | 1,445 (-8%) | 3mo | $150,000 | $104 | 71 |
| 2609 N Geraldine Ave | 0.64mi | 3/2.0 | 1,544 (-2%) | 2mo | $174,000 | $113 | 66 |
| 2201 N Shawnee Ave | 0.46mi | 3/1.0 | 1,512 (-4%) | 5mo | $190,000 | $126 | 64 |
| 3913 NW 19th St | 0.38mi | 3/2.0 | 1,750 (+11%) | 2mo | $220,000 | $126 | 63 |
| 4213 NW 11th St | 0.40mi | 3/1.5 | 1,698 (+8%) | 11mo | $210,000 | $124 | 57 |
| 1220 N Utah Ave | 0.35mi | 4/2.5 (+1) | 1,459 (-7%) | 11mo | $221,750 | $152 | 55 |
| 910 N Warren Ave | 0.73mi | 4/2.0 (+1) | 1,604 (+2%) | 4mo | $240,000 | $150 | 55 |
| 2209 N Warren Ave | 0.42mi | 3/2.0 | 1,779 (+13%) | 10mo | $165,000 | $93 | 50 |
| 4506 NW 11th St | 0.60mi | 3/1.0 | 1,436 (-9%) | 7mo | $225,000 | $157 | 47 |
| 3833 NW 18 St | 0.44mi | 4/2.0 (+1) | 1,357 (-14%) | 8mo | $185,900 | $137 | 45 |
| 4621 NW 11th St | 0.70mi | 3/1.5 | 1,341 (-15%) | 8mo | $187,000 | $139 | 34 |
Match score weights: distance 35% · size 25% · config 20% · recency 20%. Top-matched comps best support the ARV.
Projected returns pro-forma
-3.0% appreciation · 7.29% rent growth · sell at horizon
- IRR
- -17.6%
- Equity multiple
- 0.36×
- Total profit
- $-31,417
- Equity at exit
- $26,093
- IRR
- -3.3%
- Equity multiple
- 0.74×
- Total profit
- $-12,872
- Equity at exit
- $15,131
Cash invested: $49,000 (down + closing). Projections, not guarantees.
Landlord ↔ Tenant lean methodology
- Overall (STATE)
- 83 Strongly Landlord-Friendly
- State Oklahoma
- 83 Strongly Landlord-Friendly · R+20
- County
- — inherits STATE
- City
- — inherits STATE
ZIP-level market 73107
- Rents YoY
- 7.3%
- Active inventory
- 216
- Price-to-rent
- 11.4×
Monthly cashflow live
- Estimated rent
- $1,283 high interval (Pro) →
- Mortgage (P&I)
- −$918
- Tax from tax record
- −$162 /mo · $1,940/yr
- Insurance
- −$73
- HOA
- −$0
- Vacancy / Maint / Mgmt
- −$269
- Net cashflow
- $-139
Break-even live
UW: 25.0% down · 7.5% · 30yr · 1.5% tax · 5.0% vac · 8.0% maint · 8.0% mgmt
Financing live
Cash to close
- Down payment
- $43,750
- Closing costs
- $5,250
- Reserves months
- —
- Total cash needed
- —
Loan-product check · same deal, 3 products live
Conventional
25% down · 7.5% · 30yr
- Down + closing
- —
- Monthly P&I
- —
- Monthly cashflow
- —
- DSCR
- —
- Eligible?
- —
Personal DTI + credit; lowest rate.
DSCR
20% down · 8.5% · 30yr
- Down + closing
- —
- Monthly P&I
- —
- Monthly cashflow
- —
- DSCR
- —
- Eligible?
- —
No personal income docs; deal must DSCR.
Hard money
10% down · 12.0% · 12mo
- Down + closing
- —
- Monthly P&I
- —
- Monthly cashflow
- —
- DSCR
- —
- Eligible?
- —
Short-term bridge; refi at stabilization.
Rent comps 26 comps
| Address | Beds | Baths | Sqft | Rent | $/sqft | DOM | Units | Dist |
|---|---|---|---|---|---|---|---|---|
| 3929 NW 18th St Oklahoma City, OK | 4.0 | 1.5 | 1347 | $1,200 | $0.89 | 2d | 1 | 0.35mi |
| 4304 NW 11th St Oklahoma City, OK | 3.0 | 1.5 | 1147 | $1,200 | $1.05 | 2d | 1 | 0.48mi |
| 1307 N Meridian Ave Oklahoma City, OK | 2.0 | 1.0–2.0 | 1242 | $925 | $0.74 | 2d | 6 | 0.49mi |
| 1309 N Meridian Ave Oklahoma City, OK | 1.0–2.0 | 1.0–1.5 | 925 | $975 | $1.05 | 2d | 4 | 0.50mi |
| 2221 N Meridian Ave Oklahoma City, OK | 2.0 | 1.5 | 1200 | $995 | $0.83 | 2d | 1 | 0.52mi |
| 3800 NW 19th St Oklahoma City, OK | 3.0 | 1.0 | 1073 | $1,250 | $1.16 | 23d | 1 | 0.54mi |
| 4220 NW 10th St Unit 11F Oklahoma City, OK | 3.0 | 2.0 | 1100 | $1,055 | $0.96 | 23d | 1 | 0.59mi |
| 3629 NW 18th St Oklahoma City, OK | 4.0 | 2.0 | 1176 | $1,800 | $1.53 | 43d | 1 | 0.69mi |
| 2626 N Meridian Ave Oklahoma City, OK | 1.0–2.0 | 1.0–2.0 | 1040 | $845 | $0.81 | 3d | 1 | 0.69mi |
| 1041 N Tabor Ave Oklahoma City, OK | 3.0 | 1.0 | 1200 | $1,050 | $0.88 | 23d | 1 | 0.76mi |
| 3701 NW 24th St Oklahoma City, OK | 3.0 | 2.0 | 1404 | $1,299 | $0.93 | 43d | 1 | 0.82mi |
| 800 N Meridian Ave Oklahoma City, OK | 1.0–3.0 | 1.0–2.0 | 912 | $999 | $1.09 | 23d | 1 | 0.85mi |
| 4036 NW 30th Ter Oklahoma City, OK | 3.0 | 2.0 | 1675 | $1,500 | $0.90 | 23d | 1 | 0.88mi |
| 4425 NW 31st St Oklahoma City, OK | 3.0 | 1.5 | 1222 | $1,500 | $1.23 | 23d | 1 | 1.09mi |
| 1616 Julie Pl Oklahoma City, OK | 3.0 | 2.0 | 1600 | $1,535 | $0.96 | 23d | 1 | 1.18mi |
| 1912 N Moulton Ct Unit 1912 Oklahoma City, OK | 3.0 | 2.0 | 1311 | $1,400 | $1.07 | 23d | 1 | 1.19mi |
| 3929 NW 32nd St Oklahoma City, OK | 3.0 | 1.0 | 1050 | $1,300 | $1.24 | 43d | 1 | 1.21mi |
| 5700 NW 23rd St Oklahoma City, OK | 3.0 | 2.0 | 1180 | $1,050 | $0.89 | 23d | 1 | 1.24mi |
| 3411 Cameron Ct Oklahoma City, OK | 2.0 | 2.0 | 1409 | $1,300 | $0.92 | 43d | 1 | 1.30mi |
| 3411 Cameron Ct Oklahoma City, OK | 2.0 | 2.0 | 1409 | $1,300 | $0.92 | 23d | 1 | 1.30mi |
| 4396 NW 36th St Oklahoma City, OK | 1.0–3.0 | 1.0–2.0 | 848 | $1,349 | $1.59 | 2d | 9 | 1.31mi |
| 3145 NW 21st St Oklahoma City, OK | 3.0 | 2.0 | 1728 | $1,600 | $0.93 | 2d | 1 | 1.32mi |
| 3228 NW 27th St Oklahoma City, OK | 2.0 | 1.0 | 1088 | $1,195 | $1.10 | 11d | 1 | 1.37mi |
| 4128 NW 36th St Unit 4 Oklahoma City, OK | 2.0 | 1.5 | 1130 | $1,125 | $1.00 | 23d | 1 | 1.42mi |
| 2112 N Drexel Blvd Oklahoma City, OK | 4.0 | 2.0 | 1443 | $1,695 | $1.17 | 43d | 1 | 1.44mi |
| 1414 N Drexel Blvd Oklahoma City, OK | 2.0 | 1.0 | 1604 | $1,100 | $0.69 | 2d | 1 | 1.44mi |
Listing history 36 events
-
2026-06-18days on market $175,000 Active 313 DOM
-
2026-06-17days on market $175,000 Active 312 DOM
-
2026-06-16days on market $175,000 Active 311 DOM
-
2026-06-15days on market $175,000 Active 310 DOM
-
2026-06-13days on market $175,000 Active 308 DOM
-
2026-06-09days on market $175,000 Active 304 DOM
-
2026-06-08days on market $175,000 Active 303 DOM
-
2026-06-07days on market $175,000 Active 302 DOM
-
2026-06-05days on market $175,000 Active 299 DOM
-
2026-06-03days on market $175,000 Active 298 DOM
-
2026-06-02days on market $175,000 Active 297 DOM
-
2026-06-01days on market $175,000 Active 296 DOM
-
2026-05-31days on market $175,000 Active 295 DOM
-
2026-01-09historical $1,175
-
2026-01-05$1,175
-
2026-01-04historical $1,175
-
2025-12-12$1,175
-
2025-08-09$175,000 Active 712-char remark
Show marketing remark (712 chars)
WOW! Very spacious, 4 bedroom, 2 bath, 1575 square foot home. Large living room, dinette off the kitchen and formal dining room with built-in bookshelves. 3 bedrooms have restored wood floors the 4th bedroom has new vinyl flooring. The kitchen comes with stainless steel refrigerator, electric stove, dishwasher. There are Interior laundry connections. Lovely backyard with mature trees plus a storage building and garden shed. The 1 car garage with carport can accommodate 2 vehicles from the sun. Home is across the street from Buchanan Elementary School. Call today to view this amazing home!! The home is occupied by tenant need 24 hr to show. Rent is $1175/mo Deposit $1,000. 1 year lease 1/6/26-12/31/2026.
-
2025-01-20historical $1,195
-
2025-01-11price $1,195
-
2024-12-20$1,295
-
2024-12-20historical $1,295
-
2024-12-18$1,295
-
2024-11-25historical $1,295
-
2024-11-16$1,295
-
2024-11-16historical $1,295
-
2024-11-10price $1,295
-
2024-11-03price $1,325
-
2024-10-02$1,375
-
2016-06-24soldstatus $65,089
-
2016-05-31soldstatus $65,089 Sold 450-char remark
Show marketing remark (450 chars)
FORECLOSURE-ONE STORY BRICK HOME OFFERS THREE BEDROOMS, TWO BATHS, TWO LIVING AREAS, EAT-IN KITCHEN AND A FORMAL DINING ROOM. FORMAL DINING FEATURES HARDWOOD FLOORING AND BUILT-IN HUTCHES, GREAT FOR DISPLAYING YOUR CHINA! NICE SIZED UNFINISHED BASEMENT WAITING FOR YOU TO PUT YOUR OWN PERSONAL TOUCH ON. DETACHED GARAGE PLUS CARPORT! BUYER/BUYER’S AGENT TO VERIFY ALL INFORMATION: SCHOOLS, TAXES, RESTRICTIONS, ROOM SIZES, ETC. SOLD AS-IS.
-
2016-05-23status Pending 450-char remark
Show marketing remark (450 chars)
FORECLOSURE-ONE STORY BRICK HOME OFFERS THREE BEDROOMS, TWO BATHS, TWO LIVING AREAS, EAT-IN KITCHEN AND A FORMAL DINING ROOM. FORMAL DINING FEATURES HARDWOOD FLOORING AND BUILT-IN HUTCHES, GREAT FOR DISPLAYING YOUR CHINA! NICE SIZED UNFINISHED BASEMENT WAITING FOR YOU TO PUT YOUR OWN PERSONAL TOUCH ON. DETACHED GARAGE PLUS CARPORT! BUYER/BUYER’S AGENT TO VERIFY ALL INFORMATION: SCHOOLS, TAXES, RESTRICTIONS, ROOM SIZES, ETC. SOLD AS-IS.
-
2016-04-15price $69,000 450-char remark
Show marketing remark (450 chars)
FORECLOSURE-ONE STORY BRICK HOME OFFERS THREE BEDROOMS, TWO BATHS, TWO LIVING AREAS, EAT-IN KITCHEN AND A FORMAL DINING ROOM. FORMAL DINING FEATURES HARDWOOD FLOORING AND BUILT-IN HUTCHES, GREAT FOR DISPLAYING YOUR CHINA! NICE SIZED UNFINISHED BASEMENT WAITING FOR YOU TO PUT YOUR OWN PERSONAL TOUCH ON. DETACHED GARAGE PLUS CARPORT! BUYER/BUYER’S AGENT TO VERIFY ALL INFORMATION: SCHOOLS, TAXES, RESTRICTIONS, ROOM SIZES, ETC. SOLD AS-IS.
-
2016-02-29price $78,000 450-char remark
Show marketing remark (450 chars)
FORECLOSURE-ONE STORY BRICK HOME OFFERS THREE BEDROOMS, TWO BATHS, TWO LIVING AREAS, EAT-IN KITCHEN AND A FORMAL DINING ROOM. FORMAL DINING FEATURES HARDWOOD FLOORING AND BUILT-IN HUTCHES, GREAT FOR DISPLAYING YOUR CHINA! NICE SIZED UNFINISHED BASEMENT WAITING FOR YOU TO PUT YOUR OWN PERSONAL TOUCH ON. DETACHED GARAGE PLUS CARPORT! BUYER/BUYER’S AGENT TO VERIFY ALL INFORMATION: SCHOOLS, TAXES, RESTRICTIONS, ROOM SIZES, ETC. SOLD AS-IS.
-
2015-11-13$84,000 Active 450-char remark
Show marketing remark (450 chars)
FORECLOSURE-ONE STORY BRICK HOME OFFERS THREE BEDROOMS, TWO BATHS, TWO LIVING AREAS, EAT-IN KITCHEN AND A FORMAL DINING ROOM. FORMAL DINING FEATURES HARDWOOD FLOORING AND BUILT-IN HUTCHES, GREAT FOR DISPLAYING YOUR CHINA! NICE SIZED UNFINISHED BASEMENT WAITING FOR YOU TO PUT YOUR OWN PERSONAL TOUCH ON. DETACHED GARAGE PLUS CARPORT! BUYER/BUYER’S AGENT TO VERIFY ALL INFORMATION: SCHOOLS, TAXES, RESTRICTIONS, ROOM SIZES, ETC. SOLD AS-IS.
-
2006-02-14soldstatus $90,000
ⓘ Source: listings_history table (triggers on properties + properties_extension) + one-shot
backfill from property_details.listing_events for pre-trigger history.
Tax reassessment forecast OK · Resets to sale price
- Current annual tax
- $1,940 · $162/mo
- Projected year-2 tax
- $1,940 · $162/mo
- Expected delta
- $0/yr ($0/mo · 0.0%)
ⓘ Screening estimate from a state-policy table — verify with the county assessor before closing.
Climate risk First Street
- Flood 1/10 Low FEMA zone X (unshaded) · 0% chance over 30 yrs
- Wildfire 1/10 Low
- Heat 6/10 Major 7 d/yr ≥107°F today · 19 d/yr by 30 yrs out
- Wind 2/10 Low 3% chance of damaging wind over 30 yrs
- Air quality 2/10 Low 1 unhealthy d/yr today · 2 by 30 yrs out
Nearby sold comps map
Loading sold comps map…
Walkable amenities ~0.75 mi
Loading nearby amenities…
Taxation est. · year 1
- Rental income
- $15,399
- − Mortgage interest
- −$9,803
- − Property taxes
- −$1,940
- − Insurance
- −$875
- − Repairs & maintenance
- −$1,232
- − Management
- −$1,232
- − Depreciation
- −$5,091
- Taxable loss
- −$4,773
- Est. tax savings @ 24.0%
- +$1,146
- After-tax cash flow
- $-517/yr
For passive investors: Depreciation is non-cash, so a rental often shows a tax loss while cash-flowing — sheltering income. Rental losses are passive: they offset passive income freely, and up to $25,000/yr can offset ordinary (W-2) income if you actively participate and your MAGI is under $100k (phasing out to $0 by $150k); unused losses carry forward. On sale, claimed depreciation is recaptured at up to 25%, and gains may owe capital-gains tax (a 1031 exchange can defer both). Figures are a year-1 estimate at your 24.0% rate — not tax advice; consult a CPA.
Schools (NCES district)
- District
- Oklahoma City
- NCES district ID
- 4022770
- Math proficiency
- 7% ▼ -5.00%
- Reading proficiency
- 10% ▼ -6.00%
- Median HH income
- $35,606
- Composite
- 7.0/100
- National rank
- #9970
- State rank
- #254 of 270 in OK
Livability — Oklahoma City
- Score
- 80/100
- State rank
- #3
- US rank
- #1635
Category grades
Schools grade is shown separately in the Schools card above.
Census & demographics
- Census place
- Oklahoma City, OK
- County
- Oklahoma County · 771,644 people
- City population
- 498,656
- Metro
- Oklahoma City, OK
- Population (ZIP)
- 25,791
- Household income
- $56,873
- Rent vs Own
- Severe rent burden
- 1210.0
Population outlook (Oklahoma County) Hauer SSP2
- Today (2025)
- 911,875 people
- By 2030
- 982,413 · +7.7%
- By 2040
- 1,130,468 · +24.0%
- By 2050
- 1,288,422 · +41.3%
- By 2075
- 1,711,482 · +87.7%
- By 2100
- 2,088,448 · +129.0%
Race, ethnicity, and origin ACS 2023
- Neighborhood character
- Diverse neighborhood (Simpson 0.64)
- Race & ethnicity
- White 47% Hispanic / Latino 37% Two or more races 13% Native American 6% Black 5% Asian 2%
- Hispanic origin (detail)
- Mexican 22%
- Common ancestry
- Lithuanian 1% Italian 1% Slovak 1%
- Foreign-born
- 19% · Canada, Vietnam
- Languages at home
- 67% English-only · Spanish 30% Vietnamese 1%
Political lean MEDSL · Oklahoma
- 2024 margin
- Toss-up / Even · D 48.0% · R 49.7% · Other 2.3%
- 2008→2024 swing
- +15.1pp toward D · 2008: -16.8pp · 2024: -1.7pp
- All cycles
- 2024: R+1.7 2020: R+1.1 2016: R+10.5 2012: R+16.7 2008: R+16.8
Not yet ingested
- Civics
- —
Market trends
- HPI YoY
- ▼ -245.03%
- Current HPI
- 274.7844
- Rent YoY
- ▲ 7.29%
- Metro
- Oklahoma City, OK
- State GDP YoY
- ▲ 1.55%
- F500 in state
- 6
Industry mix (Fortune 500 HQ in OK)
| Industry | F500 HQs | Revenue |
|---|---|---|
| Energy | 3 | $48B |
|
||
Price history
-98.7% since first listed23 events — show timeline
- 2026-01-09 Rental Removed $1,175 RENTLY
- 2026-01-05 Listed for Rent $1,175 RENTLY
- 2026-01-04 Rental Removed $1,175 APPFOLIO
- 2025-12-12 Listed for Rent $1,175 APPFOLIO
- 2025-08-09 Listed $175,000 MLSOK
- 2025-01-20 Rental Removed $1,195 RENTLY
- 2025-01-11 Price Changed $1,195 RENTLY
- 2024-12-20 Listed for Rent $1,295 RENTLY
- 2024-12-20 Rental Removed $1,295 APPFOLIO
- 2024-12-18 Listed for Rent $1,295 APPFOLIO
- 2024-11-25 Rental Removed $1,295 RENTLY
- 2024-11-16 Listed for Rent $1,295 RENTLY
- 2024-11-16 Rental Removed $1,295 APPFOLIO
- 2024-11-10 Price Changed $1,295 APPFOLIO
- 2024-11-03 Price Changed $1,325 APPFOLIO
- 2024-10-02 Listed for Rent $1,375 APPFOLIO
- 2016-06-24 Sold (Public Records) $65,089 Public Records
- 2016-05-31 Sold (MLS) $65,089 MLSOK
- 2016-05-23 Pending — MLSOK
- 2016-04-15 Price Changed $69,000 MLSOK
- 2016-02-29 Price Changed $78,000 MLSOK
- 2015-11-13 Listed $84,000 MLSOK
- 2006-02-14 Sold (Public Records) $90,000 Public Records
Property tax history
+5.5%/yrLatest (2025): $1,940 · +4.2% YoY. Source: county tax records.
Cash-flow waterfall
monthlySold comps — $/sqft
last 12 mo · ≤1 miLoading sold comps…