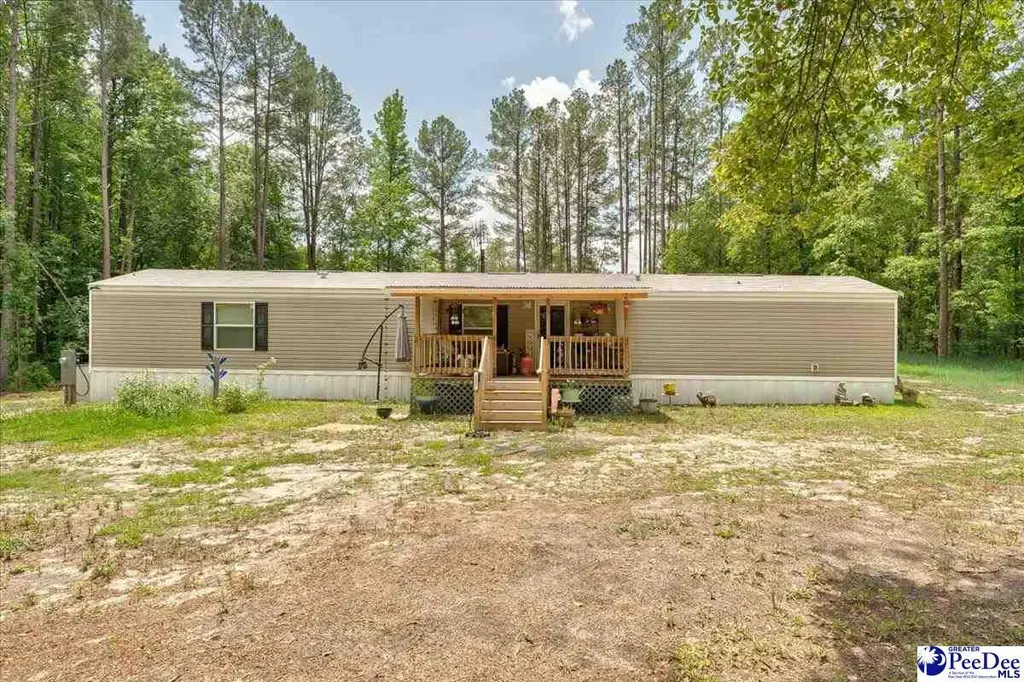
127 Branchview Rd · North Hartsville, SC
Flood risk 1/10 · Minimal
- FEMA flood zone
- —
- Chance of flooding over 30 yrs
- 0.0%
- Est. flood insurance / yr
- —
Fire risk 6/10 · Moderate
- Est. fire insurance / yr
- $783 – $1,453
Heat risk 6/10 · Moderate
- Hot days now (above 108°F)
- 7 days/yr
- Hot days in 30 yrs
- 15 days/yr
Wind risk 6/10 · Moderate
- Chance of severe wind over 30 yrs
- 74.0%
Air-quality risk 2/10 · Minimal
- Unhealthy air days now
- 0 days/yr
- Unhealthy air days in 30 yrs
- 1 days/yr
Risk factors via First Street. Map © Google.
Why this score? — see what drove the F grade
The composite is a weighted blend of 9 inputs, each scored 0–100. Each bar is that input's sub-score; the figure is the points it added to the 100-point composite (weight × sub-score).
- ARV discount +7.5/15.0
- Cash flow +3.5/30.0
- Livability +3.1/5.0
- Schools +2.7/10.0
- Rent growth +2.5/5.0
- Condition / age +2.5/5.0
- 1% rule +0.0/10.0
- DSCR +0.0/10.0
- Appreciation +0.0/10.0
$198,000
🖨 Deal sheet 📄 Offer letter ✓ Due diligence
Listing remarks MLS
Mobile Home in the forest! Corner lot with lots of privacy. Private well and underground power make this 2.44 lot ready for expansion in the future. 2 small storage buildings convey with the mobile home. Sovereign and refrigerator convey and there is a washer and dryer hook up. Could be a good investment property. Property is being sold for cash only and in as is condition. Go take a look and see for yourself. Call a realtor today.
Key facts
- New well
- Manufactured home
- Entertaining porch
Tags
Property features AI
Exterior
- Utilities: Septic tank
- Home design: Manufactured home; Residential property; Corner lot
- Construction: Vinyl siding; Shingle roof; Crawl space foundation; Built area above grade: 1,280
- Exterior features: Deck; Porch; Storm door(s)
Interior
- Kitchen: Microwave; Range; Refrigerator
- Flooring: Vinyl flooring
- Bathrooms: 2 full bathrooms
- Heating & cooling: Heat pump; Central air; Ceiling fan(s)
- Interior features: Walk-in closet(s); Insulated windows; Storage
Neighborhood map
What this means for you Summary
Snapshot
- This is a 2-bed/2.0-bath other listed at $198k.
Deal economics
- At list price, monthly cash flow is $-602 ($-7k/yr) — negative.
- To cash-flow at today's rent, offer at most $111k (44.0% below list).
- To meet the 1% rule (rent ≥ 1% of price), the offer needs to be $97k (51.0% below list).
- Recommended offer: $97k (51.0% below list) — sets the bar for 1% rule.
- Cap rate 2.6% vs local median 3.4% in North Hartsville — below-typical yield; the buyer is paying a premium for something (appreciation thesis, condition, location) that the cap rate doesn't capture.
Location & tenants
- Location reads 62/100 on livability (#190 in SC) — a middle-class / working-renter tenant base. Strengths: crime A+, cost of living A+, housing A; Watch: employment C-, amenities F, commute F.
- Darlington 01 (town): math 27% / reading 37% proficiency, ranked #52 of 80 in SC (top 65%) — families likely to look elsewhere, expect single-tenant / working-renter base with shorter leases; 75% free/reduced lunch — lower-income household profile, screen leases tightly.
- Zoned schools: North Hartsville Elementary (math 46% / reading 37%, grade F, #269 of 597 statewide, top 46%, 527 students, 100% FRL); Hartsville Middle (math 23% / reading 31%, grade F, #153 of 229 statewide, top 68%, 921 students, 100% FRL); Hartsville High (math 42% / reading 80%, grade C+, #105 of 196 statewide, top 54%, 1,133 students, 100% FRL) — zoned schools average 100% FRL vs 75% district-wide (25 pts higher); higher-poverty schools than district average — tighter screening recommended.
- Market conditions: 156 active listings in the ZIP; 195 units permitted in Darlington County in 2024 (0 in 5+ unit buildings).
Forward outlook
- Local home prices are declining (-3.0%/yr); year-one equity from $1k of loan paydown is wiped out by about $6k of value loss. Plan a longer hold.
- Darlington County population projected at -18% by 2050 — secular population decline; favor cash flow + early exit over multi-decade hold.
Negotiation context
- It's been on market 22 days — a 2% lower offer ($195k) is reasonable based on typical stale-listing flexibility.
- 2 sale attempts since 3y ago with the ask held roughly flat each time — persistent listings suggest the price (not the market) is what's stuck; bring a comps-based counter.
- Current owner paid $10k; list at $198k implies a 1841% gain — meaningful room to come down on a strong offer.
Risks & watch-outs
- Climate carrying-cost: major wind risk, 74% chance of damaging wind over 30y; major wildfire risk; extreme-heat days projected 7→15/yr by 2055 (HVAC capex compounding) — expect insurance premiums to compound above CPI over the hold.
Questions for the listing agent
- What do current leases actually rent for vs. the listed asking? Can we see a recent rent roll and the last 12 months of T-12 income?
- Is there a deadline driving the sale (1031 exchange, divorce, estate, relocation)? That informs how much negotiation room exists.
- Schools are F-rated, which usually means shorter tenancies and higher turnover. Who's the typical renter profile here, and what's been the actual vacancy rate?
- The area grade is low — what's the realistic commute time and amenity access for the typical tenant pool here? Any planned neighborhood developments (good or bad) we should know about?
- What's the average days-on-market for RENTAL listings here right now (not sales)? A rising rental-DOM trend means longer vacancies and softer asking-rent achievability than the comps imply.
- What's the recent tenant-quality profile in this submarket — average credit score on applications, eviction rate, late-payment / NSF rate, and stable-employment percentage? A property-management company in the area should have these aggregated.
- How much new for-sale + rental construction is in the pipeline within 1–3 miles? Heavy new supply typically softens prices + rents 12–24 months out; constrained supply supports both.
Investment metrics
- 1% rule
- 0.49% ✗
- Cap rate
- 2.64%
- Cash-on-cash
- -13.04%
- DSCR
- 0.42
- GRM
- 17.0
CMA / ARV
No comps found within radius.
Projected returns pro-forma
-3.0% appreciation · 3.0% rent growth · sell at horizon
- IRR
- -40.7%
- Equity multiple
- -0.27×
- Total profit
- $-70,443
- Equity at exit
- $29,522
- IRR
- -66.2%
- Equity multiple
- -1.00×
- Total profit
- $-110,693
- Equity at exit
- $17,119
Cash invested: $55,440 (down + closing). Projections, not guarantees.
Landlord ↔ Tenant lean methodology
- Overall (STATE)
- 90 Strongly Landlord-Friendly
- State South Carolina
- 90 Strongly Landlord-Friendly · R+6
- County
- — inherits STATE
- City
- — inherits STATE
ZIP-level market 29550
- Home prices YoY
- -22.3%
- Active inventory
- 156
- Price-to-rent
- 17.0×
Monthly cashflow live
- Estimated rent
- $969 medium interval (Pro) →
- Mortgage (P&I)
- −$1,038
- Tax est. 1.5%
- −$248 /mo · $2,970/yr
- Insurance
- −$82
- HOA
- −$0
- Vacancy / Maint / Mgmt
- −$204
- Net cashflow
- $-602
Break-even live
UW: 25.0% down · 7.5% · 30yr · 1.5% tax · 5.0% vac · 8.0% maint · 8.0% mgmt
Financing live
Cash to close
- Down payment
- $49,500
- Closing costs
- $5,940
- Reserves months
- —
- Total cash needed
- —
Loan-product check · same deal, 3 products live
Conventional
25% down · 7.5% · 30yr
- Down + closing
- —
- Monthly P&I
- —
- Monthly cashflow
- —
- DSCR
- —
- Eligible?
- —
Personal DTI + credit; lowest rate.
DSCR
20% down · 8.5% · 30yr
- Down + closing
- —
- Monthly P&I
- —
- Monthly cashflow
- —
- DSCR
- —
- Eligible?
- —
No personal income docs; deal must DSCR.
Hard money
10% down · 12.0% · 12mo
- Down + closing
- —
- Monthly P&I
- —
- Monthly cashflow
- —
- DSCR
- —
- Eligible?
- —
Short-term bridge; refi at stabilization.
Listing history 21 events
-
2026-06-19days on market $198,000 Active 22 DOM
-
2026-06-18days on market $198,000 Active 21 DOM
-
2026-06-17days on market $198,000 Active 20 DOM
-
2026-06-16days on market $198,000 Active 19 DOM
-
2026-06-15days on market $198,000 Active 18 DOM
-
2026-06-14days on market $198,000 Active 16 DOM
-
2026-06-13days on market $198,000 Active 15 DOM
-
2026-06-10days on market $198,000 Active 13 DOM
-
2026-06-09days on market $198,000 Active 12 DOM
-
2026-06-08days on market $198,000 Active 11 DOM
-
2026-06-07days on market $198,000 Active 10 DOM
-
2026-06-05days on market $198,000 Active 7 DOM
-
2026-06-03days on market $198,000 Active 6 DOM
-
2026-06-02days on market $198,000 Active 5 DOM
-
2026-06-01days on market $198,000 Active 4 DOM
-
2026-05-31days on market $198,000 Active 3 DOM
-
2026-05-30days on market $198,000 Active 2 DOM
-
2026-05-28$198,000 Active
-
2023-09-26soldstatus 435-char remark
Show marketing remark (435 chars)
Mobile Home in the forest! Corner lot with lots of privacy. Private well and underground power make this 2.44 lot ready for expansion in the future. 2 small storage buildings convey with the mobile home. Sovereign and refrigerator convey and there is a washer and dryer hook up. Could be a good investment property. Property is being sold for cash only and in as is condition. Go take a look and see for yourself. Call a realtor today.
-
2023-08-09$59,900 435-char remark
Show marketing remark (435 chars)
Mobile Home in the forest! Corner lot with lots of privacy. Private well and underground power make this 2.44 lot ready for expansion in the future. 2 small storage buildings convey with the mobile home. Sovereign and refrigerator convey and there is a washer and dryer hook up. Could be a good investment property. Property is being sold for cash only and in as is condition. Go take a look and see for yourself. Call a realtor today.
-
1995-02-01soldstatus $10,200
ⓘ Source: listings_history table (triggers on properties + properties_extension) + one-shot
backfill from property_details.listing_events for pre-trigger history.
Climate risk First Street
- Flood 1/10 Low 0% chance over 30 yrs
- Wildfire 6/10 Major
- Heat 6/10 Major 7 d/yr ≥108°F today · 15 d/yr by 30 yrs out
- Wind 6/10 Major 74% chance of damaging wind over 30 yrs
- Air quality 2/10 Low 0 unhealthy d/yr today · 1 by 30 yrs out
Nearby sold comps map
Loading sold comps map…
Walkable amenities ~0.75 mi
Loading nearby amenities…
Taxation est. · year 1
- Rental income
- $11,633
- − Mortgage interest
- −$11,091
- − Property taxes
- −$2,970
- − Insurance
- −$990
- − Repairs & maintenance
- −$931
- − Management
- −$931
- − Depreciation
- −$5,760
- Taxable loss
- −$11,039
- Est. tax savings @ 24.0%
- +$2,649
- After-tax cash flow
- $-4,581/yr
For passive investors: Depreciation is non-cash, so a rental often shows a tax loss while cash-flowing — sheltering income. Rental losses are passive: they offset passive income freely, and up to $25,000/yr can offset ordinary (W-2) income if you actively participate and your MAGI is under $100k (phasing out to $0 by $150k); unused losses carry forward. On sale, claimed depreciation is recaptured at up to 25%, and gains may owe capital-gains tax (a 1031 exchange can defer both). Figures are a year-1 estimate at your 24.0% rate — not tax advice; consult a CPA.
Schools (NCES district)
- District
- Darlington 01
- NCES district ID
- 4501860
- Math proficiency
- 27% ▼ -13.00%
- Reading proficiency
- 37% ▼ -1.00%
- Median HH income
- $36,243
- Composite
- 26.51/100
- National rank
- #7202
- State rank
- #52 of 80 in SC
Livability — North Hartsville
- Score
- 62/100
- State rank
- #190
- US rank
- #16507
Category grades
Schools grade is shown separately in the Schools card above.
Census & demographics
- Census place
- North Hartsville, SC
- Population (ZIP)
- 30,198
Population outlook (Darlington County) Hauer SSP2
- Today (2025)
- 64,981 people
- By 2030
- 62,846 · -3.3%
- By 2040
- 58,146 · -10.5%
- By 2050
- 53,541 · -17.6%
- By 2075
- 43,477 · -33.1%
- By 2100
- 34,013 · -47.7%
Race, ethnicity, and origin ACS 2023
- Neighborhood character
- Majority White (63%)
- Race & ethnicity
- White 63% Black 31% Two or more races 3% Hispanic / Latino 3%
- Common ancestry
- Slovak 3% Serbian 3% Romanian 1%
- Foreign-born
- 3% · Canada
- Languages at home
- 96% English-only · Spanish 3%
Political lean MEDSL · Darlington
- 2024 margin
- R (+13.3) · D 42.8% · R 56.1% · Other 1.1%
- 2008→2024 swing
- -13.2pp toward R · 2008: -0.1pp · 2024: -13.3pp
- All cycles
- 2024: R+13.3 2020: R+5.0 2016: R+3.7 2012: D+3.4 2008: R+0.1
Not yet ingested
- Civics
- —
Market trends
- HPI YoY
- ▼ -63.03%
- Current HPI
- 219.996
- Rent YoY
- —
- Metro
- —
- State GDP YoY
- ▲ 4.51%
- F500 in state
- 2
Industry mix (Fortune 500 HQ in SC)
| Industry | F500 HQs | Revenue |
|---|---|---|
| Packaging | 1 | $7B |
|
||
Price history
+1841.2% since first listed4 events — show timeline
- 2026-05-28 Listed $198,000 RAGPD
- 2023-09-26 Sold (MLS) — RAGPD
- 2023-08-09 Listed $59,900 RAGPD
- 1995-02-01 Sold (Public Records) $10,200 Public Records
Property tax history
-10.1%/yrLatest (2025): $143 · +2.5% YoY. Source: county tax records.
Cash-flow waterfall
monthlySold comps — $/sqft
last 12 mo · ≤1 miLoading sold comps…