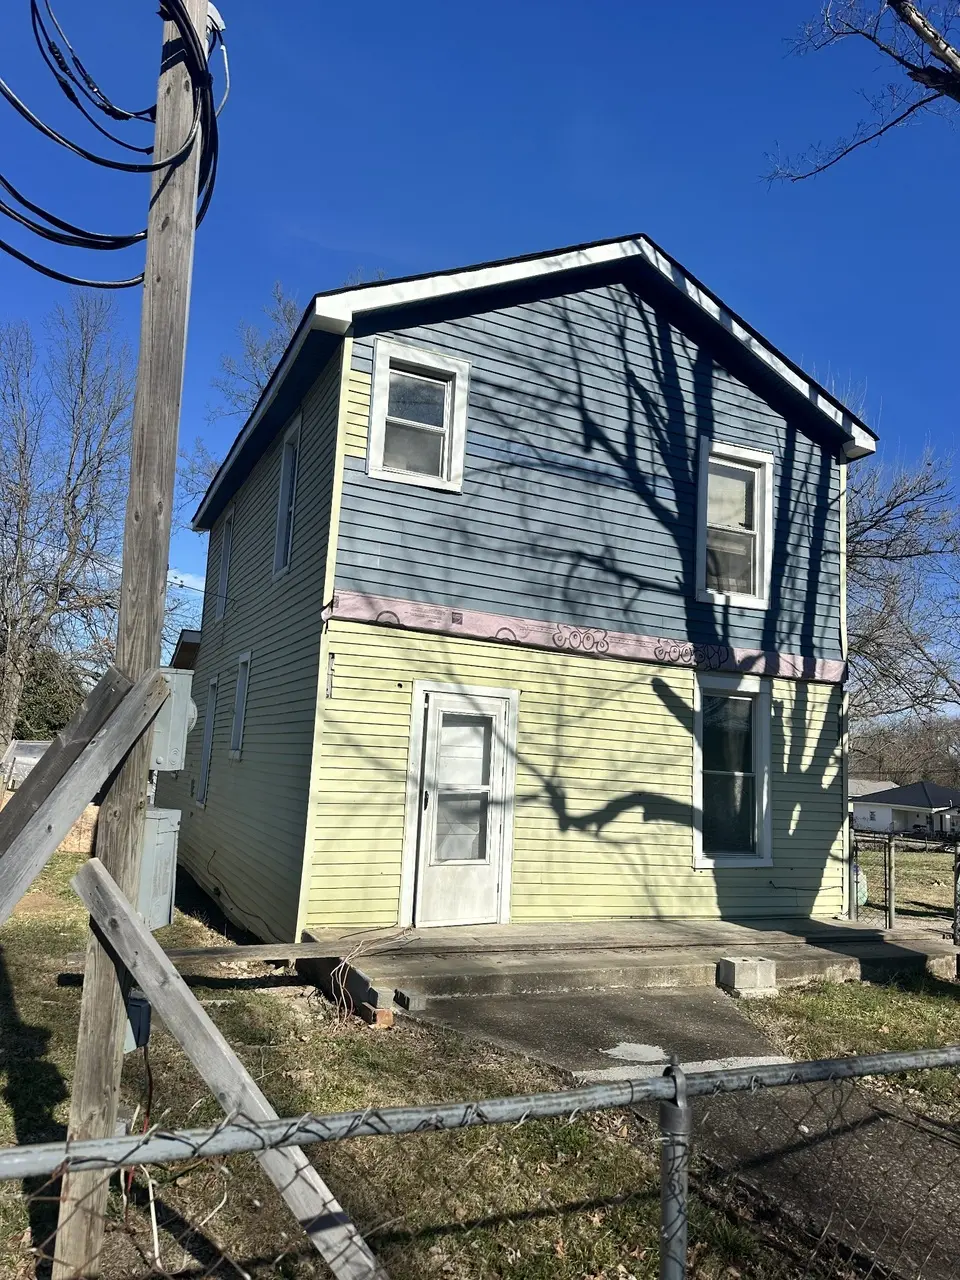
412 W 2nd St · Hopkinsville, KY
Flood risk 3/10 · Minor
- FEMA flood zone
- X (unshaded)
- Chance of flooding over 30 yrs
- 0.17%
- Est. flood insurance / yr
- $507 – $1,088
Fire risk 1/10 · Minimal
- Est. fire insurance / yr
- $839 – $1,559
Heat risk 5/10 · Moderate
- Hot days now (above 108°F)
- 7 days/yr
- Hot days in 30 yrs
- 21 days/yr
Wind risk 3/10 · Minor
- Chance of severe wind over 30 yrs
- 8.0%
Air-quality risk 2/10 · Minimal
- Unhealthy air days now
- 0 days/yr
- Unhealthy air days in 30 yrs
- 1 days/yr
Risk factors via First Street. Map © Google.
Why this score? — see what drove the B+ grade
The composite is a weighted blend of 9 inputs, each scored 0–100. Each bar is that input's sub-score; the figure is the points it added to the 100-point composite (weight × sub-score).
- Cash flow +30.0/30.0
- ARV discount +15.0/15.0
- 1% rule +10.0/10.0
- DSCR +10.0/10.0
- Rent growth +4.2/5.0
- Livability +3.2/5.0
- Schools +2.7/10.0
- Condition / age +2.5/5.0
- Appreciation +0.0/10.0
$60,000
🖨 Deal sheet 📄 Offer letter ✓ Due diligence
Listing remarks MLS
Two-story home offering a renovation opportunity in close proximity to downtown. Some renovations have been started; however, the home remains unfinished and will require additional work. Seller discloses the property sustained a fire in the past. Property currently has temporary electrical service, and water service is not active. No permits were obtained for improvements. Property is being sold AS IS, WHERE IS, with no warranties or representations expressed or implied by Seller. Year built is unknown. The year shown is approximate and is not guaranteed. All information deemed reliable but not guaranteed. Buyer to verify all information, including year built, square footage, condition, zoning, permitted use, utility availability, repairs, and suitability for Buyer’s intended use.
Key facts
- 6,098 sq ft lot
- Built 1970
- Listed 147 days
Neighborhood map
What this means for you Summary
Snapshot
- This is a 2-bed/1.0-bath single-family listed at $60k.
Deal economics
- At list price, monthly cash flow is $456 ($5k/yr) — positive.
- The deal already cash-flows at list — no discount required.
- Meets the 1% rule at list price ($1k rent vs $60k).
- Recommended offer: $53k (12.0% below list) — sets the bar for market timing.
- Cap rate 15.4% vs local median 4.3% in Hopkinsville — top-decile yield for the area; either an underpriced asset or a hidden risk that comps aren't pricing in. Stress-test before assuming the spread holds.
Location & tenants
- Location reads 64/100 on livability (#305 in KY) — a middle-class / working-renter tenant base. Strengths: cost of living A+, housing A, health & safety B+; Watch: schools D+, crime F, amenities F.
- Christian County (town): math 30% / reading 34% proficiency, ranked #93 of 165 in KY (top 56%) — families likely to look elsewhere, expect single-tenant / working-renter base with shorter leases; 61% free/reduced lunch — lower-income household profile, screen leases tightly.
- Market conditions: Rents rising fast (+6.6%/yr); 252 active listings in the ZIP; 32 comparable units currently listed for rent nearby; rentals at typical pace (median 21d on market — plan ~3-4 weeks tenant-placement turnaround); 193 units permitted in Christian County in 2024 (66 in 5+ unit buildings).
Forward outlook
- Local home prices are declining (-3.0%/yr); year-one equity from $415 of loan paydown is wiped out by about $2k of value loss. Plan a longer hold.
- Christian County population projected at -20% by 2050 — secular population decline; favor cash flow + early exit over multi-decade hold.
- At projected returns (-3.0% appreciation + 6.6% rent growth), your $17k cash investment doubles in ~4 years — after that, you're playing with house money.
Negotiation context
- It's been on market 147 days — a 12% lower offer ($53k) is reasonable based on typical stale-listing flexibility.
- 2 sale attempts since 6y ago; this cycle's ask has dropped $15k (20%) from the opening price — seller is motivated, your offer sets the floor, not the list.
- Current owner paid $35k; list at $60k implies a 71% gain — meaningful room to come down on a strong offer.
Risks & watch-outs
- Climate carrying-cost: extreme-heat days projected 7→21/yr by 2055 (HVAC capex compounding) — expect insurance premiums to compound above CPI over the hold.
Questions for the listing agent
- It's been on market 147 days. Have you received any prior offers? Is the seller open to a 12% concession, seller financing, or rate buy-down credit?
- Built in 1970 — when were the roof, HVAC, electrical panel, plumbing, and water heater last replaced?
- Why hasn't it sold? Are there any deal-killer items the seller is aware of (foundation, flood, title, zoning, code violations)?
- Is there a deadline driving the sale (1031 exchange, divorce, estate, relocation)? That informs how much negotiation room exists.
- Schools are D-rated, which usually means shorter tenancies and higher turnover. Who's the typical renter profile here, and what's been the actual vacancy rate?
- Crime grade is F in this area — have there been break-ins, vandalism, or insurance claims at this property in the last 3 years? What carrier currently insures it and at what premium?
- What's the average days-on-market for RENTAL listings here right now (not sales)? A rising rental-DOM trend means longer vacancies and softer asking-rent achievability than the comps imply.
- What's the recent tenant-quality profile in this submarket — average credit score on applications, eviction rate, late-payment / NSF rate, and stable-employment percentage? A property-management company in the area should have these aggregated.
- How much new for-sale + rental construction is in the pipeline within 1–3 miles? Heavy new supply typically softens prices + rents 12–24 months out; constrained supply supports both.
Investment metrics
- 1% rule
- 1.72% ✓
- Cap rate
- 15.41%
- Cash-on-cash
- 32.55%
- DSCR
- 2.45
- GRM
- 4.9
CMA / ARV
- ARV (median comp)
- $74,177
- List price
- $60,000
- Delta
- -19.11%
- Verdict
- UNDERPRICED
- Comps
- 20 within 1.0 mi
Show comp detail 11 sales within ~0.75 mi
| Address | Dist | Beds/Ba | Sqft | Sold | Price | $/sf | Match |
|---|---|---|---|---|---|---|---|
| 116 N Jessup Ave | 0.13mi | 3/1.5 (+1) | 1,120 (-6%) | 15mo | $135,000 | $121 | 64 |
| 509 S Cleveland Ave | 0.16mi | 2/2.0 | 1,354 (+13%) | 12mo | $127,000 | $94 | 57 |
| 1309 Phelps Ave | 0.46mi | 3/2.0 (+1) | 1,201 (+0%) | 15mo | $162,000 | $135 | 57 |
| 111 N Kentucky Ave | 0.25mi | 2/1.0 | 1,031 (-14%) | 15mo | $54,000 | $52 | 53 |
| 814 E 4th St | 0.73mi | 3/2.0 (+1) | 1,152 (-4%) | 2mo | $153,000 | $133 | 49 |
| 30 Echo Rdg | 0.43mi | 3/2.0 (+1) | 1,373 (+15%) | 0mo | $292,900 | $213 | 46 |
| 617 Richard St | 0.73mi | 2/1.0 | 1,336 (+12%) | 10mo | $75,000 | $56 | 38 |
| 1701 Tennessee Ave | 0.65mi | 3/2.0 (+1) | 1,110 (-7%) | 14mo | $169,000 | $152 | 36 |
| 1604 S Clay St | 0.70mi | 2/2.0 | 1,128 (-6%) | 21mo | $33,000 | $29 | 36 |
| 308 E 14th St | 0.59mi | 1/1.0 (-1) | 1,056 (-12%) | 19mo | $70,000 | $66 | 32 |
| 609 W 17th St W | 0.66mi | 3/2.0 (+1) | 1,350 (+13%) | 18mo | $185,000 | $137 | 24 |
Match score weights: distance 35% · size 25% · config 20% · recency 20%. Top-matched comps best support the ARV.
Projected returns pro-forma
-3.0% appreciation · 6.61% rent growth · sell at horizon
- IRR
- 31.4%
- Equity multiple
- 2.38×
- Total profit
- $23,157
- Equity at exit
- $8,946
- IRR
- 40.4%
- Equity multiple
- 5.44×
- Total profit
- $74,584
- Equity at exit
- $5,188
Cash invested: $16,800 (down + closing). Projections, not guarantees.
Landlord ↔ Tenant lean methodology
- Overall (STATE)
- 83 Strongly Landlord-Friendly
- State Kentucky
- 83 Strongly Landlord-Friendly · R+16
- County
- — inherits STATE
- City
- — inherits STATE
ZIP-level market 42240
- Home prices YoY
- -17.5%
- Rents YoY
- 6.6%
- Active inventory
- 252
- Price-to-rent
- 4.9×
Monthly cashflow live
- Estimated rent
- $1,029 high interval (Pro) →
- Mortgage (P&I)
- −$315
- Tax from tax record
- −$18 /mo · $213/yr
- Insurance
- −$25
- HOA
- −$0
- Vacancy / Maint / Mgmt
- −$216
- Net cashflow
- $456
Break-even live
UW: 25.0% down · 7.5% · 30yr · 1.5% tax · 5.0% vac · 8.0% maint · 8.0% mgmt
Financing live
Cash to close
- Down payment
- $15,000
- Closing costs
- $1,800
- Reserves months
- —
- Total cash needed
- —
Loan-product check · same deal, 3 products live
Conventional
25% down · 7.5% · 30yr
- Down + closing
- —
- Monthly P&I
- —
- Monthly cashflow
- —
- DSCR
- —
- Eligible?
- —
Personal DTI + credit; lowest rate.
DSCR
20% down · 8.5% · 30yr
- Down + closing
- —
- Monthly P&I
- —
- Monthly cashflow
- —
- DSCR
- —
- Eligible?
- —
No personal income docs; deal must DSCR.
Hard money
10% down · 12.0% · 12mo
- Down + closing
- —
- Monthly P&I
- —
- Monthly cashflow
- —
- DSCR
- —
- Eligible?
- —
Short-term bridge; refi at stabilization.
Rent comps 32 comps
| Address | Beds | Baths | Sqft | Rent | $/sqft | DOM | Units | Dist |
|---|---|---|---|---|---|---|---|---|
| 707 Sylvia St Hopkinsville, KY | 2.0 | 1.0 | 768 | $800 | $1.04 | 13d | 1 | 0.35mi |
| 117 B S Fowler Ave Unit A Hopkinsville, KY | 2.0 | 1.0 | 700 | $850 | $1.21 | 13d | 1 | 0.36mi |
| 200 E 9th St Apt 1 Hopkinsville, KY | 2.0 | 1.0 | 900 | $795 | $0.88 | 21d | 1 | 0.44mi |
| 1611 S Main St Ste 1 Hopkinsville, KY | 1.0 | 1.0 | 700 | $750 | $1.07 | 13d | 1 | 0.66mi |
| 1611 S Main St Unit 6 Hopkinsville, KY | 2.0 | 1.0 | 900 | $900 | $1.00 | 44d | 1 | 0.66mi |
| 1810 S Main St Hopkinsville, KY | 2.0 | 1.5 | 1000 | $900 | $0.90 | 21d | 1 | 0.82mi |
| 312 Twyman Sq Hopkinsville, KY | 2.0 | 1.0 | 900 | $900 | $1.00 | 44d | 1 | 0.89mi |
| 1937 High St Hopkinsville, KY | 2.0 | 1.0 | 850 | $950 | $1.12 | 44d | 1 | 0.91mi |
| 1937 High St Unit 1 Hopkinsville, KY | 2.0 | 1.0 | 850 | $950 | $1.12 | 21d | 1 | 0.91mi |
| 101 Talbert Dr Hopkinsville, KY | 2.0 | 1.0 | 900 | $950 | $1.06 | 13d | 1 | 0.92mi |
| 600 A Colonelette Dr Unit A Hopkinsville, KY | 2.0 | 2.0 | 980 | $1,050 | $1.07 | 44d | 1 | 0.92mi |
| 600 A Colonelette Dr Unit 600 Hopkinsville, KY | 2.0 | 2.0 | 980 | $1,020 | $1.04 | 44d | 1 | 0.92mi |
| 600 A Colonelette Dr Unit 600 Hopkinsville, KY | 2.0 | 2.0 | 980 | $1,020 | $1.04 | 21d | 1 | 0.92mi |
| 600 A Colonelette Dr Unit A Hopkinsville, KY | 2.0 | 2.0 | 980 | $1,020 | $1.04 | 21d | 1 | 0.92mi |
| 1935 High St Hopkinsville, KY | 2.0 | 1.0 | 850 | $850 | $1.00 | 44d | 1 | 0.93mi |
| 605 Colonette Dr Hopkinsville, KY | 3.0 | 2.0 | 1060 | $1,625 | $1.53 | 21d | 1 | 0.96mi |
| 607 Colonette Dr Hopkinsville, KY | 3.0 | 2.0 | 1060 | $1,600 | $1.51 | 44d | 1 | 0.96mi |
| 201 Thornton Ct Hopkinsville, KY | 1.0–2.0 | 1.0 | 800 | $1,000 | $1.25 | 21d | 2 | 0.98mi |
| 100 Croft St Hopkinsville, KY | 1.0–2.0 | 1.0 | 790 | $856 | $1.08 | 21d | 4 | 1.03mi |
| 1202 Cates St Hopkinsville, KY | 3.0 | 1.0 | 1000 | $995 | $0.99 | 21d | 1 | 1.07mi |
| 115 A Holley Dr Unit B Hopkinsville, KY | 3.0 | 2.0 | 1235 | $1,195 | $0.97 | 44d | 1 | 1.17mi |
| 115 A Holley Dr Unit B Hopkinsville, KY | 3.0 | 2.0 | 1235 | $1,195 | $0.97 | 21d | 1 | 1.17mi |
| 2323 S Virginia St Unit STREETA1 Hopkinsville, KY | 2.0 | 1.0 | 964 | $700 | $0.73 | 21d | 1 | 1.30mi |
| 2019 Oak St Hopkinsville, KY | 2.0 | 1.0 | 900 | $915 | $1.02 | 44d | 1 | 1.33mi |
| 836 E 21st St Unit A Hopkinsville, KY | 2.0 | 1.0 | 850 | $1,025 | $1.21 | 44d | 1 | 1.36mi |
| 601 Moores Dr Hopkinsville, KY | 3.0 | 2.0 | 1498 | $1,400 | $0.93 | 21d | 1 | 1.39mi |
| 617 Vass Ln Hopkinsville, KY | 3.0 | 2.0 | 1040 | $1,150 | $1.11 | 13d | 1 | 1.39mi |
| 1050 Denzil Dr Hopkinsville, KY | 2.0 | 1.0–2.0 | 1105 | $1,138 | $1.03 | 13d | 21 | 1.40mi |
| 1704 E 7th St Unit Na Hopkinsville, KY | 3.0 | 2.0 | 1321 | $1,550 | $1.17 | 13d | 1 | 1.42mi |
| 624 Vass Ln Hopkinsville, KY | 2.0 | 1.0 | 836 | $925 | $1.11 | 44d | 1 | 1.43mi |
| 202 Morningside Dr Hopkinsville, KY | 3.0 | 2.0 | 1188 | $1,400 | $1.18 | 21d | 1 | 1.46mi |
| 405 S Wooldridge Rd Hopkinsville, KY | 2.0 | 1.0 | 1020 | $900 | $0.88 | 21d | 1 | 1.49mi |
Listing history 19 events
-
2026-06-18days on market $60,000 Active 147 DOM
-
2026-06-17days on market $60,000 Active 146 DOM
-
2026-06-16days on market $60,000 Active 145 DOM
-
2026-06-15days on market $60,000 Active 144 DOM
-
2026-06-14days on market $60,000 Active 142 DOM
-
2026-06-13days on market $60,000 Active 141 DOM
-
2026-06-10days on market $60,000 Active 139 DOM
-
2026-06-09days on market $60,000 Active 138 DOM
-
2026-06-08days on market $60,000 Active 137 DOM
-
2026-06-07days on market $60,000 Active 136 DOM
-
2026-06-02days on market $60,000 Active 131 DOM
-
2026-06-01days on market $60,000 Active 130 DOM
-
2026-05-31days on market $60,000 Active 129 DOM
-
2026-05-30days on market $60,000 Active 128 DOM
-
2026-02-18price $60,000 803-char remark
Show marketing remark (803 chars)
Two-story home offering a renovation opportunity in close proximity to downtown. Some renovations have been started; however, the home remains unfinished and will require additional work. Seller discloses the property sustained a fire in the past. Property currently has temporary electrical service, and water service is not active. No permits were obtained for improvements. Property is being sold AS IS, WHERE IS, with no warranties or representations expressed or implied by Seller. Year built is unknown. The year shown is approximate and is not guaranteed. All information deemed reliable but not guaranteed. Buyer to verify all information, including year built, square footage, condition, zoning, permitted use, utility availability, repairs, and suitability for Buyer’s intended use.
-
2026-01-23$75,000 Active 803-char remark
Show marketing remark (803 chars)
Two-story home offering a renovation opportunity in close proximity to downtown. Some renovations have been started; however, the home remains unfinished and will require additional work. Seller discloses the property sustained a fire in the past. Property currently has temporary electrical service, and water service is not active. No permits were obtained for improvements. Property is being sold AS IS, WHERE IS, with no warranties or representations expressed or implied by Seller. Year built is unknown. The year shown is approximate and is not guaranteed. All information deemed reliable but not guaranteed. Buyer to verify all information, including year built, square footage, condition, zoning, permitted use, utility availability, repairs, and suitability for Buyer’s intended use.
-
2023-04-27soldstatus $35,000
-
2021-02-14historical 31-char remark
Show marketing remark (31 chars)
HOME IS IN NEED OF TOTAL REHAB.
-
2020-03-13$34,900 31-char remark
Show marketing remark (31 chars)
HOME IS IN NEED OF TOTAL REHAB.
ⓘ Source: listings_history table (triggers on properties + properties_extension) + one-shot
backfill from property_details.listing_events for pre-trigger history.
Tax reassessment forecast KY · Resets to sale price
- Current annual tax
- $213 · $18/mo
- Projected year-2 tax
- $516 · $43/mo
- Expected delta
- +$303/yr (+$25/mo · 142.3%)
ⓘ Screening estimate from a state-policy table — verify with the county assessor before closing.
Climate risk First Street
- Flood 3/10 Moderate FEMA zone X (unshaded) · 17% chance over 30 yrs
- Wildfire 1/10 Low
- Heat 5/10 Major 7 d/yr ≥108°F today · 21 d/yr by 30 yrs out
- Wind 3/10 Moderate 8% chance of damaging wind over 30 yrs
- Air quality 2/10 Low 0 unhealthy d/yr today · 1 by 30 yrs out
Nearby sold comps map
Loading sold comps map…
Walkable amenities ~0.75 mi
Loading nearby amenities…
Taxation est. · year 1
- Rental income
- $12,351
- − Mortgage interest
- −$3,361
- − Property taxes
- −$213
- − Insurance
- −$300
- − Repairs & maintenance
- −$988
- − Management
- −$988
- − Depreciation
- −$1,745
- Taxable income
- $4,756
- Est. tax owed @ 24.0%
- −$1,141
- After-tax cash flow
- $4,327/yr
For passive investors: Depreciation is non-cash, so a rental often shows a tax loss while cash-flowing — sheltering income. Rental losses are passive: they offset passive income freely, and up to $25,000/yr can offset ordinary (W-2) income if you actively participate and your MAGI is under $100k (phasing out to $0 by $150k); unused losses carry forward. On sale, claimed depreciation is recaptured at up to 25%, and gains may owe capital-gains tax (a 1031 exchange can defer both). Figures are a year-1 estimate at your 24.0% rate — not tax advice; consult a CPA.
Schools (NCES district)
- District
- Christian County
- NCES district ID
- 2101150
- Math proficiency
- 30% ▼ -9.00%
- Reading proficiency
- 34% ▼ -10.00%
- Median HH income
- $38,961
- Composite
- 26.8/100
- National rank
- #7118
- State rank
- #93 of 165 in KY
Livability — Hopkinsville
- Score
- 64/100
- State rank
- #305
- US rank
- #14474
Category grades
Schools grade is shown separately in the Schools card above.
Census & demographics
- Census place
- Hopkinsville, KY
- County
- Christian County · 51,080 people
- City population
- 41,415
- Metro
- Clarksville, TN-KY
- Population (ZIP)
- 41,415
- Household income
- $51,534
- Rent vs Own
- Severe rent burden
- 1475.0
Population outlook (Christian County) Hauer SSP2
- Today (2025)
- 67,861 people
- By 2030
- 65,808 · -3.0%
- By 2040
- 60,090 · -11.5%
- By 2050
- 54,561 · -19.6%
- By 2075
- 45,859 · -32.4%
- By 2100
- 38,310 · -43.5%
Race, ethnicity, and origin ACS 2023
- Neighborhood character
- Majority White (65%)
- Race & ethnicity
- White 65% Black 23% Two or more races 7% Hispanic / Latino 4%
- Common ancestry
- Slovak 3% Italian 1% Romanian 1%
- Foreign-born
- 3% · Canada
- Languages at home
- 95% English-only · Spanish 3% German/W. Germanic 1%
Political lean MEDSL · Christian
- 2024 margin
- Solid R (+33.6) · D 32.6% · R 66.1% · Other 1.3%
- 2008→2024 swing
- -12.4pp toward R · 2008: -21.2pp · 2024: -33.6pp
- All cycles
- 2024: R+33.6 2020: R+28.4 2016: R+31.4 2012: R+23.8 2008: R+21.2
Not yet ingested
- Civics
- —
Market trends
- HPI YoY
- ▼ -49.36%
- Current HPI
- 233.3958
- Rent YoY
- ▲ 6.61%
- Metro
- Clarksville, TN-KY
- State GDP YoY
- ▲ 1.81%
- F500 in state
- 4
Industry mix (Fortune 500 HQ in KY)
| Industry | F500 HQs | Revenue |
|---|---|---|
| Healthcare | 1 | $118B |
|
||
| Food / Beverage | 1 | $7B |
|
||
Price history
+71.9% since first listed5 events — show timeline
- 2026-02-18 Price Changed $60,000 REALTRACS as Distributed by MLS Grid
- 2026-01-23 Listed $75,000 REALTRACS as Distributed by MLS Grid
- 2023-04-27 Sold (Public Records) $35,000 Public Records
- 2021-02-14 Listing Removed — REALTRACS as Distributed by MLS Grid
- 2020-03-13 Listed $34,900 REALTRACS as Distributed by MLS Grid
Property tax history
+5.8%/yrLatest (2025): $213 · -4.4% YoY. Source: county tax records.
Cash-flow waterfall
monthlySold comps — $/sqft
last 12 mo · ≤1 miLoading sold comps…