2121 NE 1st Ct #105 · Boynton Beach, FL
Flood risk 1/10 · Minimal
- FEMA flood zone
- X (unshaded)
- Chance of flooding over 30 yrs
- 0.0%
- Est. flood insurance / yr
- $507 – $1,088
Fire risk 1/10 · Minimal
- Est. fire insurance / yr
- $947 – $1,759
Heat risk 10/10 · Severe
- Hot days now (above 105°F)
- 7 days/yr
- Hot days in 30 yrs
- 27 days/yr
Wind risk 10/10 · Severe
- Chance of severe wind over 30 yrs
- 99.0%
Air-quality risk 2/10 · Minimal
- Unhealthy air days now
- 1 days/yr
- Unhealthy air days in 30 yrs
- 2 days/yr
Risk factors via First Street. Map © Google.
Why this score? — see what drove the C grade
The composite is a weighted blend of 9 inputs, each scored 0–100. Each bar is that input's sub-score; the figure is the points it added to the 100-point composite (weight × sub-score).
- Cash flow +18.6/30.0
- 1% rule +10.0/10.0
- ARV discount +7.5/15.0
- DSCR +5.8/10.0
- Schools +4.3/10.0
- Livability +3.6/5.0
- Rent growth +3.4/5.0
- Condition / age +2.5/5.0
- Appreciation +0.0/10.0
$132,500
🖨 Deal sheet 📄 Offer letter ✓ Due diligence
Listing remarks
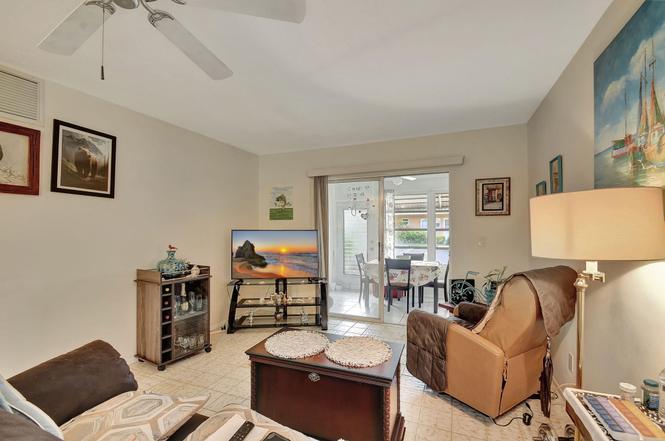
Live your best Florida life in this meticulously maintained ground-floor condo in the vibrant 55+ Village Royale Greendale community, which combines comfort and modern style. The residence is fully move-in ready and has updated engineered flooring in the bedrooms, newer appliances, and a newer air-conditioning system. The kitchen sparkles with Frigidaire appliances, granite countertops, and an eye-catching hexagonal tile backsplash. Crown molding adds architectural elegance. It is spacious, thoughtfully designed, and offers a clean, welcoming ambiance in every room. Residents enjoy a lively social scene with access to a clubhouse, pool, and shuffleboard courts. Ideally located close to shop
Key facts
- Newer appliances
- Ground-floor condo
- Granite countertops
Tags
Property features AI
Finance
- HOA & community: Monthly HOA ($602); Community amenities: clubhouse, pool, shuffleboard court, tennis courts, pickleball courts; Senior community; Pets allowed with restrictions (breed, number, size limits)
Exterior
- Parking: Assigned parking; Guest parking; 1 open parking space
- Security: Smoke detector(s)
- Utilities: Public water; Public sewer; Three-phase electric; Cable available; Water and sewer available
- Home design: Condominium; Resale; 2 total stories; Faces northeast
- Construction: Stucco and CBS construction; Composition/shingle roof
- Exterior features: Porch; Not waterfront
Interior
- Kitchen: Dishwasher; Electric range; Refrigerator
- Bedrooms: 2 bedrooms (main level)
- Flooring: Laminate
- Bathrooms: 2 full bathrooms (main level)
- Heating & cooling: Electric central heating (individual); Electric central cooling (individual)
- Interior features: Walk-in closets; Smoke detector(s)
- Laundry & utility: Laundry closet inside; Electric water heater
Neighborhood map
What this means for you Summary
Snapshot
- This is a 2-bed/2.0-bath condo listed at $132k.
Deal economics
- At list price, monthly cash flow is $128 ($2k/yr) — positive.
- The deal already cash-flows at list — no discount required.
- Meets the 1% rule at list price ($2k rent vs $132k).
- Recommended offer: $117k (12.0% below list) — sets the bar for market timing.
- Cap rate 7.5% vs local median 4.3% in Boynton Beach — top-decile yield for the area; either an underpriced asset or a hidden risk that comps aren't pricing in. Stress-test before assuming the spread holds.
Location & tenants
- Location reads 72/100 on livability (#351 in FL) — a middle-class / working-renter tenant base. Strengths: housing A+, health & safety B+, cost of living B; Watch: amenities D+, crime D-, commute F.
- Palm Beach (suburban): math 46% / reading 53% proficiency, ranked #34 of 73 in FL (top 47%) — families likely to look elsewhere, expect single-tenant / working-renter base with shorter leases.
- Market conditions: Rents rising (+3.6%/yr); 536 active listings in the ZIP; 40 comparable units currently listed for rent nearby; rentals at typical pace (median 20d on market — plan ~3-4 weeks tenant-placement turnaround); 3,974 units permitted in Palm Beach County in 2024 (1,012 in 5+ unit buildings).
- This rent runs 38% of the median local income ($68k/yr) — at the standard rent-burdened threshold; future hikes will face affordability resistance.
Forward outlook
- Local home prices are declining (-3.0%/yr); year-one equity from $916 of loan paydown is wiped out by about $4k of value loss. Plan a longer hold.
- Palm Beach County population projected at +30% by 2050 — long-run rental-demand tailwind backs the buy-and-hold thesis.
Negotiation context
- It's been on market 147 days — a 12% lower offer ($117k) is reasonable based on typical stale-listing flexibility.
- 2 sale attempts since 2y ago with the ask held roughly flat each time — persistent listings suggest the price (not the market) is what's stuck; bring a comps-based counter.
- Current owner paid $58k; list at $132k implies a 128% gain — meaningful room to come down on a strong offer.
Risks & watch-outs
- Watch-outs: HOA is 28% of rent.
- Climate carrying-cost: severe wind risk, 99% chance of damaging wind over 30y; extreme-heat days projected 7→27/yr by 2055 (HVAC capex compounding) — expect insurance premiums to compound above CPI over the hold.
Questions for the listing agent
- It's been on market 147 days. Have you received any prior offers? Is the seller open to a 12% concession, seller financing, or rate buy-down credit?
- Built in 1969 — when were the roof, HVAC, electrical panel, plumbing, and water heater last replaced?
- What does the HOA fee cover, when was the last increase, and are there any pending special assessments or reserve-fund shortfalls?
- Any open or pending special assessments — roof, HVAC, plumbing, elevator, façade? What's the per-unit balance and payoff schedule, and is the seller paying it off at close or rolling it to the buyer?
- Why hasn't it sold? Are there any deal-killer items the seller is aware of (foundation, flood, title, zoning, code violations)?
- Is there a deadline driving the sale (1031 exchange, divorce, estate, relocation)? That informs how much negotiation room exists.
- Crime grade is D in this area — have there been break-ins, vandalism, or insurance claims at this property in the last 3 years? What carrier currently insures it and at what premium?
- What's the average days-on-market for RENTAL listings here right now (not sales)? A rising rental-DOM trend means longer vacancies and softer asking-rent achievability than the comps imply.
- What's the recent tenant-quality profile in this submarket — average credit score on applications, eviction rate, late-payment / NSF rate, and stable-employment percentage? A property-management company in the area should have these aggregated.
- How much new apartment / multifamily construction is in the pipeline within 1–3 miles? Heavy new supply (>2% of stock underway) typically softens rents 12–24 months out; light construction supports rent growth.
Investment metrics
- 1% rule
- 1.61% ✓
- Cap rate
- 7.45%
- Cash-on-cash
- 4.13%
- DSCR
- 1.18
- GRM
- 5.2
CMA / ARV
No comps found within radius.
Projected returns pro-forma
-3.0% appreciation · 3.64% rent growth · sell at horizon
- IRR
- -8.3%
- Equity multiple
- 0.69×
- Total profit
- $-11,522
- Equity at exit
- $19,756
- IRR
- 2.8%
- Equity multiple
- 1.21×
- Total profit
- $7,927
- Equity at exit
- $11,456
Cash invested: $37,100 (down + closing). Projections, not guarantees.
Landlord ↔ Tenant lean methodology
- Overall (STATE)
- 87 Strongly Landlord-Friendly
- State Florida
- 87 Strongly Landlord-Friendly · R+3
- County
- — inherits STATE
- City
- — inherits STATE
ZIP-level market 33435
- Rents YoY
- 3.6%
- Active inventory
- 536
- Price-to-rent
- 5.2×
Monthly cashflow live
- Estimated rent
- $2,133 high interval (Pro) →
- Mortgage (P&I)
- −$695
- Tax from tax record
- −$205 /mo · $2,460/yr
- Insurance
- −$55
- HOA
- −$602
- Vacancy / Maint / Mgmt
- −$448
- Net cashflow
- $128
Break-even live
UW: 25.0% down · 7.5% · 30yr · 1.5% tax · 5.0% vac · 8.0% maint · 8.0% mgmt
Financing live
Cash to close
- Down payment
- $33,125
- Closing costs
- $3,975
- Reserves months
- —
- Total cash needed
- —
Loan-product check · same deal, 3 products live
Conventional
25% down · 7.5% · 30yr
- Down + closing
- —
- Monthly P&I
- —
- Monthly cashflow
- —
- DSCR
- —
- Eligible?
- —
Personal DTI + credit; lowest rate.
DSCR
20% down · 8.5% · 30yr
- Down + closing
- —
- Monthly P&I
- —
- Monthly cashflow
- —
- DSCR
- —
- Eligible?
- —
No personal income docs; deal must DSCR.
Hard money
10% down · 12.0% · 12mo
- Down + closing
- —
- Monthly P&I
- —
- Monthly cashflow
- —
- DSCR
- —
- Eligible?
- —
Short-term bridge; refi at stabilization.
Rent comps 40 comps
| Address | Beds | Baths | Sqft | Rent | $/sqft | DOM | Units | Dist |
|---|---|---|---|---|---|---|---|---|
| 108 NE 20th Ave #206 Boynton Beach, FL | 2.0 | 2.0 | 860 | $1,800 | $2.09 | 19d | 1 | 0.07mi |
| 2213 NE 1st Ct #103 Boynton Beach, FL | 1.0 | 1.5 | 624 | $1,350 | $2.16 | 24d | 1 | 0.13mi |
| 2100 N Seacrest Blvd Boynton Beach, FL | 3.0 | 1.0 | 1056 | $2,900 | $2.75 | 16d | 1 | 0.16mi |
| 2400 NE 1st Ln #206 Boynton Beach, FL | 1.0 | 1.5 | 754 | $1,800 | $2.39 | 14d | 1 | 0.26mi |
| 311 NE 17th Ave #204 Boynton Beach, FL | 2.0 | 2.0 | 1100 | $1,650 | $1.50 | 24d | 1 | 0.30mi |
| 2202 NE 3rd St Boynton Beach, FL | 3.0 | 2.0 | 902 | $3,000 | $3.33 | 16d | 1 | 0.31mi |
| 2515 NE 2nd Ct #202 Boynton Beach, FL | 2.0 | 2.0 | 960 | $1,499 | $1.56 | 24d | 1 | 0.33mi |
| 2615 NE 1st Ct Boynton Beach, FL | 2.0 | 2.0 | 960 | $1,850 | $1.93 | 18d | 2 | 0.34mi |
| 2615 NE 1st Ct #403 Boynton Beach, FL | 2.0 | 2.0 | 960 | $2,100 | $2.19 | 24d | 1 | 0.34mi |
| 410 NE 17th Ave #101 Boynton Beach, FL | 2.0 | 1.5 | 1080 | $1,500 | $1.39 | 7d | 1 | 0.35mi |
| 2601 3rd Ct NE #202 Boynton Beach, FL | 2.0 | 2.0 | 982 | $1,500 | $1.53 | 18d | 1 | 0.35mi |
| 230 NE 26th Ave #1070 Boynton Beach, FL | 1.0 | 1.5 | 754 | $1,620 | $2.15 | 10d | 1 | 0.39mi |
| 130 NE 26th Ave #307 Boynton Beach, FL | 2.0 | 2.0 | 982 | $3,500 | $3.56 | 24d | 1 | 0.39mi |
| 230 NE 26th Ave Boynton Beach, FL | 1.0–2.0 | 1.5–2.0 | 857 | $1,650 | $1.93 | 17d | 2 | 0.39mi |
| 2615 NE 3rd Ct #4030 Boynton Beach, FL | 2.0 | 2.0 | 960 | $1,699 | $1.77 | 4d | 1 | 0.40mi |
| 300 NE 26th Ave #1040 Boynton Beach, FL | 2.0 | 2.0 | 1080 | $1,559 | $1.44 | 24d | 1 | 0.40mi |
| 2202 NE 4th St #10 Boynton Beach, FL | 2.0 | 1.0 | 757 | $1,900 | $2.51 | 2d | 1 | 0.41mi |
| 330 NE 26th Ave Unit 108 Boynton Beach, FL | 1.0 | 1.5 | 754 | $1,600 | $2.12 | 2d | 1 | 0.43mi |
| 330 NE 26th Ave Unit 108 Boynton Beach, FL | 1.0 | 1.5 | 754 | $1,375 | $1.82 | 24d | 1 | 0.43mi |
| 30 Crossings Cir Unit H Boynton Beach, FL | 2.0 | 2.0 | 864 | $2,400 | $2.78 | 18d | 1 | 0.45mi |
| 27 Crossings Cir Unit H Boynton Beach, FL | 2.0 | 2.0 | 864 | $1,900 | $2.20 | 14d | 1 | 0.46mi |
| 24 Crossings Cir Unit H Boynton Beach, FL | 2.0 | 2.0 | 864 | $2,050 | $2.37 | 24d | 1 | 0.52mi |
| 17 Crossings Cir Unit E Boynton Beach, FL | 2.0 | 2.0 | 864 | $1,900 | $2.20 | 24d | 1 | 0.53mi |
| 2008 S Federal Hwy Unit C207 Boynton Beach, FL | 2.0 | 2.0 | 963 | $2,000 | $2.08 | 24d | 1 | 0.56mi |
| 14 Crossings Cir Unit E Boynton Beach, FL | 2.0 | 2.0 | 953 | $2,300 | $2.41 | 24d | 1 | 0.57mi |
| 7 Crossings Cir Boynton Beach, FL | 2.0 | 1.5 | 864 | $2,500 | $2.89 | 24d | 1 | 0.58mi |
| 4 Crossings Cir Unit B Boynton Beach, FL | 2.0 | 1.5 | 864 | $1,950 | $2.26 | 24d | 1 | 0.60mi |
| 640 Oak St Boynton Beach, FL | 2.0 | 1.0 | 765 | $2,690 | $3.52 | 7d | 1 | 0.63mi |
| 1632 N Federal Hwy Boynton Beach, FL | 1.0–3.0 | 1.0–2.0 | 1098 | $2,580 | $2.35 | 1d | 20 | 0.71mi |
| 117 Waterside Dr #117 Hypoluxo, FL | 2.0 | 2.0 | 768 | $2,000 | $2.60 | 24d | 1 | 0.73mi |
| 176 Waterside Dr Hypoluxo, FL | 3.0 | 2.0 | 1024 | $2,500 | $2.44 | 19d | 1 | 0.73mi |
| 1820 New Palm Way #201 Boynton Beach, FL | 2.0 | 2.0 | 873 | $3,500 | $4.01 | 24d | 1 | 0.74mi |
| 661 Waterside Dr Hypoluxo, FL | 2.0 | 2.0 | 768 | $2,000 | $2.60 | 24d | 1 | 0.76mi |
| 336 NE 12th Ave Boynton Beach, FL | 3.0 | 2.0 | 1040 | $2,500 | $2.40 | 7d | 1 | 0.79mi |
| 977 Miner Rd Lantana, FL | 3.0 | 1.0 | 1100 | $3,195 | $2.90 | 1d | 1 | 0.79mi |
| 1214 Highview Rd Lantana, FL | 3.0 | 2.0 | 768 | $2,300 | $2.99 | 1d | 1 | 0.82mi |
| 2700 Quantum Lakes Dr Boynton Beach, FL | 1.0–3.0 | 1.0–2.0 | 1328 | $2,325 | $1.75 | 1d | 164 | 0.87mi |
| 519 Martin Luther King Junior Blvd Unit B Boynton Beach, FL | 2.0 | 1.0 | 800 | $1,950 | $2.44 | 24d | 1 | 0.88mi |
| 525 NW 10th Ave Boynton Beach, FL | 3.0 | 1.0 | 836 | $2,300 | $2.75 | 24d | 1 | 0.88mi |
| 3265 E Palm Dr Boynton Beach, FL | 3.0 | 2.0 | 744 | $2,600 | $3.49 | 24d | 1 | 0.98mi |
HOA detail condo
- Monthly dues
- $602 · $7,224/yr
- Likely covers
- pool
- Assessments
- None detected in remarks — confirm with the listing agent.
Listing history 19 events
-
2026-06-18days on market $132,500 Active 147 DOM
-
2026-06-17days on market $132,500 Active 146 DOM
-
2026-06-16days on market $132,500 Active 145 DOM
-
2026-06-15days on market $132,500 Active 144 DOM
-
2026-06-13days on market $132,500 Active 142 DOM
-
2026-06-09days on market $132,500 Active 138 DOM
-
2026-06-07days on market $132,500 Active 136 DOM
-
2026-06-04days on market $132,500 Active 133 DOM
-
2026-06-03days on market $132,500 Active 132 DOM
-
2026-06-01days on market $132,500 Active 130 DOM
-
2026-05-31days on market $132,500 Active 129 DOM
-
2026-03-30price $132,500
-
2026-01-22$134,900 Active
-
2025-05-08historical
-
2024-11-08$134,900 Active
-
2020-07-01soldstatus $58,000
-
2004-07-20soldstatus $68,000
-
1996-09-13soldstatus $21,000
-
1993-10-12soldstatus $22,000
ⓘ Source: listings_history table (triggers on properties + properties_extension) + one-shot
backfill from property_details.listing_events for pre-trigger history.
Tax reassessment forecast FL · Resets to sale price
- Current annual tax
- $2,460 · $205/mo
- Projected year-2 tax
- $2,460 · $205/mo
- Expected delta
- $0/yr ($0/mo · 0.0%)
ⓘ Screening estimate from a state-policy table — verify with the county assessor before closing.
Climate risk First Street
- Flood 1/10 Low FEMA zone X (unshaded) · 0% chance over 30 yrs
- Wildfire 1/10 Low
- Heat 10/10 Extreme 7 d/yr ≥105°F today · 27 d/yr by 30 yrs out
- Wind 10/10 Extreme 99% chance of damaging wind over 30 yrs
- Air quality 2/10 Low 1 unhealthy d/yr today · 2 by 30 yrs out
Nearby sold comps map
Loading sold comps map…
Walkable amenities ~0.75 mi
Loading nearby amenities…
Taxation est. · year 1
- Rental income
- $25,593
- − Mortgage interest
- −$7,422
- − Property taxes
- −$2,460
- − Insurance
- −$662
- − Repairs & maintenance
- −$2,047
- − Management
- −$2,047
- − HOA
- −$7,224
- − Depreciation
- −$3,855
- Taxable loss
- −$125
- Est. tax savings @ 24.0%
- +$30
- After-tax cash flow
- $1,564/yr
For passive investors: Depreciation is non-cash, so a rental often shows a tax loss while cash-flowing — sheltering income. Rental losses are passive: they offset passive income freely, and up to $25,000/yr can offset ordinary (W-2) income if you actively participate and your MAGI is under $100k (phasing out to $0 by $150k); unused losses carry forward. On sale, claimed depreciation is recaptured at up to 25%, and gains may owe capital-gains tax (a 1031 exchange can defer both). Figures are a year-1 estimate at your 24.0% rate — not tax advice; consult a CPA.
Schools (NCES district)
- District
- Palm Beach
- NCES district ID
- 1201500
- Math proficiency
- 46% ▼ -16.00%
- Reading proficiency
- 53% ▼ -4.00%
- Median HH income
- $53,943
- Composite
- 42.72/100
- National rank
- #3160
- State rank
- #34 of 73 in FL
Livability — Boynton Beach
- Score
- 72/100
- State rank
- #351
- US rank
- #6098
Category grades
Schools grade is shown separately in the Schools card above.
Census & demographics
- Census place
- Boynton Beach, FL
- County
- Palm Beach County · 1,438,312 people
- City population
- 148,060
- Metro
- Miami-Fort Lauderdale-Pompano Beach, FL
- Population (ZIP)
- 37,833
- Household income
- $67,979
- Rent vs Own
- Severe rent burden
- 1623.0
Population outlook (Palm Beach County) Hauer SSP2
- Today (2025)
- 1,637,487 people
- By 2030
- 1,743,255 · +6.5%
- By 2040
- 1,948,712 · +19.0%
- By 2050
- 2,132,979 · +30.3%
- By 2075
- 2,530,027 · +54.5%
- By 2100
- 2,706,979 · +65.3%
Race, ethnicity, and origin ACS 2023
- Neighborhood character
- Diverse neighborhood (Simpson 0.65)
- Race & ethnicity
- White 41% Black 40% Hispanic / Latino 15% Two or more races 10%
- Hispanic origin (detail)
- Mexican 3% Puerto Rican 3% Cuban 2% Dominican 1%
- Common ancestry
- Hispanic 23% Romanian 2% Lithuanian 2%
- Foreign-born
- 30% · Canada, Jamaica
- Languages at home
- 61% English-only · French/Haitian/Cajun 24% Spanish 11% Other Indo-European 2%
Political lean MEDSL · Palm Beach
- 2024 margin
- Toss-up / Even · D 50.0% · R 49.2%
- 2008→2024 swing
- -22.1pp toward R · 2008: 22.9pp · 2024: 0.8pp
- All cycles
- 2024: D+0.8 2020: D+12.8 2016: D+15.3 2012: D+17.0 2008: D+22.9
Not yet ingested
- Civics
- —
Market trends
- HPI YoY
- ▼ -345.86%
- Current HPI
- 371.0527
- Rent YoY
- ▲ 3.64%
- Metro
- Miami-Fort Lauderdale-Pompano Beach, FL
- State GDP YoY
- ▲ 3.28%
- F500 in state
- 36
Industry mix (Fortune 500 HQ in FL)
| Industry | F500 HQs | Revenue |
|---|---|---|
| Industrial Technology | 2 | $29B |
|
||
| Insurance | 2 | $17B |
|
||
| Retail | 1 | $60B |
|
||
| Technology Distribution | 1 | $58B |
|
||
| Homebuilding | 1 | $35B |
|
||
| Technology Manufacturing | 1 | $35B |
|
||
Price history
+502.3% since first listed8 events — show timeline
- 2026-03-30 Price Changed $132,500 Beaches MLS
- 2026-01-22 Listed $134,900 Beaches MLS
- 2025-05-08 Listing Removed — Beaches MLS
- 2024-11-08 Listed $134,900 Beaches MLS
- 2020-07-01 Sold (Public Records) $58,000 Public Records
- 2004-07-20 Sold (Public Records) $68,000 Public Records
- 1996-09-13 Sold (Public Records) $21,000 Public Records
- 1993-10-12 Sold (Public Records) $22,000 Public Records
Property tax history
+8.6%/yrLatest (2025): $2,460 · +0.1% YoY. Source: county tax records.
Cash-flow waterfall
monthlySold comps — $/sqft
last 12 mo · ≤1 miLoading sold comps…