 17-Plex
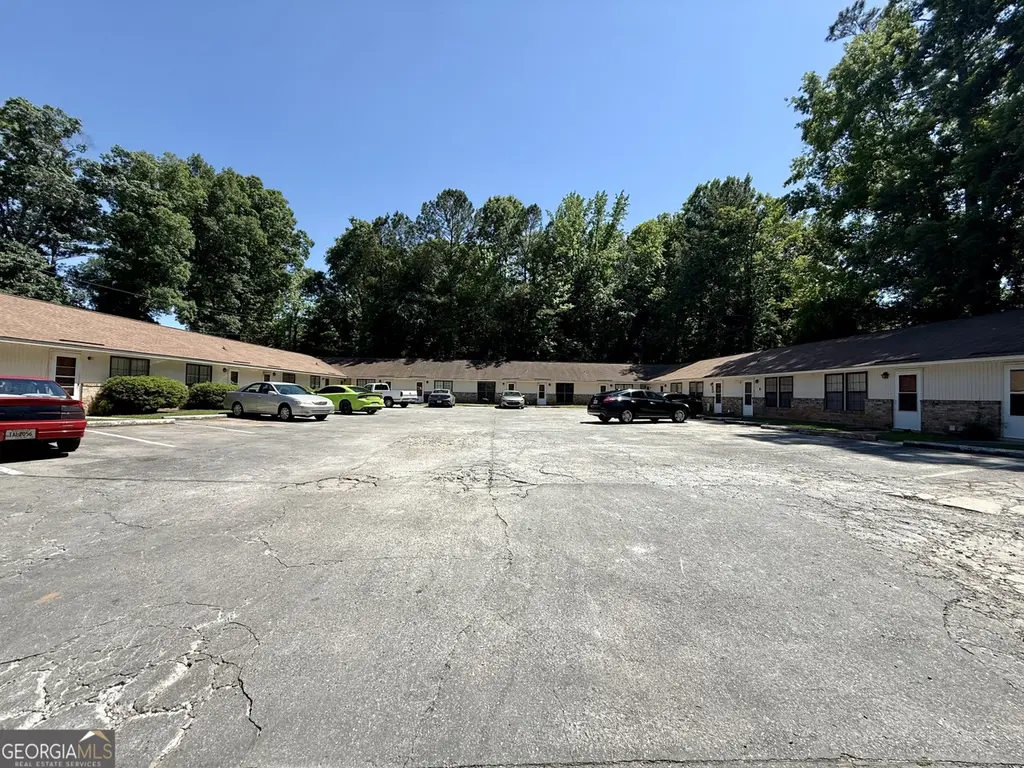
435 Shadowmoor Dr · Thomson, GA
Flood risk No data
- FEMA flood zone
- —
- Chance of flooding over 30 yrs
- —
- Est. flood insurance / yr
- —
Fire risk No data
- Est. fire insurance / yr
- —
Heat risk No data
- Hot days now (above threshold)
- —
- Hot days in 30 yrs
- —
Wind risk No data
- Chance of severe wind over 30 yrs
- —
Air-quality risk No data
- Unhealthy air days now
- —
- Unhealthy air days in 30 yrs
- —
Risk factors via First Street. Map © Google.
Why this score? — see what drove the B- grade
The composite is a weighted blend of 9 inputs, each scored 0–100. Each bar is that input's sub-score; the figure is the points it added to the 100-point composite (weight × sub-score).
- Cash flow +30.0/30.0
- DSCR +10.0/10.0
- 1% rule +8.6/10.0
- ARV discount +7.5/15.0
- Livability +3.1/5.0
- Rent growth +2.5/5.0
- Condition / age +2.2/5.0
- Schools +1.3/10.0
- Appreciation +0.0/10.0
$1,124,000
🖨 Deal sheet 📄 Offer letter ✓ Due diligence
Multi-family units
County records classify this as Multi-Family (5+ Unit). Listing-text estimate: 17 units. confirmed
5+ unit building — per-unit beds/baths from public records are typically unavailable; the breakdown below (if shown) is an estimate from the listing text.
Listing remarks
* * * Investment Opportunity: Alexandria Court Apartments - Thomson, Georgia Discover an exceptional chance to expand your real estate portfolio with Alexandria Court Apartments, a fully occupied 17-unit multifamily complex located just outside the Thomson city limits in a well-established residential area. Built in 1986, this property has been consistently maintained and is currently under professional management by Watson & Knox Property Management. The complex is 100% occupied, offering immediate, stable income for an investor seeking a turnkey asset. The listing agent also serves as the current property manager, ensuring seamless access to operational insights and performance
Key facts
- Desirable location
- Growing market
- Multifamily complex
Tags
Property features AI
Finance
- Other: Property condition: Resale
- Financial info: Reported gross income: $10,475
- HOA & community: No HOA
Exterior
- Parking: Parking pad; Open parking available
- Utilities: Public water; Public sewer; Electricity with individual meters; Sewer connected; Water billing prorated
- Home design: Residential income property; Multi-family structure; Multi-family property with 17 units
- Construction: Built in 1986
- Exterior features: Brick and wood siding construction; Approximately 0.77-acre lot
Interior
- Heating & cooling: Central heating (electric); Central air conditioning
- Interior features: One level; No basement; No fireplaces reported
Neighborhood map
What this means for you Summary
Snapshot
- This is a 17 × 1-bed/1-bath units multifamily listed at $1.12M. Condition is rated fair.
Deal economics
- At list price, monthly cash flow is $4k ($52k/yr) — positive. Per door: $254/mo.
- The deal already cash-flows at list — no discount required.
- Meets the 1% rule at list price ($15k rent vs $1.12M).
- Recommended offer: $1.11M (1.5% below list) — sets the bar for market timing.
- Cap rate 10.9% vs local median 3.8% in Thomson — top-decile yield for the area; either an underpriced asset or a hidden risk that comps aren't pricing in. Stress-test before assuming the spread holds.
Location & tenants
- Location reads 61/100 on livability (#357 in GA) — a middle-class / working-renter tenant base. Strengths: cost of living A+, housing A+; Watch: crime C-, health & safety C-, amenities F.
- Mcduffie County (rural): math 12% / reading 19% proficiency, ranked #156 of 174 in GA (top 90%) — low school quality limits family demand, transient renter base, plan for 1-2y turnover; 65% free/reduced lunch — lower-income household profile, screen leases tightly.
- Zoned schools: Thomson Elementary School (math 17% / reading 22%, grade F, #878 of 1,228 statewide, top 75%, 292 students, 90% FRL); Thomson High School (math 2% / reading 17%, grade F, #365 of 424 statewide, top 88%, 986 students, 89% FRL) — zoned schools average 89% FRL vs 65% district-wide (24 pts higher); higher-poverty schools than district average — tighter screening recommended.
- Market conditions: 191 active listings in the ZIP; 6 comparable units currently listed for rent nearby; rentals lingering (median 44d on market — plan ~5-8 weeks vacancy on turnover, expect pricing pressure); 83% of comp listings sitting > 30 days — soft ceiling on asking rent; 64 units permitted in McDuffie County in 2024 (0 in 5+ unit buildings).
Forward outlook
- Local home prices are declining (-3.0%/yr); year-one equity from $8k of loan paydown is wiped out by about $34k of value loss. Plan a longer hold.
- McDuffie County population projected at -18% by 2050 — secular population decline; favor cash flow + early exit over multi-decade hold.
- At projected returns (-3.0% appreciation + 3.0% rent growth), your $315k cash investment doubles in ~8 years — after that, you're playing with house money.
Negotiation context
- It's been on market 27 days — a 2% lower offer ($1.11M) is reasonable based on typical stale-listing flexibility.
Questions for the listing agent
- Can we see the unit-by-unit rent roll, current vacancy, and any below-market leases? What's the average tenancy length?
- What capital expenditures (roof, boiler, parking lot, exteriors) have been made in the last 5 years, and what's planned in the next 2?
- Have any recent inspections been done? Can we get a copy of the seller's disclosures and any deferred-maintenance estimates?
- Is there a deadline driving the sale (1031 exchange, divorce, estate, relocation)? That informs how much negotiation room exists.
- Schools are F-rated, which usually means shorter tenancies and higher turnover. Who's the typical renter profile here, and what's been the actual vacancy rate?
- What's the average days-on-market for RENTAL listings here right now (not sales)? A rising rental-DOM trend means longer vacancies and softer asking-rent achievability than the comps imply.
- What's the recent tenant-quality profile in this submarket — average credit score on applications, eviction rate, late-payment / NSF rate, and stable-employment percentage? A property-management company in the area should have these aggregated.
- How much new apartment / multifamily construction is in the pipeline within 1–3 miles? Heavy new supply (>2% of stock underway) typically softens rents 12–24 months out; light construction supports rent growth.
Investment metrics
- 1% rule
- 1.36% ✓
- Cap rate
- 10.91%
- Cash-on-cash
- 16.48%
- DSCR
- 1.73
- GRM
- 6.1
CMA / ARV
No comps found within radius.
Projected returns pro-forma
-3.0% appreciation · 3.0% rent growth · sell at horizon
- IRR
- 7.6%
- Equity multiple
- 1.30×
- Total profit
- $93,444
- Equity at exit
- $167,592
- IRR
- 16.9%
- Equity multiple
- 2.39×
- Total profit
- $436,864
- Equity at exit
- $97,183
Cash invested: $314,720 (down + closing). Projections, not guarantees.
Landlord ↔ Tenant lean methodology
- Overall (STATE)
- 90 Strongly Landlord-Friendly
- State Georgia
- 90 Strongly Landlord-Friendly · R+3
- County
- — inherits STATE
- City
- — inherits STATE
ZIP-level market 30824
- Home prices YoY
- -7.3%
- Active inventory
- 191
- Price-to-rent
- 104.0×
Monthly cashflow live
- Estimated rent
- $15,305 medium interval (Pro) →
- Mortgage (P&I)
- −$5,894
- Tax est. 1.5%
- −$1,405 /mo · $16,860/yr
- Insurance
- −$468
- HOA
- −$0
- Vacancy / Maint / Mgmt
- −$3,214
- Net cashflow
- $4,323
Break-even live
17-unit breakdown (identical units grouped — click to expand)
| Units | Beds | Baths | Est. rent |
|---|---|---|---|
| 17× units | 1 | 1 | $15,300 |
| #1 | 1 | 1 | $900 |
| #2 | 1 | 1 | $900 |
| #3 | 1 | 1 | $900 |
| #4 | 1 | 1 | $900 |
| #5 | 1 | 1 | $900 |
| #6 | 1 | 1 | $900 |
| #7 | 1 | 1 | $900 |
| #8 | 1 | 1 | $900 |
| #9 | 1 | 1 | $900 |
| #10 | 1 | 1 | $900 |
| #11 | 1 | 1 | $900 |
| #12 | 1 | 1 | $900 |
| #13 | 1 | 1 | $900 |
| #14 | 1 | 1 | $900 |
| #15 | 1 | 1 | $900 |
| #16 | 1 | 1 | $900 |
| #17 | 1 | 1 | $900 |
| Total (17 units) | $15,305 | ||
UW: 25.0% down · 7.5% · 30yr · 1.5% tax · 5.0% vac · 8.0% maint · 8.0% mgmt
Financing live
Cash to close
- Down payment
- $281,000
- Closing costs
- $33,720
- Reserves months
- —
- Total cash needed
- —
Loan-product check · same deal, 3 products live
Conventional
25% down · 7.5% · 30yr
- Down + closing
- —
- Monthly P&I
- —
- Monthly cashflow
- —
- DSCR
- —
- Eligible?
- —
Personal DTI + credit; lowest rate.
DSCR
20% down · 8.5% · 30yr
- Down + closing
- —
- Monthly P&I
- —
- Monthly cashflow
- —
- DSCR
- —
- Eligible?
- —
No personal income docs; deal must DSCR.
Hard money
10% down · 12.0% · 12mo
- Down + closing
- —
- Monthly P&I
- —
- Monthly cashflow
- —
- DSCR
- —
- Eligible?
- —
Short-term bridge; refi at stabilization.
Rent comps 6 comps
| Address | Beds | Baths | Sqft | Rent | $/sqft | DOM | Units | Dist |
|---|---|---|---|---|---|---|---|---|
| 464 Bussey Ave Unit B Thomson, GA | 2.0 | 1.0 | — | $825 | — | 43d | 1 | 1.04mi |
| 462 Bussey Ave Unit A Thomson, GA | 3.0 | 1.5 | — | $950 | — | 43d | 1 | 1.04mi |
| 208 Watson St Unit 11 Thomson, GA | 2.0 | 1.5 | 881 | $975 | $1.11 | 43d | 1 | 1.07mi |
| 431 Bussey Ave Thomson, GA | 3.0 | 1.5 | 1174 | $1,190 | $1.01 | 43d | 1 | 1.07mi |
| 642 Forrest Clary Dr Ext Thomson, GA | 2.0–3.0 | 1.0–1.5 | 1075 | $903 | $0.84 | 23d | 1 | 1.18mi |
| 104 White Oak St Thomson, GA | 3.0 | 1.0 | 900 | $975 | $1.08 | 43d | 1 | 1.32mi |
Listing history 17 events
-
2026-06-18days on market $1,124,000 Active 27 DOM
-
2026-06-17days on market $1,124,000 Active 26 DOM
-
2026-06-16days on market $1,124,000 Active 25 DOM
-
2026-06-15days on market $1,124,000 Active 24 DOM
-
2026-06-13days on market $1,124,000 Active 22 DOM
-
2026-06-12days on market $1,124,000 Active 21 DOM
-
2026-06-09days on market $1,124,000 Active 18 DOM
-
2026-06-08days on market $1,124,000 Active 17 DOM
-
2026-06-07days on market $1,124,000 Active 16 DOM
-
2026-06-07statusdays on market $1,124,000 Active 15 DOM
-
2026-06-04days on market $1,124,000 New 12 DOM
-
2026-06-02days on market $1,124,000 New 11 DOM
-
2026-06-01days on market $1,124,000 New 10 DOM
-
2026-05-31days on market $1,124,000 New 9 DOM
-
2026-05-31days on market $1,124,000 New 8 DOM
-
2026-05-21$1,124,000 New
-
2022-03-16price $625
ⓘ Source: listings_history table (triggers on properties + properties_extension) + one-shot
backfill from property_details.listing_events for pre-trigger history.
Nearby sold comps map
Loading sold comps map…
Walkable amenities ~0.75 mi
Loading nearby amenities…
Taxation est. · year 1
- Rental income
- $183,660
- − Mortgage interest
- −$62,961
- − Property taxes
- −$16,860
- − Insurance
- −$5,620
- − Repairs & maintenance
- −$14,693
- − Management
- −$14,693
- − Depreciation
- −$32,698
- Taxable income
- $36,135
- Est. tax owed @ 24.0%
- −$8,672
- After-tax cash flow
- $43,207/yr
For passive investors: Depreciation is non-cash, so a rental often shows a tax loss while cash-flowing — sheltering income. Rental losses are passive: they offset passive income freely, and up to $25,000/yr can offset ordinary (W-2) income if you actively participate and your MAGI is under $100k (phasing out to $0 by $150k); unused losses carry forward. On sale, claimed depreciation is recaptured at up to 25%, and gains may owe capital-gains tax (a 1031 exchange can defer both). Figures are a year-1 estimate at your 24.0% rate — not tax advice; consult a CPA.
Condition & rehab AI · 12 photos
This multi-family property requires significant repairs and updates to its exterior, interior, and systems, but presents a substantial investment opportunity with potential for substantial value appreciation.
Repairs flagged
- Major exterior siding — Significant damage and wear
- Major roof — Visible signs of deterioration
- Major flooring — Severe wear and tear
- Major interior walls/paint — Worn and discolored
- Major kitchen cabinetry — Outdated and in poor condition
- Major bathroom fixtures — Outdated and possibly moldy
- Major HVAC/mechanicals — No recent maintenance
Value-add opportunities
- Both exterior siding and roof repair — Improves curb appeal and structural integrity
- Both flooring replacement — Enhances living space and resale value
- Both paint and interior updates — Refreshes the interior and improves rental appeal
- Both kitchen and bathroom updates — Modernizes the spaces and boosts value
- Both HVAC and mechanical upgrades — Ensures comfort and energy efficiency
Renovation cost estimate screening
| Repair item | Severity | Est. cost |
|---|---|---|
| exterior siding · Significant damage and wear | Major | $15,000–50,000 |
| roof · Visible signs of deterioration | Major | $15,000–50,000 |
| flooring · Severe wear and tear | Major | $15,000–50,000 |
| interior walls/paint · Worn and discolored | Major | $15,000–50,000 |
| kitchen cabinetry · Outdated and in poor condition | Major | $15,000–50,000 |
| bathroom fixtures · Outdated and possibly moldy | Major | $15,000–50,000 |
| HVAC/mechanicals · No recent maintenance | Major | $15,000–50,000 |
| Total estimated repair cost · 7 items | $105,000–350,000 |
Value-add ROI direction
- Both exterior siding and roof repair — Improves curb appeal and structural integrity ↑
- Both flooring replacement — Enhances living space and resale value ↑
- Both paint and interior updates — Refreshes the interior and improves rental appeal ↑
- Both kitchen and bathroom updates — Modernizes the spaces and boosts value ↑
- Both HVAC and mechanical upgrades — Ensures comfort and energy efficiency ↑
ⓘ Cost ranges are severity-bucket heuristics (US national rule-of-thumb). Get contractor quotes + a written scope before underwriting a rehab budget.
Schools (NCES district)
- District
- Mcduffie County
- NCES district ID
- 1303570
- Math proficiency
- 12% ▼ -15.00%
- Reading proficiency
- 19% ▼ -8.00%
- Median HH income
- $37,658
- Composite
- 12.98/100
- National rank
- #9570
- State rank
- #156 of 174 in GA
Livability — Thomson
- Score
- 61/100
- State rank
- #357
- US rank
- #18372
Category grades
Schools grade is shown separately in the Schools card above.
Census & demographics
- Population (ZIP)
- 17,181
Population outlook (McDuffie County) Hauer SSP2
- Today (2025)
- 20,590 people
- By 2030
- 19,922 · -3.2%
- By 2040
- 18,451 · -10.4%
- By 2050
- 16,898 · -17.9%
- By 2075
- 13,647 · -33.7%
- By 2100
- 10,421 · -49.4%
Race, ethnicity, and origin ACS 2023
- Neighborhood character
- Diverse neighborhood (Simpson 0.56)
- Race & ethnicity
- White 49% Black 46% Hispanic / Latino 4% Two or more races 2%
- Common ancestry
- Lithuanian 2% Italian 1% Slovak 1%
- Foreign-born
- 2% · Canada
- Languages at home
- 97% English-only · Spanish 2%
Political lean MEDSL · McDuffie
- 2024 margin
- Strong R (+24.9) · D 37.4% · R 62.3%
- 2008→2024 swing
- -10.0pp toward R · 2008: -14.9pp · 2024: -24.9pp
- All cycles
- 2024: R+24.9 2020: R+19.1 2016: R+18.7 2012: R+15.0 2008: R+14.9
Not yet ingested
- Civics
- —
Market trends
- HPI YoY
- ▼ -19.21%
- Current HPI
- 243.7734
- Rent YoY
- —
- Metro
- —
- State GDP YoY
- ▲ 2.66%
- F500 in state
- 28
Industry mix (Fortune 500 HQ in GA)
| Industry | F500 HQs | Revenue |
|---|---|---|
| Paper / Packaging | 2 | $29B |
|
||
| Retail | 1 | $160B |
|
||
| Transportation / Logistics | 1 | $91B |
|
||
| Airlines | 1 | $62B |
|
||
| Consumer Goods | 1 | $47B |
|
||
| Utilities | 1 | $25B |
|
||
Price history
2 events — show timeline
- 2026-05-21 Listed $1,124,000 GAMLS
- 2022-03-16 Price Changed $625 RENT.
Cash-flow waterfall
monthlySold comps — $/sqft
last 12 mo · ≤1 miLoading sold comps…