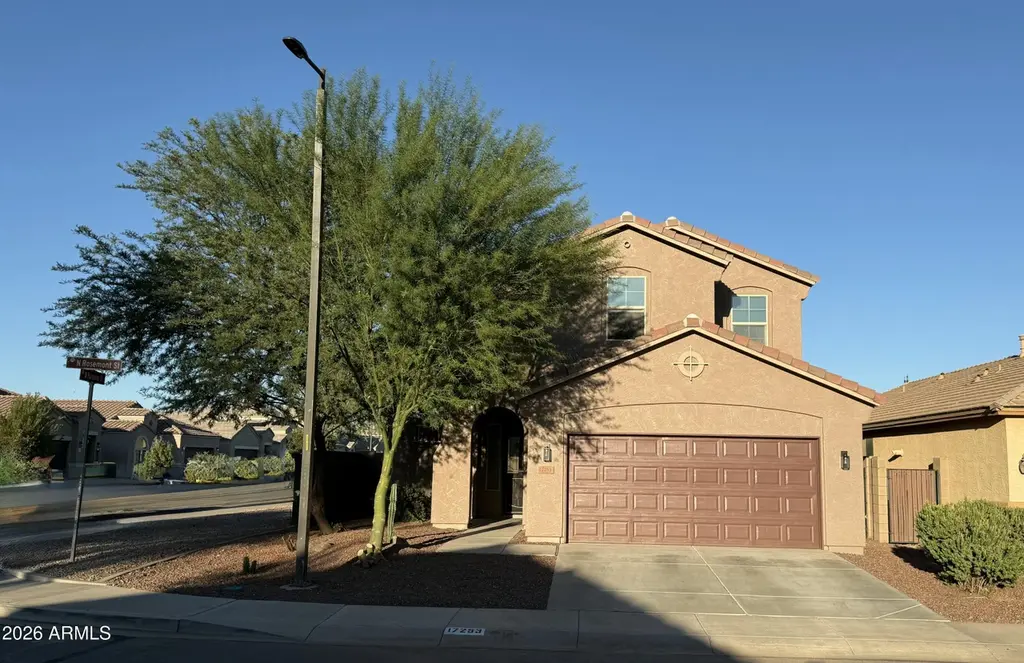
17253 N Rosemont St · Maricopa, AZ
Flood risk 5/10 · Moderate
- FEMA flood zone
- X (shaded)
- Chance of flooding over 30 yrs
- 0.6%
- Est. flood insurance / yr
- $507 – $1,088
Fire risk 7/10 · Major
- Est. fire insurance / yr
- $610 – $1,132
Heat risk 9/10 · Severe
- Hot days now (above 114°F)
- 7 days/yr
- Hot days in 30 yrs
- 19 days/yr
Wind risk 1/10 · Minimal
- Chance of severe wind over 30 yrs
- —
Air-quality risk 2/10 · Minimal
- Unhealthy air days now
- 1 days/yr
- Unhealthy air days in 30 yrs
- 1 days/yr
Risk factors via First Street. Map © Google.
Why this score? — see what drove the D- grade
The composite is a weighted blend of 9 inputs, each scored 0–100. Each bar is that input's sub-score; the figure is the points it added to the 100-point composite (weight × sub-score).
- ARV discount +12.8/15.0
- Cash flow +7.3/30.0
- Appreciation +4.6/10.0
- Livability +3.6/5.0
- Rent growth +2.9/5.0
- Condition / age +2.5/5.0
- Schools +2.3/10.0
- 1% rule +1.5/10.0
- DSCR +1.5/10.0
$350,000
🖨 Deal sheet 📄 Offer letter ✓ Due diligence
Listing remarks MLS
I'm wild about this one!! With a full price offer, seller is willing to contribute toward buyers' closing costs. Refreshed & move-in ready!! Desirable 5 bedroom, 3 bathroom home features a main-level bedroom, efficiency of solar, all fresh interior/exterior paint, new flooring throughout, and upgraded landscaping. Located on a premium corner lot with generous outdoor space and convenient access to everyday shopping & dining. This home offers both space and an attractive location in one package!! Must see!! 3.75% VA LOAN IS ASSUMABLE!!
Key facts
- 5,061 sq ft lot
- 2 garage spots
- Built 2014
Neighborhood map
What this means for you Summary
Snapshot
- This is a 5-bed/3.0-bath single-family listed at $350k.
Deal economics
- At list price, monthly cash flow is $-468 ($-6k/yr) — negative.
- To cash-flow at today's rent, offer at most $267k (23.6% below list).
- To meet the 1% rule (rent ≥ 1% of price), the offer needs to be $228k (34.9% below list).
- Recommended offer: $228k (34.9% below list) — sets the bar for 1% rule.
- Cap rate 4.7% vs local median 3.7% in Maricopa — meaningfully above typical; check what's discounted (condition, days-on-market, listing class) to confirm the premium yield is real.
Location & tenants
- Location reads 72/100 on livability (#28 in AZ) — a middle-class / working-renter tenant base. Strengths: housing A+, employment A-, crime B+; Watch: amenities F, commute F, health & safety F.
- Maricopa Unified School District (4441) (town): math 20% / reading 29% proficiency, ranked #128 of 249 in AZ (top 51%) — low school quality limits family demand, transient renter base, plan for 1-2y turnover.
- Market conditions: Rents rising (+1.8%/yr); 845 active listings in the ZIP; 15 comparable units currently listed for rent nearby; rentals at typical pace (median 17d on market — plan ~3-4 weeks tenant-placement turnaround); 40% of comp listings sitting > 30 days — soft ceiling on asking rent; solid renter incomes; 9,504 units permitted in Pinal County in 2024 (776 in 5+ unit buildings).
Forward outlook
- Local home prices are declining (-0.9%/yr); year-one equity from $2k of loan paydown is wiped out by about $3k of value loss. Plan a longer hold.
Negotiation context
- Only 1 days on market — expect competitive offers; lowballing is unlikely to land.
- 4 sale attempts since 12y ago; this cycle's ask has dropped $30k (8%) from the opening price — seller is motivated, your offer sets the floor, not the list.
- Current owner paid $176k; list at $350k implies a 98% gain — meaningful room to come down on a strong offer.
Risks & watch-outs
- Climate carrying-cost: moderate flood risk; major wildfire risk; extreme-heat days projected 7→19/yr by 2055 (HVAC capex compounding) — expect insurance premiums to compound above CPI over the hold.
Questions for the listing agent
- What do current leases actually rent for vs. the listed asking? Can we see a recent rent roll and the last 12 months of T-12 income?
- What does the HOA fee cover, when was the last increase, and are there any pending special assessments or reserve-fund shortfalls?
- Is there a deadline driving the sale (1031 exchange, divorce, estate, relocation)? That informs how much negotiation room exists.
- Schools are B-rated — typically a magnet for longer-tenancy family renters. What's the average tenant stay here, and is there a school-zone premium baked into asking?
- The area grade is low — what's the realistic commute time and amenity access for the typical tenant pool here? Any planned neighborhood developments (good or bad) we should know about?
- What's the average days-on-market for RENTAL listings here right now (not sales)? A rising rental-DOM trend means longer vacancies and softer asking-rent achievability than the comps imply.
- What's the recent tenant-quality profile in this submarket — average credit score on applications, eviction rate, late-payment / NSF rate, and stable-employment percentage? A property-management company in the area should have these aggregated.
- How much new for-sale + rental construction is in the pipeline within 1–3 miles? Heavy new supply typically softens prices + rents 12–24 months out; constrained supply supports both.
Investment metrics
- 1% rule
- 0.65% ✗
- Cap rate
- 4.69%
- Cash-on-cash
- -5.73%
- DSCR
- 0.75
- GRM
- 12.8
CMA / ARV
- ARV (median comp)
- $396,583
- List price
- $350,000
- Delta
- -11.75%
- Verdict
- UNDERPRICED
- Comps
- 20 within 1.0 mi
Show comp detail 12 sales within ~0.75 mi
| Address | Dist | Beds/Ba | Sqft | Sold | Price | $/sf | Match |
|---|---|---|---|---|---|---|---|
| 42017 W Rosa Dr | 0.38mi | 5/3.0 | 2,099 (-7%) | 2mo | $339,000 | $162 | 69 |
| 42165 W Ramona St | 0.12mi | 4/2.5 (-1) | 2,571 (+14%) | 1mo | $375,000 | $146 | 64 |
| 43010 W Palo Amarillo Rd | 0.45mi | 4/2.5 (-1) | 2,389 (+6%) | 1mo | $367,990 | $154 | 62 |
| 18382 N Arbor Dr | 0.75mi | 4/3.0 (-1) | 2,250 (-0%) | 0mo | $340,000 | $151 | 59 |
| 41779 W Mano Pl | 0.30mi | 4/3.0 (-1) | 2,528 (+12%) | 6mo | $425,000 | $168 | 57 |
| 42895 W Peters Dr | 0.71mi | 4/3.0 (-1) | 2,197 (-3%) | 3mo | $329,990 | $150 | 55 |
| 42490 W Krista Dr | 0.39mi | 4/3.0 (-1) | 1,977 (-13%) | 1mo | $360,000 | $182 | 55 |
| 42835 W Peters Dr | 0.68mi | 4/3.0 (-1) | 2,197 (-3%) | 6mo | $329,990 | $150 | 53 |
| 42945 W Peters Dr | 0.74mi | 4/3.0 (-1) | 2,197 (-3%) | 3mo | $329,990 | $150 | 53 |
| 42895 W Palo Amarillo Rd | 0.55mi | 4/2.5 (-1) | 2,389 (+6%) | 6mo | $359,990 | $151 | 53 |
| 42860 W Peters Dr | 0.68mi | 4/2.5 (-1) | 2,197 (-3%) | 5mo | $336,990 | $153 | 53 |
| 42960 W Palo Amarillo Rd | 0.59mi | 4/2.0 (-1) | 2,143 (-5%) | 6mo | $333,690 | $156 | 50 |
Match score weights: distance 35% · size 25% · config 20% · recency 20%. Top-matched comps best support the ARV.
Projected returns pro-forma
-0.89% appreciation · 1.78% rent growth · sell at horizon
- IRR
- -13.6%
- Equity multiple
- 0.42×
- Total profit
- $-57,202
- Equity at exit
- $86,376
- IRR
- -7.9%
- Equity multiple
- 0.29×
- Total profit
- $-69,135
- Equity at exit
- $92,322
Cash invested: $98,000 (down + closing). Projections, not guarantees.
Landlord ↔ Tenant lean methodology
- Overall (STATE)
- 87 Strongly Landlord-Friendly
- State Arizona
- 87 Strongly Landlord-Friendly · R+3
- County
- — inherits STATE
- City
- — inherits STATE
ZIP-level market 85138
- Home prices YoY
- -0.3%
- Rents YoY
- 1.8%
- Active inventory
- 845
- Price-to-rent
- 12.8×
Monthly cashflow live
- Estimated rent
- $2,277 high interval (Pro) →
- Mortgage (P&I)
- −$1,835
- Tax from tax record
- −$205 /mo · $2,466/yr
- Insurance
- −$146
- HOA
- −$80
- Vacancy / Maint / Mgmt
- −$478
- Net cashflow
- $-468
Break-even live
UW: 25.0% down · 7.5% · 30yr · 1.5% tax · 5.0% vac · 8.0% maint · 8.0% mgmt
Financing live
Cash to close
- Down payment
- $87,500
- Closing costs
- $10,500
- Reserves months
- —
- Total cash needed
- —
Loan-product check · same deal, 3 products live
Conventional
25% down · 7.5% · 30yr
- Down + closing
- —
- Monthly P&I
- —
- Monthly cashflow
- —
- DSCR
- —
- Eligible?
- —
Personal DTI + credit; lowest rate.
DSCR
20% down · 8.5% · 30yr
- Down + closing
- —
- Monthly P&I
- —
- Monthly cashflow
- —
- DSCR
- —
- Eligible?
- —
No personal income docs; deal must DSCR.
Hard money
10% down · 12.0% · 12mo
- Down + closing
- —
- Monthly P&I
- —
- Monthly cashflow
- —
- DSCR
- —
- Eligible?
- —
Short-term bridge; refi at stabilization.
Rent comps 15 comps
| Address | Beds | Baths | Sqft | Rent | $/sqft | DOM | Units | Dist |
|---|---|---|---|---|---|---|---|---|
| 42275 W Calle St Maricopa, AZ | 4.0 | 3.0 | 1807 | $2,050 | $1.13 | 43d | 1 | 0.22mi |
| 42275 W Calle St Maricopa, AZ | 4.0 | 3.0 | 1807 | $2,050 | $1.13 | 3d | 1 | 0.22mi |
| 16635 N Lunar St Maricopa, AZ | 5.0 | 3.0 | 2082 | $2,100 | $1.01 | 1d | 1 | 0.41mi |
| 41261 W Laramie Rd Maricopa, AZ | 4.0 | 2.5 | 2691 | $1,895 | $0.70 | 12d | 1 | 0.77mi |
| 18175 N Cook Dr Maricopa, AZ | 5.0 | 3.5 | 3133 | $2,100 | $0.67 | 2d | 1 | 0.83mi |
| 18426 N Lariat Rd Maricopa, AZ | 4.0 | 2.5 | 2567 | $1,995 | $0.78 | 43d | 1 | 0.86mi |
| 43760 W Cypress Ln Maricopa, AZ | 4.0 | 2.0 | 2142 | $2,000 | $0.93 | 43d | 1 | 1.24mi |
| 43814 W Cypress Ln Maricopa, AZ | 4.0 | 2.0 | 2170 | $2,095 | $0.97 | 43d | 1 | 1.27mi |
| 19053 N Wilson St Unit 1545785P Maricopa, AZ | 5.0 | 3.0 | 3239 | $4,438 | $1.37 | 16d | 1 | 1.28mi |
| 43371 W Elizabeth Ave Maricopa, AZ | 4.0 | 2.5 | 2274 | $1,739 | $0.76 | 43d | 1 | 1.29mi |
| 18967 N Leland Rd Maricopa, AZ | 4.0 | 2.5 | 2275 | $1,000 | $0.44 | 4d | 1 | 1.31mi |
| 43194 W Jeremy St Maricopa, AZ | 4.0 | 2.5 | 2424 | $1,699 | $0.70 | 43d | 1 | 1.34mi |
| 40086 W Bonneau St Maricopa, AZ | 4.0 | 2.0 | 1878 | $1,729 | $0.92 | 16d | 1 | 1.43mi |
| 43250 W Estrada St Maricopa, AZ | 4.0 | 2.0 | 2349 | $1,950 | $0.83 | 24d | 1 | 1.45mi |
| 19488 N Falcon Ln Maricopa, AZ | 4.0 | 3.0 | 1836 | $2,300 | $1.25 | 11d | 1 | 1.46mi |
HOA detail
- Monthly dues
- $80 · $960/yr
- Likely covers
- landscaping
Listing history 24 events
-
2026-06-17days on market $350,000 Active 1 DOM
-
2026-06-13days on market $350,000 Active 108 DOM
-
2026-06-13days on market $350,000 Active 107 DOM
-
2026-06-09days on market $350,000 Active 104 DOM
-
2026-06-08days on market $350,000 Active 103 DOM
-
2026-06-07days on market $350,000 Active 102 DOM
-
2026-06-04days on market $350,000 Active 99 DOM
-
2026-06-03days on market $350,000 Active 98 DOM
-
2026-06-02days on market $350,000 Active 97 DOM
-
2026-06-01days on market $350,000 Active 96 DOM
-
2026-05-31days on market $350,000 Active 95 DOM
-
2026-05-11price $350,000 554-char remark
Show marketing remark (554 chars)
I'm wild about this one!! With a full price offer, seller is willing to contribute toward buyers' closing costs. Refreshed & move-in ready!! Desirable 5 bedroom, 3 bathroom home features a main-level bedroom, efficiency of solar, all fresh interior/exterior paint, new flooring throughout, and upgraded landscaping. Located on a premium corner lot with generous outdoor space and convenient access to everyday shopping & dining. This home offers both space and an attractive location in one package!! Must see!! 3.75% VA LOAN IS ASSUMABLE!!
-
2026-04-09price $365,000 554-char remark
Show marketing remark (554 chars)
I'm wild about this one!! With a full price offer, seller is willing to contribute toward buyers' closing costs. Refreshed & move-in ready!! Desirable 5 bedroom, 3 bathroom home features a main-level bedroom, efficiency of solar, all fresh interior/exterior paint, new flooring throughout, and upgraded landscaping. Located on a premium corner lot with generous outdoor space and convenient access to everyday shopping & dining. This home offers both space and an attractive location in one package!! Must see!! 3.75% VA LOAN IS ASSUMABLE!!
-
2026-02-25$380,000 Active 554-char remark
Show marketing remark (554 chars)
I'm wild about this one!! With a full price offer, seller is willing to contribute toward buyers' closing costs. Refreshed & move-in ready!! Desirable 5 bedroom, 3 bathroom home features a main-level bedroom, efficiency of solar, all fresh interior/exterior paint, new flooring throughout, and upgraded landscaping. Located on a premium corner lot with generous outdoor space and convenient access to everyday shopping & dining. This home offers both space and an attractive location in one package!! Must see!! 3.75% VA LOAN IS ASSUMABLE!!
-
2025-11-20historical
-
2025-11-20$400,000 Active
-
2015-12-02soldstatus $176,450 Closed
-
2015-10-04historical Under Contract Accepting Backups
-
2015-06-22$176,450 Active
-
2015-03-03historical
-
2015-01-16price $196,000
-
2014-12-11price $196,450
-
2014-12-11price $189,450
-
2014-09-03$191,345 Active
ⓘ Source: listings_history table (triggers on properties + properties_extension) + one-shot
backfill from property_details.listing_events for pre-trigger history.
Tax reassessment forecast AZ · Resets to sale price
- Current annual tax
- $2,466 · $205/mo
- Projected year-2 tax
- $2,466 · $205/mo
- Expected delta
- $0/yr ($0/mo · 0.0%)
ⓘ Screening estimate from a state-policy table — verify with the county assessor before closing.
Climate risk First Street
- Flood 5/10 Major FEMA zone X (shaded) · 60% chance over 30 yrs
- Wildfire 7/10 Severe
- Heat 9/10 Extreme 7 d/yr ≥114°F today · 19 d/yr by 30 yrs out
- Wind 1/10 Low
- Air quality 2/10 Low 1 unhealthy d/yr today · 1 by 30 yrs out
Nearby sold comps map
Loading sold comps map…
Walkable amenities ~0.75 mi
Loading nearby amenities…
Taxation est. · year 1
- Rental income
- $27,323
- − Mortgage interest
- −$19,605
- − Property taxes
- −$2,466
- − Insurance
- −$1,750
- − Repairs & maintenance
- −$2,186
- − Management
- −$2,186
- − HOA
- −$960
- − Depreciation
- −$10,182
- Taxable loss
- −$12,011
- Est. tax savings @ 24.0%
- +$2,883
- After-tax cash flow
- $-2,733/yr
For passive investors: Depreciation is non-cash, so a rental often shows a tax loss while cash-flowing — sheltering income. Rental losses are passive: they offset passive income freely, and up to $25,000/yr can offset ordinary (W-2) income if you actively participate and your MAGI is under $100k (phasing out to $0 by $150k); unused losses carry forward. On sale, claimed depreciation is recaptured at up to 25%, and gains may owe capital-gains tax (a 1031 exchange can defer both). Figures are a year-1 estimate at your 24.0% rate — not tax advice; consult a CPA.
Schools (NCES district)
- District
- Maricopa Unified School District (4441)
- NCES district ID
- 0404720
- Math proficiency
- 20% ▼ -18.00%
- Reading proficiency
- 29% ▼ -9.00%
- Median HH income
- $63,725
- Composite
- 22.92/100
- National rank
- #7993
- State rank
- #128 of 249 in AZ
Livability — Maricopa
- Score
- 72/100
- State rank
- #28
- US rank
- #5943
Category grades
Schools grade is shown separately in the Schools card above.
Census & demographics
- Census place
- Maricopa, AZ
- County
- Pinal County · 399,947 people
- City population
- 76,044
- Metro
- Phoenix-Mesa-Chandler, AZ
- Population (ZIP)
- 55,260
- Household income
- $95,867
- Rent vs Own
- Severe rent burden
- 432.0
Population outlook (Pinal County) Hauer SSP2
- Today (2025)
- 437,574 people
- By 2030
- 446,903 · +2.1%
- By 2040
- 452,589 · +3.4%
- By 2050
- 444,126 · +1.5%
- By 2075
- 430,300 · -1.7%
- By 2100
- 393,536 · -10.1%
Race, ethnicity, and origin ACS 2023
- Neighborhood character
- Diverse neighborhood (Simpson 0.69)
- Race & ethnicity
- White 45% Hispanic / Latino 30% Two or more races 17% Black 13% Native American 3% Asian 3% Pacific Islander 1%
- Hispanic origin (detail)
- Mexican 26% Puerto Rican 1%
- Common ancestry
- Lithuanian 2% Romanian 2% Italian 2%
- Foreign-born
- 10% · Canada
- Languages at home
- 79% English-only · Spanish 16% Other Asian/Pacific 1% Other Indo-European 1%
Political lean MEDSL · Pinal
- 2024 margin
- Strong R (+22.1) · D 38.5% · R 60.6%
- 2008→2024 swing
- -7.6pp toward R · 2008: -14.5pp · 2024: -22.1pp
- All cycles
- 2024: R+22.1 2020: R+17.3 2016: R+19.3 2012: R+17.1 2008: R+14.5
Not yet ingested
- Civics
- —
Market trends
- HPI YoY
- ▼ -0.89%
- Current HPI
- 258.1461
- Rent YoY
- ▲ 1.78%
- Metro
- Phoenix-Mesa-Chandler, AZ
- State GDP YoY
- ▲ 4.54%
- F500 in state
- 20
Industry mix (Fortune 500 HQ in AZ)
| Industry | F500 HQs | Revenue |
|---|---|---|
| Technology | 2 | $13B |
|
||
| Mining / Metals | 1 | $23B |
|
||
| Environmental Services | 1 | $16B |
|
||
| Metals / Steel | 1 | $14B |
|
||
| Technology Distribution | 1 | $9B |
|
||
| Homebuilding | 1 | $8B |
|
||
Price history
+82.9% since first listed13 events — show timeline
- 2026-05-11 Price Changed $350,000 ARMLS
- 2026-04-09 Price Changed $365,000 ARMLS
- 2026-02-25 Listed $380,000 ARMLS
- 2025-11-20 Listing Removed — ARMLS
- 2025-11-20 Listed $400,000 ARMLS
- 2015-12-02 Sold (MLS) $176,450 ARMLS
- 2015-10-04 Contingent — ARMLS
- 2015-06-22 Listed $176,450 ARMLS
- 2015-03-03 Listing Removed — ARMLS
- 2015-01-16 Price Changed $196,000 ARMLS
- 2014-12-11 Price Changed $189,450 ARMLS
- 2014-12-11 Price Changed $196,450 ARMLS
- 2014-09-03 Listed $191,345 ARMLS
Property tax history
+19.3%/yrLatest (2025): $2,466 · +3.6% YoY. Source: county tax records.
Cash-flow waterfall
monthlySold comps — $/sqft
last 12 mo · ≤1 miLoading sold comps…