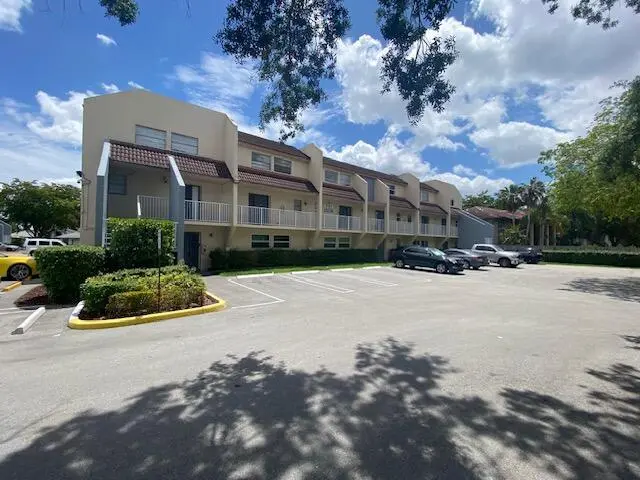
3751 NW 115th Ave Unit 4-3 · Coral Springs, FL
Flood risk 1/10 · Minimal
- FEMA flood zone
- X (shaded)
- Chance of flooding over 30 yrs
- 0.0%
- Est. flood insurance / yr
- $507 – $1,088
Fire risk 6/10 · Moderate
- Est. fire insurance / yr
- $947 – $1,759
Heat risk 9/10 · Severe
- Hot days now (above 107°F)
- 7 days/yr
- Hot days in 30 yrs
- 26 days/yr
Wind risk 10/10 · Severe
- Chance of severe wind over 30 yrs
- 99.0%
Air-quality risk 2/10 · Minimal
- Unhealthy air days now
- 2 days/yr
- Unhealthy air days in 30 yrs
- 2 days/yr
Risk factors via First Street. Map © Google.
Why this score? — see what drove the D grade
The composite is a weighted blend of 9 inputs, each scored 0–100. Each bar is that input's sub-score; the figure is the points it added to the 100-point composite (weight × sub-score).
- Cash flow +9.7/30.0
- 1% rule +8.6/10.0
- ARV discount +7.5/15.0
- Schools +4.1/10.0
- Livability +4.0/5.0
- DSCR +2.7/10.0
- Rent growth +2.5/5.0
- Condition / age +2.5/5.0
- Appreciation +0.0/10.0
$189,900
🖨 Deal sheet 📄 Offer letter ✓ Due diligence
Listing remarks
3 BEDROOM 2.5 BATH INCOME PRODUCING PROPERTY IN DESIRABLE CORAL SPRINGS. 2023 IMPACT WINDOWS AND SLIDING GLASS DOOR. FIRST FLOOR FEATURES LARGE LIVING AREA, DINING ROOM, KITCHEN, DEN/OFFICE AND A 1/2 BATH. UPSTAIRS FEATURES 3 BEDROOMS AND 2 FULL BATHS. MASTER BEDROOM OFFERS WALK IN CLOSET AND PARTIALLY RENOVATED BATH. WASHER/DRYER HOOK UP. CORAL SPRINGS ESTATE TOWNHOMES IS LOCATED NEXT TO CASTLEWOOD PARK. INVESTORS WELCOME. NO RENTAL RESTRICTION. LONG TERM TENANT IS MONTH TO MONTH PAYING $2400. NOTE: UNIT 4 ENTRANCE IS LOCATED ON THE 2ND FLOOR
Key facts
- Large living area
- Kitchen
- Sliding glass door
Tags
Property features AI
Finance
- HOA & community: Community pool; Monthly association fee (paid monthly); Association fee includes insurance, grounds maintenance, sewer, trash, and water; Association: CORAL SPRINGS ESTATE TOWNHOMES; Pets allowed with possible restrictions
Exterior
- Parking: Assigned parking; Guest parking; 1 parking space
- Utilities: Public water; Public sewer; Electric service with circuit breakers; Cable available; Electricity connected; Sewer connected; Water connected
- Home design: Condominium; Two levels; Three-story building; Faces west; Resale property
- Construction: Concrete block with stucco and stucco exterior; Mixed and tile roof; Built with other materials
- Exterior features: No waterfront; Entry on level 2
Interior
- Kitchen: Dishwasher; Electric range; Refrigerator
- Bedrooms: No main level bedrooms (units are on upper levels)
- Flooring: Laminate flooring; Tile flooring
- Bathrooms: 2 full bathrooms and 1 half bathroom (3 total); One main level bathroom
- Heating & cooling: Central heating; Central air; Ceiling fans
- Interior features: Walk-in closets; Storm windows
- Laundry & utility: Washer hookup in unit; Laundry located in kitchen
Neighborhood map
What this means for you Summary
Snapshot
- This is a 3-bed/3.0-bath condo listed at $190k.
Deal economics
- At list price, monthly cash flow is $-126 ($-2k/yr) — negative.
- To cash-flow at today's rent, offer at most $168k (11.7% below list).
- Meets the 1% rule at list price ($3k rent vs $190k).
- Recommended offer: $168k (11.7% below list) — sets the bar for cash-flow.
- Cap rate 5.5% vs local median 3.6% in Coral Springs — top-decile yield for the area; either an underpriced asset or a hidden risk that comps aren't pricing in. Stress-test before assuming the spread holds.
Location & tenants
- Location reads 79/100 on livability (#145 in FL, #2,163 nationally) — a middle-class / working-renter tenant base. Strengths: housing A+, health & safety A+, crime A; Watch: amenities F, cost of living F.
- Broward (suburban): math 42% / reading 53% proficiency, ranked #46 of 73 in FL (top 63%) — families likely to look elsewhere, expect single-tenant / working-renter base with shorter leases.
- Zoned schools: Coral Springs Elementary School (math 25% / reading 31%, grade F, #1,951 of 2,144 statewide, top 91%, 466 students, 85% FRL); Coral Springs Middle School (math 46% / reading 53%, grade C, #259 of 571 statewide, top 46%, 1,003 students, 54% FRL); Coral Glades High School (math 24% / reading 46%, grade F, #379 of 667 statewide, top 58%, 2,762 students, 58% FRL).
- Market conditions: Rents soft (-0.0%/yr); 365 active listings in the ZIP; 40 comparable units currently listed for rent nearby; rentals at typical pace (median 21d on market — plan ~3-4 weeks tenant-placement turnaround); 2,111 units permitted in Broward County in 2024 (1,265 in 5+ unit buildings).
- This rent runs 42% of the median local income ($74k/yr) — at the standard rent-burdened threshold; future hikes will face affordability resistance.
Forward outlook
- Local home prices are declining (-3.0%/yr); year-one equity from $1k of loan paydown is wiped out by about $6k of value loss. Plan a longer hold.
- Broward County population projected at +34% by 2050 — long-run rental-demand tailwind backs the buy-and-hold thesis.
Negotiation context
- It's been on market 52 days — a 3% lower offer ($184k) is reasonable based on typical stale-listing flexibility.
- 4 sale attempts since 2y ago with the ask held roughly flat each time — persistent listings suggest the price (not the market) is what's stuck; bring a comps-based counter.
- Current owner paid $133k; 43% above their basis — modest negotiation headroom, anchor on the comps not their cost.
Risks & watch-outs
- Watch-outs: HOA is 29% of rent.
- Climate carrying-cost: severe wind risk, 99% chance of damaging wind over 30y; major wildfire risk; extreme-heat days projected 7→26/yr by 2055 (HVAC capex compounding) — expect insurance premiums to compound above CPI over the hold.
Questions for the listing agent
- What do current leases actually rent for vs. the listed asking? Can we see a recent rent roll and the last 12 months of T-12 income?
- It's been on market 52 days. Have you received any prior offers? Is the seller open to a 12% concession, seller financing, or rate buy-down credit?
- Built in 1975 — when were the roof, HVAC, electrical panel, plumbing, and water heater last replaced?
- What does the HOA fee cover, when was the last increase, and are there any pending special assessments or reserve-fund shortfalls?
- Any open or pending special assessments — roof, HVAC, plumbing, elevator, façade? What's the per-unit balance and payoff schedule, and is the seller paying it off at close or rolling it to the buyer?
- Is there a deadline driving the sale (1031 exchange, divorce, estate, relocation)? That informs how much negotiation room exists.
- Schools are A-rated — typically a magnet for longer-tenancy family renters. What's the average tenant stay here, and is there a school-zone premium baked into asking?
- The area grade is low — what's the realistic commute time and amenity access for the typical tenant pool here? Any planned neighborhood developments (good or bad) we should know about?
- What's the average days-on-market for RENTAL listings here right now (not sales)? A rising rental-DOM trend means longer vacancies and softer asking-rent achievability than the comps imply.
- What's the recent tenant-quality profile in this submarket — average credit score on applications, eviction rate, late-payment / NSF rate, and stable-employment percentage? A property-management company in the area should have these aggregated.
- How much new apartment / multifamily construction is in the pipeline within 1–3 miles? Heavy new supply (>2% of stock underway) typically softens rents 12–24 months out; light construction supports rent growth.
Investment metrics
- 1% rule
- 1.36% ✓
- Cap rate
- 5.50%
- Cash-on-cash
- -2.83%
- DSCR
- 0.87
- GRM
- 6.1
CMA / ARV
No comps found within radius.
Projected returns pro-forma
-3.0% appreciation · 0.0% rent growth · sell at horizon
- IRR
- -26.6%
- Equity multiple
- 0.14×
- Total profit
- $-45,793
- Equity at exit
- $28,315
- IRR
- -59.0%
- Equity multiple
- -0.45×
- Total profit
- $-77,207
- Equity at exit
- $16,419
Cash invested: $53,172 (down + closing). Projections, not guarantees.
Landlord ↔ Tenant lean methodology
- Overall (STATE)
- 87 Strongly Landlord-Friendly
- State Florida
- 87 Strongly Landlord-Friendly · R+3
- County
- — inherits STATE
- City
- — inherits STATE
ZIP-level market 33065
- Home prices YoY
- -22.0%
- Rents YoY
- -0.0%
- Active inventory
- 365
- Price-to-rent
- 6.1×
Monthly cashflow live
- Estimated rent
- $2,590 high interval (Pro) →
- Mortgage (P&I)
- −$996
- Tax from tax record
- −$347 /mo · $4,164/yr
- Insurance
- −$79
- HOA
- −$750
- Vacancy / Maint / Mgmt
- −$544
- Net cashflow
- $-126
Break-even live
UW: 25.0% down · 7.5% · 30yr · 1.5% tax · 5.0% vac · 8.0% maint · 8.0% mgmt
Financing live
Cash to close
- Down payment
- $47,475
- Closing costs
- $5,697
- Reserves months
- —
- Total cash needed
- —
Loan-product check · same deal, 3 products live
Conventional
25% down · 7.5% · 30yr
- Down + closing
- —
- Monthly P&I
- —
- Monthly cashflow
- —
- DSCR
- —
- Eligible?
- —
Personal DTI + credit; lowest rate.
DSCR
20% down · 8.5% · 30yr
- Down + closing
- —
- Monthly P&I
- —
- Monthly cashflow
- —
- DSCR
- —
- Eligible?
- —
No personal income docs; deal must DSCR.
Hard money
10% down · 12.0% · 12mo
- Down + closing
- —
- Monthly P&I
- —
- Monthly cashflow
- —
- DSCR
- —
- Eligible?
- —
Short-term bridge; refi at stabilization.
Rent comps 40 comps
| Address | Beds | Baths | Sqft | Rent | $/sqft | DOM | Units | Dist |
|---|---|---|---|---|---|---|---|---|
| 3750 NW 115th Ave Unit 6 Coral Springs, FL | 3.0 | 2.5 | 1440 | $2,100 | $1.46 | 24d | 1 | 0.05mi |
| 11640 NW 39th St #8 Coral Springs, FL | 3.0 | 2.5 | 1300 | $2,500 | $1.92 | 24d | 1 | 0.10mi |
| 11511 NW 36th St Coral Springs, FL | 3.0 | 2.0 | 1510 | $2,800 | $1.85 | 24d | 1 | 0.13mi |
| 11461 NW 38th St Coral Springs, FL | 3.0 | 2.0 | 1800 | $2,800 | $1.56 | 24d | 1 | 0.13mi |
| 11627 NW 35th Ct Coral Springs, FL | 3.0 | 2.0 | 1100 | $2,700 | $2.45 | 24d | 1 | 0.14mi |
| 3525 NW 114th Ln Coral Springs, FL | 2.0 | 2.0 | 1032 | $2,200 | $2.13 | 13d | 1 | 0.19mi |
| 3731 NW 114th Ave Coral Springs, FL | 3.0 | 2.0 | 1609 | $3,380 | $2.10 | 17d | 1 | 0.19mi |
| 3500 NW 116th Ter Unit 3500 Coral Springs, FL | 2.0 | 2.0 | 1000 | $1,945 | $1.95 | 7d | 1 | 0.21mi |
| 3500 NW 116th Ter Unit 3500 Coral Springs, FL | 2.0 | 2.0 | 1000 | $1,945 | $1.95 | 16d | 1 | 0.21mi |
| 11403 NW 35th St Coral Springs, FL | 3.0 | 2.0 | 1217 | $2,200 | $1.81 | 19d | 1 | 0.28mi |
| 11403 NW 35th St Coral Springs, FL | 3.0 | 2.0 | 1217 | $2,200 | $1.81 | 24d | 1 | 0.28mi |
| 4053 NW 114th Ave Unit 4053 Coral Springs, FL | 3.0 | 2.0 | 1100 | $2,200 | $2.00 | 1d | 1 | 0.36mi |
| 4104 NW 114th Ave Coral Springs, FL | 2.0 | 2.0 | 979 | $2,250 | $2.30 | 24d | 1 | 0.39mi |
| 11576 NW 42nd St #11576 Coral Springs, FL | 3.0 | 2.0 | 1058 | $2,500 | $2.36 | 1d | 1 | 0.42mi |
| 11575 NW 42nd St Coral Springs, FL | 3.0 | 2.0 | 1058 | $1,950 | $1.84 | 24d | 1 | 0.43mi |
| 3255 Coral Ridge Dr #3255 Coral Springs, FL | 3.0 | 2.0 | 966 | $1,900 | $1.97 | 2d | 1 | 0.46mi |
| 3211 Coral Ridge Dr #3211 Coral Springs, FL | 3.0 | 2.0 | 966 | $2,000 | $2.07 | 7d | 1 | 0.46mi |
| 3255 Coral Ridge Dr #3255 Coral Springs, FL | 3.0 | 2.0 | 966 | $1,900 | $1.97 | 17d | 1 | 0.46mi |
| 4260 NW 114th Ter #60 Coral Springs, FL | 3.0 | 2.5 | 1600 | $2,990 | $1.87 | 5d | 1 | 0.47mi |
| 4170 NW 114th Ave Unit 4174 Coral Springs, FL | 2.0 | 2.0 | 1151 | $1,809 | $1.57 | 24d | 1 | 0.47mi |
| 3165 NW 116th Ave Unit 3165 Coral Springs, FL | 3.0 | 2.0 | 1696 | $3,500 | $2.06 | 24d | 1 | 0.47mi |
| 12000 W Sample Rd Coral Springs, FL | 1.0–3.0 | 1.0–2.0 | 1202 | $2,938 | $2.44 | 1d | 36 | 0.48mi |
| 3134 Coral Ridge Dr #3136 Coral Springs, FL | 3.0 | 2.5 | 1250 | $3,000 | $2.40 | 10d | 1 | 0.49mi |
| 4315 NW 115th Ave Coral Springs, FL | 3.0 | 2.5 | 1650 | $3,200 | $1.94 | 10d | 1 | 0.49mi |
| 11461 NW 43rd St Unit A Coral Springs, FL | 2.0 | 1.5 | 1091 | $2,250 | $2.06 | 24d | 1 | 0.49mi |
| 11150 W Sample Rd #50 Coral Springs, FL | 3.0 | 2.0 | 1080 | $2,400 | $2.22 | 24d | 1 | 0.50mi |
| 3912 NW 110th Ave Coral Springs, FL | 3.0 | 2.0 | 1200 | $2,500 | $2.08 | 14d | 1 | 0.51mi |
| 3139 Coral Ridge Dr #3139 Coral Springs, FL | 2.0 | 2.0 | 980 | $2,100 | $2.14 | 24d | 1 | 0.53mi |
| 3129 Coral Ridge Dr #3129 Coral Springs, FL | 2.0 | 2.0 | 980 | $1,950 | $1.99 | 24d | 1 | 0.53mi |
| 3135 Coral Ridge Dr #3135 Coral Springs, FL | 2.0 | 2.5 | 1100 | $2,000 | $1.82 | 21d | 1 | 0.53mi |
| 3117 Coral Ridge Dr #3117 Coral Springs, FL | 2.0 | 2.5 | 1150 | $2,000 | $1.74 | 24d | 1 | 0.55mi |
| 4100 NW 110th Ave Unit S Coral Springs, FL | 3.0 | 2.0 | 1800 | $3,450 | $1.92 | 7d | 1 | 0.59mi |
| 11543 NW 44th St #2 Coral Springs, FL | 3.0 | 2.5 | 1742 | $2,590 | $1.49 | 3d | 1 | 0.59mi |
| 11282 NW 44th St Coral Springs, FL | 4.0 | 2.0 | 1874 | $4,500 | $2.40 | 20d | 1 | 0.59mi |
| 11282 NW 44th St Coral Springs, FL | 4.0 | 2.0 | 1874 | $4,500 | $2.40 | 24d | 1 | 0.59mi |
| 11680 NW 45th St Coral Springs, FL | 2.0 | 2.0 | 900 | $2,000 | $2.22 | 24d | 1 | 0.61mi |
| 11569 NW 45th St Unit 11569-A2 Westmount Coral Springs, FL | 2.0 | 2.0 | 1155 | $1,776 | $1.54 | 10d | 1 | 0.64mi |
| 11235 NW 43rd Pl Coral Springs, FL | 4.0 | 2.0 | 1826 | $4,075 | $2.23 | 1d | 1 | 0.65mi |
| 11604 NW 29th Ct Unit 2C Coral Springs, FL | 2.0 | 1.5 | 1100 | $1,790 | $1.63 | 24d | 1 | 0.67mi |
| 11606 NW 29th St Unit 1A Coral Springs, FL | 2.0 | 1.5 | 1100 | $1,750 | $1.59 | 5d | 1 | 0.70mi |
HOA detail condo
- Monthly dues
- $750 · $9,000/yr
- Assessments
- None detected in remarks — confirm with the listing agent.
Listing history 23 events
-
2026-06-18days on market $189,900 Active 52 DOM
-
2026-06-17days on market $189,900 Active 51 DOM
-
2026-06-16days on market $189,900 Active 50 DOM
-
2026-06-15days on market $189,900 Active 49 DOM
-
2026-06-13days on market $189,900 Active 47 DOM
-
2026-06-09days on market $189,900 Active 43 DOM
-
2026-06-08days on market $189,900 Active 42 DOM
-
2026-06-07days on market $189,900 Active 41 DOM
-
2026-06-04days on market $189,900 Active 38 DOM
-
2026-06-03days on market $189,900 Active 37 DOM
-
2026-06-02days on market $189,900 Active 36 DOM
-
2026-06-01days on market $189,900 Active 35 DOM
-
2026-05-31days on market $189,900 Active 34 DOM
-
2026-04-27$189,900 Active
-
2025-06-30historical
-
2025-04-17$239,999 Active
-
2024-03-27historical $2,400
-
2024-02-22price $2,400
-
2024-02-14$2,500
-
2024-01-29historical $2,500
-
2024-01-08$2,500
-
2020-10-27soldstatus $133,000
-
2004-09-01soldstatus $154,900
ⓘ Source: listings_history table (triggers on properties + properties_extension) + one-shot
backfill from property_details.listing_events for pre-trigger history.
Tax reassessment forecast FL · Resets to sale price
- Current annual tax
- $4,164 · $347/mo
- Projected year-2 tax
- $4,164 · $347/mo
- Expected delta
- $0/yr ($0/mo · 0.0%)
ⓘ Screening estimate from a state-policy table — verify with the county assessor before closing.
Climate risk First Street
- Flood 1/10 Low FEMA zone X (shaded) · 0% chance over 30 yrs
- Wildfire 6/10 Major
- Heat 9/10 Extreme 7 d/yr ≥107°F today · 26 d/yr by 30 yrs out
- Wind 10/10 Extreme 99% chance of damaging wind over 30 yrs
- Air quality 2/10 Low 2 unhealthy d/yr today · 2 by 30 yrs out
Nearby sold comps map
Loading sold comps map…
Walkable amenities ~0.75 mi
Loading nearby amenities…
Taxation est. · year 1
- Rental income
- $31,085
- − Mortgage interest
- −$10,637
- − Property taxes
- −$4,164
- − Insurance
- −$950
- − Repairs & maintenance
- −$2,487
- − Management
- −$2,487
- − HOA
- −$9,000
- − Depreciation
- −$5,524
- Taxable loss
- −$4,164
- Est. tax savings @ 24.0%
- +$999
- After-tax cash flow
- $-507/yr
For passive investors: Depreciation is non-cash, so a rental often shows a tax loss while cash-flowing — sheltering income. Rental losses are passive: they offset passive income freely, and up to $25,000/yr can offset ordinary (W-2) income if you actively participate and your MAGI is under $100k (phasing out to $0 by $150k); unused losses carry forward. On sale, claimed depreciation is recaptured at up to 25%, and gains may owe capital-gains tax (a 1031 exchange can defer both). Figures are a year-1 estimate at your 24.0% rate — not tax advice; consult a CPA.
Schools (NCES district)
- District
- Broward
- NCES district ID
- 1200180
- Math proficiency
- 42% ▼ -18.00%
- Reading proficiency
- 53% ▼ -5.00%
- Median HH income
- $52,139
- Composite
- 40.88/100
- National rank
- #3621
- State rank
- #46 of 73 in FL
Livability — Coral Springs
- Score
- 79/100
- State rank
- #145
- US rank
- #2163
Category grades
Schools grade is shown separately in the Schools card above.
Census & demographics
- Census place
- Coral Springs, FL
- County
- Broward County · 1,963,430 people
- City population
- 101,171
- Metro
- Miami-Fort Lauderdale-Pompano Beach, FL
- Population (ZIP)
- 58,916
- Household income
- $74,226
- Rent vs Own
- Severe rent burden
- 3488.0
Population outlook (Broward County) Hauer SSP2
- Today (2025)
- 2,207,033 people
- By 2030
- 2,360,704 · +7.0%
- By 2040
- 2,661,208 · +20.6%
- By 2050
- 2,946,698 · +33.5%
- By 2075
- 3,602,273 · +63.2%
- By 2100
- 3,970,984 · +79.9%
Race, ethnicity, and origin ACS 2023
- Neighborhood character
- Highly diverse neighborhood (Simpson 0.72)
- Race & ethnicity
- Hispanic / Latino 33% White 30% Black 28% Two or more races 21% Asian 3%
- Hispanic origin (detail)
- Mexican 4% Puerto Rican 5% Cuban 2% Dominican 3%
- Common ancestry
- Hispanic 9% Romanian 2% Estonian 1%
- Foreign-born
- 35% · Canada, Jamaica, China
- Languages at home
- 61% English-only · Spanish 26% French/Haitian/Cajun 8% Other Indo-European 3%
Political lean MEDSL · Broward
- 2024 margin
- D (+17.0) · D 58.0% · R 41.0%
- 2008→2024 swing
- -17.8pp toward R · 2008: 34.7pp · 2024: 17.0pp
- All cycles
- 2024: D+17.0 2020: D+29.8 2016: D+35.0 2012: D+34.9 2008: D+34.7
Not yet ingested
- Civics
- —
Market trends
- HPI YoY
- ▼ -113.43%
- Current HPI
- 402.3476
- Rent YoY
- ▬ -0.03%
- Metro
- Miami-Fort Lauderdale-Pompano Beach, FL
- State GDP YoY
- ▲ 3.28%
- F500 in state
- 36
Industry mix (Fortune 500 HQ in FL)
| Industry | F500 HQs | Revenue |
|---|---|---|
| Industrial Technology | 2 | $29B |
|
||
| Insurance | 2 | $17B |
|
||
| Retail | 1 | $60B |
|
||
| Technology Distribution | 1 | $58B |
|
||
| Homebuilding | 1 | $35B |
|
||
| Technology Manufacturing | 1 | $35B |
|
||
Price history
+22.6% since first listed10 events — show timeline
- 2026-04-27 Listed $189,900 Beaches MLS
- 2025-06-30 Listing Removed — Stellar MLS as Distributed by MLS Grid
- 2025-04-17 Listed $239,999 Stellar MLS as Distributed by MLS Grid
- 2024-03-27 Rental Removed $2,400 MARMLS
- 2024-02-22 Price Changed $2,400 MARMLS
- 2024-02-14 Listed for Rent $2,500 MARMLS
- 2024-01-29 Rental Removed $2,500 MARMLS
- 2024-01-08 Listed for Rent $2,500 MARMLS
- 2020-10-27 Sold (Public Records) $133,000 Public Records
- 2004-09-01 Sold (Public Records) $154,900 Public Records
Property tax history
+15.6%/yrLatest (2025): $4,164 · +3.1% YoY. Source: county tax records.
Cash-flow waterfall
monthlySold comps — $/sqft
last 12 mo · ≤1 miLoading sold comps…