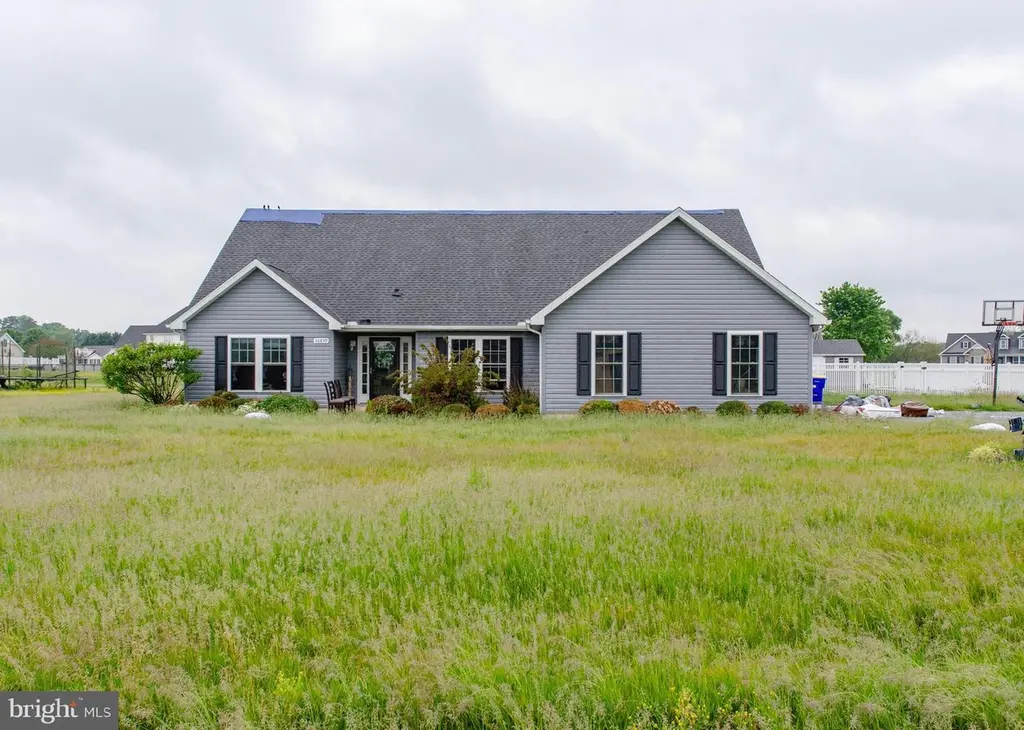
36839 Red Berry Rd · Delmar, DE
Flood risk 5/10 · Moderate
- FEMA flood zone
- X (unshaded)
- Chance of flooding over 30 yrs
- 0.67%
- Est. flood insurance / yr
- $473 – $860
Fire risk 1/10 · Minimal
- Est. fire insurance / yr
- $476 – $884
Heat risk 8/10 · Major
- Hot days now (above 106°F)
- 7 days/yr
- Hot days in 30 yrs
- 16 days/yr
Wind risk 8/10 · Major
- Chance of severe wind over 30 yrs
- 80.0%
Air-quality risk 3/10 · Minor
- Unhealthy air days now
- 2 days/yr
- Unhealthy air days in 30 yrs
- 2 days/yr
Risk factors via First Street. Map © Google.
Why this score? — see what drove the B+ grade
The composite is a weighted blend of 9 inputs, each scored 0–100. Each bar is that input's sub-score; the figure is the points it added to the 100-point composite (weight × sub-score).
- Cash flow +26.5/30.0
- ARV discount +15.0/15.0
- Appreciation +10.0/10.0
- DSCR +9.1/10.0
- 1% rule +6.4/10.0
- Livability +3.1/5.0
- Rent growth +2.5/5.0
- Schools +2.5/10.0
- Condition / age +2.5/5.0
$185,000
🖨 Deal sheet 📄 Offer letter ✓ Due diligence
Listing remarks MLS
Quaint Community in desirable Delmar School District. Interior lot w/ no builder tie in. Some restrictions apply.
Key facts
- Access to shopping
- Spacious lot
- Local amenities
Tags
Property features AI
Finance
- HOA & community: HOA fee approximately $8 monthly
Exterior
- Parking: Attached side-entry garage with 2 spaces; Driveway parking
- Utilities: Public water; No septic system (public sewer); Electric service for heating, cooling, and hot water
- Home design: Detached structure; Frame construction with aluminum siding; Crawl space foundation; Above-grade and below-grade structures noted; Year built estimated
- Construction: Frame and aluminum siding construction; Crawl space foundation
- Exterior features: Personal pool; Lot approximately 160 x 225 (estimated); Not in a federal flood zone; Outside city limits
Interior
- Bedrooms: Three bedrooms on the main level
- Bathrooms: Two full bathrooms on the main level; Two full bathrooms total
- Heating & cooling: Forced air heating (electric); Central air conditioning (electric); Electric hot water
- Interior features: Estimated living area; No basement
Neighborhood map
What this means for you Summary
Snapshot
- This is a 3-bed/3.0-bath single-family listed at $185k.
Deal economics
- At list price, monthly cash flow is $492 ($6k/yr) — positive.
- The deal already cash-flows at list — no discount required.
- Meets the 1% rule at list price ($2k rent vs $185k).
- Cap rate 9.5% vs local median 3.1% in Delmar — top-decile yield for the area; either an underpriced asset or a hidden risk that comps aren't pricing in. Stress-test before assuming the spread holds.
Location & tenants
- Location reads 62/100 on livability (#63 in DE) — a middle-class / working-renter tenant base. Strengths: cost of living A+, housing A+, health & safety A+; Watch: schools D+, crime F, amenities F.
- Delmar School District (suburban): math 20% / reading 38% proficiency, ranked #17 of 26 in DE (top 65%) — low school quality limits family demand, transient renter base, plan for 1-2y turnover.
- Market conditions: 41 active listings in the ZIP; 1 comparable units currently listed for rent nearby; 4,354 units permitted in Sussex County in 2024 (344 in 5+ unit buildings).
Forward outlook
- In year one you build about $20k of equity ($1k loan paydown + $18k appreciation (10.0% local appreciation)).
- Sussex County population projected at +25% by 2050 — long-run rental-demand tailwind backs the buy-and-hold thesis.
- At projected returns (10.0% appreciation + 3.0% rent growth), your $52k cash investment doubles in ~2 years — after that, you're playing with house money.
- By year 2, paydown + projected appreciation supports a ~$32k cash-out refi (75% LTV) — recoverable capital for the next deal without selling this one.
Negotiation context
- Only 14 days on market — expect competitive offers; lowballing is unlikely to land.
- 3 sale attempts since 12y ago with the ask held roughly flat each time — persistent listings suggest the price (not the market) is what's stuck; bring a comps-based counter.
- Current owner paid $52k; list at $185k implies a 256% gain — meaningful room to come down on a strong offer.
Risks & watch-outs
- Climate carrying-cost: moderate flood risk; severe wind risk, 80% chance of damaging wind over 30y; extreme-heat days projected 7→16/yr by 2055 (HVAC capex compounding) — expect insurance premiums to compound above CPI over the hold.
Questions for the listing agent
- What does the HOA fee cover, when was the last increase, and are there any pending special assessments or reserve-fund shortfalls?
- Is there a deadline driving the sale (1031 exchange, divorce, estate, relocation)? That informs how much negotiation room exists.
- Schools are D-rated, which usually means shorter tenancies and higher turnover. Who's the typical renter profile here, and what's been the actual vacancy rate?
- Crime grade is F in this area — have there been break-ins, vandalism, or insurance claims at this property in the last 3 years? What carrier currently insures it and at what premium?
- What's the average days-on-market for RENTAL listings here right now (not sales)? A rising rental-DOM trend means longer vacancies and softer asking-rent achievability than the comps imply.
- What's the recent tenant-quality profile in this submarket — average credit score on applications, eviction rate, late-payment / NSF rate, and stable-employment percentage? A property-management company in the area should have these aggregated.
- How much new for-sale + rental construction is in the pipeline within 1–3 miles? Heavy new supply typically softens prices + rents 12–24 months out; constrained supply supports both.
Investment metrics
- 1% rule
- 1.14% ✓
- Cap rate
- 9.48%
- Cash-on-cash
- 11.40%
- DSCR
- 1.51
- GRM
- 7.3
CMA / ARV
- ARV (median comp)
- $358,147
- List price
- $185,000
- Delta
- -65.10%
- Verdict
- UNDERPRICED
- Comps
- 8 within 1.0 mi
Show comp detail 1 sale within ~0.75 mi
| Address | Dist | Beds/Ba | Sqft | Sold | Price | $/sf | Match |
|---|---|---|---|---|---|---|---|
| 36809 Red Berry Rd | 0.12mi | 4/3.0 (+1) | 1,734 (-4%) | 6mo | $425,000 | $245 | 78 |
Match score weights: distance 35% · size 25% · config 20% · recency 20%. Top-matched comps best support the ARV.
Projected returns pro-forma
10.0% appreciation · 3.0% rent growth · sell at horizon
- IRR
- 32.6%
- Equity multiple
- 3.55×
- Total profit
- $132,048
- Equity at exit
- $166,663
- IRR
- 28.2%
- Equity multiple
- 8.03×
- Total profit
- $364,150
- Equity at exit
- $359,414
Cash invested: $51,800 (down + closing). Projections, not guarantees.
Landlord ↔ Tenant lean methodology
- Overall (STATE)
- 70 Landlord-Friendly
- State Delaware
- 70 Landlord-Friendly · D+7
- County
- — inherits STATE
- City
- — inherits STATE
ZIP-level market 19940
- Home prices YoY
- 6.2%
- Active inventory
- 41
- Price-to-rent
- 7.3×
Monthly cashflow live
- Estimated rent
- $2,100 medium interval (Pro) →
- Mortgage (P&I)
- −$970
- Tax from tax record
- −$112 /mo · $1,342/yr
- Insurance
- −$77
- HOA
- −$8
- Vacancy / Maint / Mgmt
- −$441
- Net cashflow
- $492
Break-even live
UW: 25.0% down · 7.5% · 30yr · 1.5% tax · 5.0% vac · 8.0% maint · 8.0% mgmt
Financing live
Cash to close
- Down payment
- $46,250
- Closing costs
- $5,550
- Reserves months
- —
- Total cash needed
- —
Loan-product check · same deal, 3 products live
Conventional
25% down · 7.5% · 30yr
- Down + closing
- —
- Monthly P&I
- —
- Monthly cashflow
- —
- DSCR
- —
- Eligible?
- —
Personal DTI + credit; lowest rate.
DSCR
20% down · 8.5% · 30yr
- Down + closing
- —
- Monthly P&I
- —
- Monthly cashflow
- —
- DSCR
- —
- Eligible?
- —
No personal income docs; deal must DSCR.
Hard money
10% down · 12.0% · 12mo
- Down + closing
- —
- Monthly P&I
- —
- Monthly cashflow
- —
- DSCR
- —
- Eligible?
- —
Short-term bridge; refi at stabilization.
Rent comps 1 comps
| Address | Beds | Baths | Sqft | Rent | $/sqft | DOM | Units | Dist |
|---|---|---|---|---|---|---|---|---|
| 34905 Gordy Rd Laurel, DE | 3.0 | 2.0 | 2100 | $2,100 | $1.00 | 20d | 1 | 1.08mi |
HOA detail
- Monthly dues
- $8 · $96/yr
Listing history 17 events
-
2026-06-18days on market $185,000 Active 14 DOM
-
2026-06-17days on market $185,000 Active 13 DOM
-
2026-06-16days on market $185,000 Active 12 DOM
-
2026-06-15days on market $185,000 Active 11 DOM
-
2026-06-14days on market $185,000 Active 9 DOM
-
2026-06-13days on market $185,000 Active 8 DOM
-
2026-06-10days on market $185,000 Active 6 DOM
-
2026-06-09days on market $185,000 Active 5 DOM
-
2026-06-08days on market $185,000 Active 4 DOM
-
2026-06-07pricedays on market $185,000 Active 3 DOM
-
2026-06-01days on market $125,000 Active 17 DOM
-
2026-05-31days on market $125,000 Active 16 DOM
-
2026-05-30days on market $125,000 Active 15 DOM
-
2026-05-15$125,000 Active 1011-char remark
-
2014-09-26soldstatus $52,000 113-char remark
Show marketing remark (113 chars)
Quaint Community in desirable Delmar School District. Interior lot w/ no builder tie in. Some restrictions apply.
-
2014-08-01$52,000 113-char remark
Show marketing remark (113 chars)
Quaint Community in desirable Delmar School District. Interior lot w/ no builder tie in. Some restrictions apply.
-
2014-08-01historical 113-char remark
Show marketing remark (113 chars)
Quaint Community in desirable Delmar School District. Interior lot w/ no builder tie in. Some restrictions apply.
ⓘ Source: listings_history table (triggers on properties + properties_extension) + one-shot
backfill from property_details.listing_events for pre-trigger history.
Tax reassessment forecast DE · Partial reset (capped growth)
- Current annual tax
- $1,342 · $112/mo
- Projected year-2 tax
- $1,342 · $112/mo
- Expected delta
- $0/yr ($0/mo · 0.0%)
ⓘ Screening estimate from a state-policy table — verify with the county assessor before closing.
Climate risk First Street
- Flood 5/10 Major FEMA zone X (unshaded) · 67% chance over 30 yrs
- Wildfire 1/10 Low
- Heat 8/10 Severe 7 d/yr ≥106°F today · 16 d/yr by 30 yrs out
- Wind 8/10 Severe 80% chance of damaging wind over 30 yrs
- Air quality 3/10 Moderate 2 unhealthy d/yr today · 2 by 30 yrs out
Nearby sold comps map
Loading sold comps map…
Walkable amenities ~0.75 mi
Loading nearby amenities…
Taxation est. · year 1
- Rental income
- $25,200
- − Mortgage interest
- −$10,363
- − Property taxes
- −$1,342
- − Insurance
- −$925
- − Repairs & maintenance
- −$2,016
- − Management
- −$2,016
- − HOA
- −$96
- − Depreciation
- −$5,382
- Taxable income
- $3,060
- Est. tax owed @ 24.0%
- −$734
- After-tax cash flow
- $5,168/yr
For passive investors: Depreciation is non-cash, so a rental often shows a tax loss while cash-flowing — sheltering income. Rental losses are passive: they offset passive income freely, and up to $25,000/yr can offset ordinary (W-2) income if you actively participate and your MAGI is under $100k (phasing out to $0 by $150k); unused losses carry forward. On sale, claimed depreciation is recaptured at up to 25%, and gains may owe capital-gains tax (a 1031 exchange can defer both). Figures are a year-1 estimate at your 24.0% rate — not tax advice; consult a CPA.
Schools (NCES district)
- District
- Delmar School District
- NCES district ID
- 1000270
- Math proficiency
- 20% ▼ -21.00%
- Reading proficiency
- 38% ▼ -13.00%
- Median HH income
- $46,620
- Composite
- 24.98/100
- National rank
- #7561
- State rank
- #17 of 26 in DE
Livability — Delmar
- Score
- 62/100
- State rank
- #63
- US rank
- #16926
Category grades
Schools grade is shown separately in the Schools card above.
Census & demographics
- Population (ZIP)
- 7,108
Population outlook (Sussex County) Hauer SSP2
- Today (2025)
- 248,853 people
- By 2030
- 264,464 · +6.3%
- By 2040
- 290,980 · +16.9%
- By 2050
- 311,259 · +25.1%
- By 2075
- 352,488 · +41.6%
- By 2100
- 367,406 · +47.6%
Race, ethnicity, and origin ACS 2023
- Neighborhood character
- Predominantly White (66%)
- Race & ethnicity
- White 66% Black 16% Two or more races 13% Hispanic / Latino 10% Asian 2%
- Hispanic origin (detail)
- Mexican 3% Cuban 2%
- Common ancestry
- Italian 2% Slovak 2% Hispanic 1%
- Foreign-born
- 7% · Canada, South Korea
- Languages at home
- 88% English-only · Spanish 8% Other Indo-European 1% French/Haitian/Cajun 1%
Political lean MEDSL · Sussex
- 2024 margin
- R (+11.0) · D 43.9% · R 54.9% · Other 1.2%
- 2008→2024 swing
- -2.4pp toward R · 2008: -8.6pp · 2024: -11.0pp
- All cycles
- 2024: R+11.0 2020: R+11.2 2016: R+22.0 2012: R+13.0 2008: R+8.6
Not yet ingested
- Civics
- —
Market trends
- HPI YoY
- ▲ 16.92%
- Current HPI
- 288.6213
- Rent YoY
- —
- Metro
- —
- State GDP YoY
- —
- F500 in state
- 0
Price history
+255.8% since first listed6 events — show timeline
- 2026-06-04 Listed $185,000 BRIGHT MLS
- 2026-06-01 Listing Removed — BRIGHT MLS
- 2026-05-15 Listed $125,000 BRIGHT MLS
- 2014-09-26 Sold (MLS) $52,000 BRIGHT MLS
- 2014-08-01 Listing Removed — BRIGHT MLS
- 2014-08-01 Listed $52,000 BRIGHT MLS
Property tax history
+2.9%/yrLatest (2025): $1,342 · +19.7% YoY. Source: county tax records.
Cash-flow waterfall
monthlySold comps — $/sqft
last 12 mo · ≤1 miLoading sold comps…