 🏗️ New Construction
BELLVUE Plan · Mayflower, AR
Flood risk 1/10 · Minimal
- FEMA flood zone
- X (unshaded)
- Chance of flooding over 30 yrs
- 0.0%
- Est. flood insurance / yr
- $507 – $1,088
Fire risk 5/10 · Moderate
- Est. fire insurance / yr
- $1,499 – $2,785
Heat risk 7/10 · Major
- Hot days now (above 111°F)
- 7 days/yr
- Hot days in 30 yrs
- 20 days/yr
Wind risk 4/10 · Minor
- Chance of severe wind over 30 yrs
- 9.0%
Air-quality risk 2/10 · Minimal
- Unhealthy air days now
- 0 days/yr
- Unhealthy air days in 30 yrs
- 1 days/yr
Risk factors via First Street. Map © Google.
Why this score? — see what drove the D- grade
The composite is a weighted blend of 9 inputs, each scored 0–100. Each bar is that input's sub-score; the figure is the points it added to the 100-point composite (weight × sub-score).
- Appreciation +9.8/10.0
- ARV discount +7.5/15.0
- Cash flow +7.2/30.0
- Schools +2.8/10.0
- Livability +2.8/5.0
- Rent growth +2.5/5.0
- Condition / age +2.5/5.0
- 1% rule +2.0/10.0
- DSCR +1.4/10.0
$242,000
🖨 Deal sheet 📄 Offer letter ✓ Due diligence
Listing remarks MLS
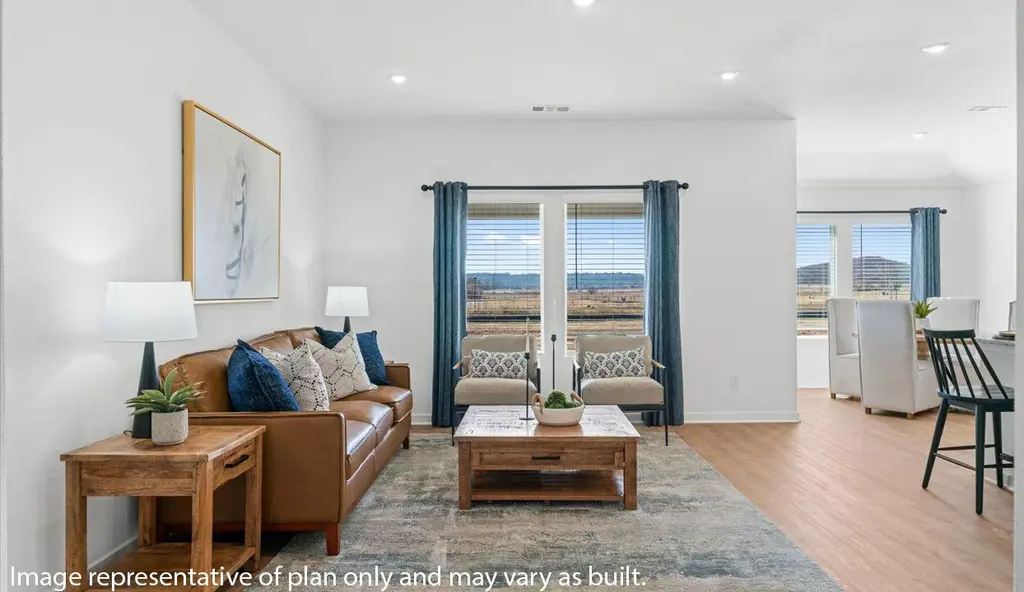
Welcome to The Vineyard, a charming new home community located in the highly sought-after Mayflower, AR. Here, you'll find five thoughtfully designed one-story floor plans, ranging from 1,473 to 1,897 square feet. Each plan offers 3 to 4 bedrooms, 2 full bathrooms, and a 2-car garage, providing the perfect balance of space and comfort. These new construction homes are built with high-quality finishes and numerous standard features, making The Vineyard an ideal place for modern living. The homes boast timeless brick exteriors and full yard landscaping. Inside, you'll be greeted by expansive, open kitchens, large windows that let in plenty of natural light, and inviting living rooms. Features like soft-close cebinets, stainless steel appliances, stainless steel undermount kitchen sink with pull out faucet and sleek quartz countertops add a touch of elegance throughout. The Vineyard also offers the ultimate convenience with fully integrated smart home technology, allowing you to control your home with ease while enjoying peace of mind.
Key facts
- Large windows
- 2 garage spots
- Listed 504 days
Tags
Neighborhood map
What this means for you Summary
Snapshot
- This is a 3-bed/2.0-bath single-family listed at $242k.
Deal economics
- At list price, monthly cash flow is $-342 ($-4k/yr) — negative.
- To cash-flow at today's rent, offer at most $201k (16.9% below list).
- To meet the 1% rule (rent ≥ 1% of price), the offer needs to be $176k (27.3% below list).
- Recommended offer: $176k (27.3% below list) — sets the bar for 1% rule.
Location & tenants
- Location reads 56/100 on livability (#390 in AR) — a working-class tenant base; expect higher turnover. Strengths: cost of living A+, housing B+; Watch: schools F, crime F, amenities F.
- Mayflower School District (rural): math 32% / reading 34% proficiency, ranked #127 of 238 in AR (top 53%) — families likely to look elsewhere, expect single-tenant / working-renter base with shorter leases.
- Market conditions: 110 active listings in the ZIP; 8 comparable units currently listed for rent nearby; rentals lingering (median 44d on market — plan ~5-8 weeks vacancy on turnover, expect pricing pressure); 50% of comp listings sitting > 30 days — soft ceiling on asking rent; 865 units permitted in Faulkner County in 2024 (451 in 5+ unit buildings).
Forward outlook
- In year one you build about $26k of equity ($2k loan paydown + $24k appreciation (9.6% local appreciation)).
- Faulkner County population projected at +32% by 2050 — long-run rental-demand tailwind backs the buy-and-hold thesis.
- By year 2, paydown + projected appreciation supports a ~$42k cash-out refi (75% LTV) — recoverable capital for the next deal without selling this one.
Negotiation context
- It's been on market 504 days — a 12% lower offer ($213k) is reasonable based on typical stale-listing flexibility.
Risks & watch-outs
- Climate carrying-cost: moderate wildfire risk; extreme-heat days projected 7→20/yr by 2055 (HVAC capex compounding) — expect insurance premiums to compound above CPI over the hold.
Questions for the listing agent
- What do current leases actually rent for vs. the listed asking? Can we see a recent rent roll and the last 12 months of T-12 income?
- It's been on market 504 days. Have you received any prior offers? Is the seller open to a 27% concession, seller financing, or rate buy-down credit?
- Why hasn't it sold? Are there any deal-killer items the seller is aware of (foundation, flood, title, zoning, code violations)?
- Is there a deadline driving the sale (1031 exchange, divorce, estate, relocation)? That informs how much negotiation room exists.
- Schools are F-rated, which usually means shorter tenancies and higher turnover. Who's the typical renter profile here, and what's been the actual vacancy rate?
- Crime grade is F in this area — have there been break-ins, vandalism, or insurance claims at this property in the last 3 years? What carrier currently insures it and at what premium?
- The area grade is low — what's the realistic commute time and amenity access for the typical tenant pool here? Any planned neighborhood developments (good or bad) we should know about?
- What's the average days-on-market for RENTAL listings here right now (not sales)? A rising rental-DOM trend means longer vacancies and softer asking-rent achievability than the comps imply.
- What's the recent tenant-quality profile in this submarket — average credit score on applications, eviction rate, late-payment / NSF rate, and stable-employment percentage? A property-management company in the area should have these aggregated.
- How much new for-sale + rental construction is in the pipeline within 1–3 miles? Heavy new supply typically softens prices + rents 12–24 months out; constrained supply supports both.
Investment metrics
- 1% rule
- 0.70% ✗
- Cap rate
- 4.66%
- Cash-on-cash
- -5.84%
- DSCR
- 0.74
- GRM
- 11.9
CMA / ARV
- ARV (median comp)
- $250,666
- List price
- $242,000
- Delta
- -3.46%
- Verdict
- FAIR
- Comps
- 20 within 1.0 mi
Show comp detail 12 sales within ~0.75 mi
| Address | Dist | Beds/Ba | Sqft | Sold | Price | $/sf | Match |
|---|---|---|---|---|---|---|---|
| 13 E Reliance Ct | 0.15mi | 3/2.0 | 1,472 (-0%) | 0mo | $219,900 | $149 | 92 |
| 16 E Reliance Ct | 0.18mi | 3/2.0 | 1,472 (-0%) | 0mo | $222,900 | $151 | 91 |
| 15 E Reliance Ct | 0.15mi | 3/2.0 | 1,523 (+3%) | 1mo | $220,900 | $145 | 87 |
| 13 Vineyard Dr | 0.18mi | 4/2.0 (+1) | 1,476 (+0%) | 2mo | $196,000 | $133 | 85 |
| 7 Vineyard Dr | 0.17mi | 4/2.0 (+1) | 1,476 (+0%) | 3mo | $196,000 | $133 | 84 |
| 17 E Reliance Ct | 0.16mi | 3/2.0 | 1,355 (-8%) | 1mo | $212,400 | $157 | 79 |
| 4 Concord Rd | 0.16mi | 3/2.0 | 1,600 (+9%) | 1mo | $269,900 | $169 | 77 |
| 101 E Fredonia Ct | 0.03mi | 4/2.0 (+1) | 1,655 (+12%) | 1mo | $232,000 | $140 | 72 |
| 3 Vineyard Dr | 0.18mi | 4/2.0 (+1) | 1,655 (+12%) | 2mo | $211,000 | $127 | 65 |
| 14 Cross St | 0.31mi | 4/1.0 (+1) | 1,352 (-8%) | 1mo | $159,000 | $118 | 62 |
| 18 Wheeler St | 0.54mi | 3/2.0 | 1,354 (-8%) | 2mo | $205,000 | $151 | 59 |
| 22 Ledrick Cir | 0.46mi | 3/2.0 | 1,648 (+12%) | 3mo | $264,400 | $160 | 56 |
Match score weights: distance 35% · size 25% · config 20% · recency 20%. Top-matched comps best support the ARV.
Projected returns pro-forma
9.62% appreciation · 3.0% rent growth · sell at horizon
- IRR
- 19.3%
- Equity multiple
- 2.54×
- Total profit
- $108,240
- Equity at exit
- $218,864
- IRR
- 17.8%
- Equity multiple
- 5.76×
- Total profit
- $334,295
- Equity at exit
- $464,777
Cash invested: $70,186 (down + closing). Projections, not guarantees.
Landlord ↔ Tenant lean methodology
- Overall (STATE)
- 92 Strongly Landlord-Friendly
- State Arkansas
- 92 Strongly Landlord-Friendly · R+14
- County
- — inherits STATE
- City
- — inherits STATE
ZIP-level market 72106
- Home prices YoY
- 4.2%
- Active inventory
- 110
- Price-to-rent
- 11.5×
Monthly cashflow live
- Estimated rent
- $1,760 high interval (Pro) →
- Mortgage (P&I)
- −$1,315
- Tax est. 1.5%
- −$313 /mo · $3,760/yr
- Insurance
- −$104
- HOA
- −$0
- Vacancy / Maint / Mgmt
- −$370
- Net cashflow
- $-342
Break-even live
UW: 25.0% down · 7.5% · 30yr · 1.5% tax · 5.0% vac · 8.0% maint · 8.0% mgmt
Financing live
Cash to close
- Down payment
- $62,666
- Closing costs
- $7,520
- Reserves months
- —
- Total cash needed
- —
Loan-product check · same deal, 3 products live
Conventional
25% down · 7.5% · 30yr
- Down + closing
- —
- Monthly P&I
- —
- Monthly cashflow
- —
- DSCR
- —
- Eligible?
- —
Personal DTI + credit; lowest rate.
DSCR
20% down · 8.5% · 30yr
- Down + closing
- —
- Monthly P&I
- —
- Monthly cashflow
- —
- DSCR
- —
- Eligible?
- —
No personal income docs; deal must DSCR.
Hard money
10% down · 12.0% · 12mo
- Down + closing
- —
- Monthly P&I
- —
- Monthly cashflow
- —
- DSCR
- —
- Eligible?
- —
Short-term bridge; refi at stabilization.
Rent comps 8 comps
| Address | Beds | Baths | Sqft | Rent | $/sqft | DOM | Units | Dist |
|---|---|---|---|---|---|---|---|---|
| 101 E Fredonia Ct Mayflower, AR | 4.0 | 2.0 | 1655 | $1,923 | $1.16 | 14d | 1 | 0.04mi |
| 104 E Fredonia Ct Mayflower, AR | 4.0 | 2.0 | 1476 | $1,750 | $1.19 | 43d | 1 | 0.06mi |
| 103 E Fredonia Ct Mayflower, AR | 3.0 | 2.0 | 1364 | $1,650 | $1.21 | 14d | 1 | 0.06mi |
| 5 Vineyard Dr Mayflower, AR | 3.0 | 2.0 | 1364 | $1,650 | $1.21 | 43d | 1 | 0.18mi |
| 7 Vineyard Dr Mayflower, AR | 4.0 | 2.0 | 1476 | $1,750 | $1.19 | 43d | 1 | 0.18mi |
| 3 Vineyard Dr Mayflower, AR | 4.0 | 2.0 | 1655 | $1,850 | $1.12 | 14d | 1 | 0.18mi |
| 11 Vineyard Dr Mayflower, AR | 3.0 | 2.0 | 1364 | $1,650 | $1.21 | 43d | 1 | 0.18mi |
| 17 Vineyard Dr Mayflower, AR | 4.0 | 2.0 | 1655 | $1,850 | $1.12 | 14d | 1 | 0.19mi |
Listing history 16 events
-
2026-06-18days on market $242,000 Active 504 DOM
-
2026-06-17days on market $242,000 Active 503 DOM
-
2026-06-16days on market $242,000 Active 502 DOM
-
2026-06-15days on market $242,000 Active 501 DOM
-
2026-06-14days on market $242,000 Active 499 DOM
-
2026-06-10days on market $242,000 Active 496 DOM
-
2026-06-09days on market $242,000 Active 495 DOM
-
2026-06-08days on market $242,000 Active 494 DOM
-
2026-06-07days on market $242,000 Active 493 DOM
-
2026-06-05days on market $242,000 Active 490 DOM
-
2026-06-03days on market $242,000 Active 489 DOM
-
2026-06-02days on market $242,000 Active 488 DOM
-
2026-06-01days on market $242,000 Active 487 DOM
-
2026-05-31days on market $242,000 Active 486 DOM
-
2026-05-31days on market $242,000 Active 485 DOM
-
2025-01-30$242,000 Active 1048-char remark
Show marketing remark (1048 chars)
Welcome to The Vineyard, a charming new home community located in the highly sought-after Mayflower, AR. Here, you'll find five thoughtfully designed one-story floor plans, ranging from 1,473 to 1,897 square feet. Each plan offers 3 to 4 bedrooms, 2 full bathrooms, and a 2-car garage, providing the perfect balance of space and comfort. These new construction homes are built with high-quality finishes and numerous standard features, making The Vineyard an ideal place for modern living. The homes boast timeless brick exteriors and full yard landscaping. Inside, you'll be greeted by expansive, open kitchens, large windows that let in plenty of natural light, and inviting living rooms. Features like soft-close cebinets, stainless steel appliances, stainless steel undermount kitchen sink with pull out faucet and sleek quartz countertops add a touch of elegance throughout. The Vineyard also offers the ultimate convenience with fully integrated smart home technology, allowing you to control your home with ease while enjoying peace of mind.
ⓘ Source: listings_history table (triggers on properties + properties_extension) + one-shot
backfill from property_details.listing_events for pre-trigger history.
Climate risk First Street
- Flood 1/10 Low FEMA zone X (unshaded) · 0% chance over 30 yrs
- Wildfire 5/10 Major
- Heat 7/10 Severe 7 d/yr ≥111°F today · 20 d/yr by 30 yrs out
- Wind 4/10 Moderate 9% chance of damaging wind over 30 yrs
- Air quality 2/10 Low 0 unhealthy d/yr today · 1 by 30 yrs out
Nearby sold comps map
Loading sold comps map…
Walkable amenities ~0.75 mi
Loading nearby amenities…
Taxation est. · year 1
- Rental income
- $21,122
- − Mortgage interest
- −$14,041
- − Property taxes
- −$3,760
- − Insurance
- −$1,253
- − Repairs & maintenance
- −$1,690
- − Management
- −$1,690
- − Depreciation
- −$7,292
- Taxable loss
- −$8,604
- Est. tax savings @ 24.0%
- +$2,065
- After-tax cash flow
- $-2,036/yr
For passive investors: Depreciation is non-cash, so a rental often shows a tax loss while cash-flowing — sheltering income. Rental losses are passive: they offset passive income freely, and up to $25,000/yr can offset ordinary (W-2) income if you actively participate and your MAGI is under $100k (phasing out to $0 by $150k); unused losses carry forward. On sale, claimed depreciation is recaptured at up to 25%, and gains may owe capital-gains tax (a 1031 exchange can defer both). Figures are a year-1 estimate at your 24.0% rate — not tax advice; consult a CPA.
Schools (NCES district)
- District
- Mayflower School District
- NCES district ID
- 0509540
- Math proficiency
- 32% ▼ -9.00%
- Reading proficiency
- 34% ▼ -6.00%
- Median HH income
- $47,119
- Composite
- 28.41/100
- National rank
- #6760
- State rank
- #127 of 238 in AR
Livability — Mayflower
- Score
- 56/100
- State rank
- #390
- US rank
- #22893
Category grades
Schools grade is shown separately in the Schools card above.
Census & demographics
- Census place
- Mayflower, AR
- Population (ZIP)
- 5,719
Population outlook (Faulkner County) Hauer SSP2
- Today (2025)
- 138,985 people
- By 2030
- 148,264 · +6.7%
- By 2040
- 166,010 · +19.4%
- By 2050
- 183,362 · +31.9%
- By 2075
- 224,593 · +61.6%
- By 2100
- 250,603 · +80.3%
Race, ethnicity, and origin ACS 2023
- Neighborhood character
- Predominantly White (86%)
- Race & ethnicity
- White 86% Two or more races 7% Black 6% Hispanic / Latino 1%
- Common ancestry
- Slovak 3% Lithuanian 1% Italian 1%
- Foreign-born
- 6% · Canada
Political lean MEDSL · Faulkner
- 2024 margin
- Solid R (+32.3) · D 32.6% · R 64.9% · Other 2.5%
- 2008→2024 swing
- -7.1pp toward R · 2008: -25.3pp · 2024: -32.3pp
- All cycles
- 2024: R+32.3 2020: R+29.5 2016: R+31.6 2012: R+31.7 2008: R+25.3
Not yet ingested
- Civics
- —
Market trends
- HPI YoY
- ▲ 9.62%
- Current HPI
- 236.6197
- Rent YoY
- —
- Metro
- —
- State GDP YoY
- ▲ 3.80%
- F500 in state
- 10
Industry mix (Fortune 500 HQ in AR)
| Industry | F500 HQs | Revenue |
|---|---|---|
| Retail | 1 | $681B |
|
||
| Food / Agriculture | 1 | $53B |
|
||
| Retail / Energy | 1 | $22B |
|
||
| Transportation / Logistics | 1 | $12B |
|
||
| Energy | 1 | $4B |
|
||
Price history
1 event — show timeline
- 2025-01-30 Listed $242,000 Zillow
Cash-flow waterfall
monthlySold comps — $/sqft
last 12 mo · ≤1 miLoading sold comps…