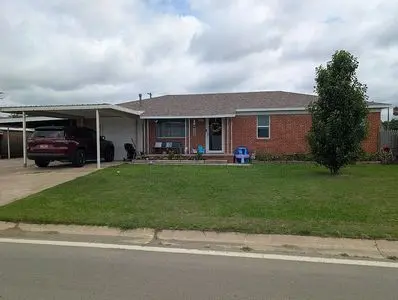
105 W Davis St · Paoli, OK
Flood risk 1/10 · Minimal
- FEMA flood zone
- X (unshaded)
- Chance of flooding over 30 yrs
- 0.0%
- Est. flood insurance / yr
- $507 – $1,088
Fire risk 5/10 · Moderate
- Est. fire insurance / yr
- $2,463 – $4,575
Heat risk 6/10 · Moderate
- Hot days now (above 109°F)
- 7 days/yr
- Hot days in 30 yrs
- 19 days/yr
Wind risk 4/10 · Minor
- Chance of severe wind over 30 yrs
- 9.0%
Air-quality risk 2/10 · Minimal
- Unhealthy air days now
- 1 days/yr
- Unhealthy air days in 30 yrs
- 1 days/yr
Risk factors via First Street. Map © Google.
Why this score? — see what drove the D grade
The composite is a weighted blend of 9 inputs, each scored 0–100. Each bar is that input's sub-score; the figure is the points it added to the 100-point composite (weight × sub-score).
- Appreciation +9.4/10.0
- Cash flow +9.0/30.0
- ARV discount +7.5/15.0
- Livability +3.0/5.0
- 1% rule +2.8/10.0
- DSCR +2.5/10.0
- Rent growth +2.5/5.0
- Condition / age +2.5/5.0
- Schools +1.9/10.0
$150,000
🖨 Deal sheet 📄 Offer letter ✓ Due diligence
Listing remarks
Welcome home! This beautifully maintained, all-brick single-story home is nestled in a safe, tight-knit community where neighbors feel like family. Perfectly located just minutes from local schools and churches, with a basketball court right across the street, it & acirc; & euro; & trade; s an ideal setting for raising a family. Key Features You& apos; ll Love: Ultimate Toy & amp; Hobby Storage: Includes a massive, spacious shop with plenty of clearance to easily fit your RV, boat, or project cars, plus an attached carport and garage. Huge Family Yard: A flat, beautifully maintained front lawn and a spacious, big backyard with tons of room for the kids to run, play, and
Key facts
- Big backyard
- Attached carport
- All brick
Tags
Neighborhood map
What this means for you Summary
Snapshot
- This is a 3-bed/2.0-bath other listed at $150k.
Deal economics
- At list price, monthly cash flow is $-117 ($-1k/yr) — negative.
- To cash-flow at today's rent, offer at most $133k (11.3% below list).
- To meet the 1% rule (rent ≥ 1% of price), the offer needs to be $116k (22.4% below list).
- Recommended offer: $116k (22.4% below list) — sets the bar for 1% rule.
Location & tenants
- Location reads 60/100 on livability (#362 in OK) — a middle-class / working-renter tenant base. Strengths: cost of living A+, housing A+; Watch: employment C-, schools F, crime F.
- Paoli (rural): math 15% / reading 20% proficiency, ranked #426 of 513 in OK (top 83%) — low school quality limits family demand, transient renter base, plan for 1-2y turnover; 70% free/reduced lunch — lower-income household profile, screen leases tightly.
- Market conditions: 5 active listings in the ZIP; 1 units permitted in Garvin County in 2024 (0 in 5+ unit buildings).
Forward outlook
- In year one you build about $14k of equity ($1k loan paydown + $13k appreciation (8.9% local appreciation)).
- Garvin County population projected at +8% by 2050 — modest demand growth; plan on rents tracking national, not racing it.
- By year 3, paydown + projected appreciation supports a ~$36k cash-out refi (75% LTV) — recoverable capital for the next deal without selling this one.
Negotiation context
- Only 12 days on market — expect competitive offers; lowballing is unlikely to land.
Risks & watch-outs
- Climate carrying-cost: moderate wildfire risk; extreme-heat days projected 7→19/yr by 2055 (HVAC capex compounding) — expect insurance premiums to compound above CPI over the hold.
Questions for the listing agent
- What do current leases actually rent for vs. the listed asking? Can we see a recent rent roll and the last 12 months of T-12 income?
- Built in 1970 — when were the roof, HVAC, electrical panel, plumbing, and water heater last replaced?
- Is there a deadline driving the sale (1031 exchange, divorce, estate, relocation)? That informs how much negotiation room exists.
- Schools are F-rated, which usually means shorter tenancies and higher turnover. Who's the typical renter profile here, and what's been the actual vacancy rate?
- Crime grade is F in this area — have there been break-ins, vandalism, or insurance claims at this property in the last 3 years? What carrier currently insures it and at what premium?
- The area grade is low — what's the realistic commute time and amenity access for the typical tenant pool here? Any planned neighborhood developments (good or bad) we should know about?
- What's the average days-on-market for RENTAL listings here right now (not sales)? A rising rental-DOM trend means longer vacancies and softer asking-rent achievability than the comps imply.
- What's the recent tenant-quality profile in this submarket — average credit score on applications, eviction rate, late-payment / NSF rate, and stable-employment percentage? A property-management company in the area should have these aggregated.
- How much new for-sale + rental construction is in the pipeline within 1–3 miles? Heavy new supply typically softens prices + rents 12–24 months out; constrained supply supports both.
Investment metrics
- 1% rule
- 0.78% ✗
- Cap rate
- 5.36%
- Cash-on-cash
- -3.34%
- DSCR
- 0.85
- GRM
- 10.7
CMA / ARV
No comps found within radius.
Projected returns pro-forma
8.87% appreciation · 3.0% rent growth · sell at horizon
- IRR
- 19.4%
- Equity multiple
- 2.50×
- Total profit
- $62,855
- Equity at exit
- $123,003
- IRR
- 18.0%
- Equity multiple
- 5.49×
- Total profit
- $188,768
- Equity at exit
- $253,331
Cash invested: $42,000 (down + closing). Projections, not guarantees.
Landlord ↔ Tenant lean methodology
- Overall (STATE)
- 83 Strongly Landlord-Friendly
- State Oklahoma
- 83 Strongly Landlord-Friendly · R+20
- County
- — inherits STATE
- City
- — inherits STATE
ZIP-level market 73074
- Home prices YoY
- 3.9%
- Active inventory
- 5
- Price-to-rent
- 10.7×
Monthly cashflow live
- Estimated rent
- $1,164 medium interval (Pro) →
- Mortgage (P&I)
- −$787
- Tax est. 1.5%
- −$188 /mo · $2,250/yr
- Insurance
- −$62
- HOA
- −$0
- Vacancy / Maint / Mgmt
- −$244
- Net cashflow
- $-117
Break-even live
UW: 25.0% down · 7.5% · 30yr · 1.5% tax · 5.0% vac · 8.0% maint · 8.0% mgmt
Financing live
Cash to close
- Down payment
- $37,500
- Closing costs
- $4,500
- Reserves months
- —
- Total cash needed
- —
Loan-product check · same deal, 3 products live
Conventional
25% down · 7.5% · 30yr
- Down + closing
- —
- Monthly P&I
- —
- Monthly cashflow
- —
- DSCR
- —
- Eligible?
- —
Personal DTI + credit; lowest rate.
DSCR
20% down · 8.5% · 30yr
- Down + closing
- —
- Monthly P&I
- —
- Monthly cashflow
- —
- DSCR
- —
- Eligible?
- —
No personal income docs; deal must DSCR.
Hard money
10% down · 12.0% · 12mo
- Down + closing
- —
- Monthly P&I
- —
- Monthly cashflow
- —
- DSCR
- —
- Eligible?
- —
Short-term bridge; refi at stabilization.
Listing history 10 events
-
2026-06-18days on market $150,000 Active 12 DOM
-
2026-06-17days on market $150,000 Active 11 DOM
-
2026-06-16days on market $150,000 Active 10 DOM
-
2026-06-15days on market $150,000 Active 9 DOM
-
2026-06-13days on market $150,000 Active 7 DOM
-
2026-06-12days on market $150,000 Active 6 DOM
-
2026-06-09days on market $150,000 Active 3 DOM
-
2026-06-08days on market $150,000 Active 2 DOM
-
2026-06-08remarks 679-char remark
-
2026-06-08$150,000 Active 1 DOM
ⓘ Source: listings_history table (triggers on properties + properties_extension) + one-shot
backfill from property_details.listing_events for pre-trigger history.
Climate risk First Street
- Flood 1/10 Low FEMA zone X (unshaded) · 0% chance over 30 yrs
- Wildfire 5/10 Major
- Heat 6/10 Major 7 d/yr ≥109°F today · 19 d/yr by 30 yrs out
- Wind 4/10 Moderate 9% chance of damaging wind over 30 yrs
- Air quality 2/10 Low 1 unhealthy d/yr today · 1 by 30 yrs out
Nearby sold comps map
Loading sold comps map…
Walkable amenities ~0.75 mi
Loading nearby amenities…
Taxation est. · year 1
- Rental income
- $13,968
- − Mortgage interest
- −$8,402
- − Property taxes
- −$2,250
- − Insurance
- −$750
- − Repairs & maintenance
- −$1,117
- − Management
- −$1,117
- − Depreciation
- −$4,364
- Taxable loss
- −$4,033
- Est. tax savings @ 24.0%
- +$968
- After-tax cash flow
- $-437/yr
For passive investors: Depreciation is non-cash, so a rental often shows a tax loss while cash-flowing — sheltering income. Rental losses are passive: they offset passive income freely, and up to $25,000/yr can offset ordinary (W-2) income if you actively participate and your MAGI is under $100k (phasing out to $0 by $150k); unused losses carry forward. On sale, claimed depreciation is recaptured at up to 25%, and gains may owe capital-gains tax (a 1031 exchange can defer both). Figures are a year-1 estimate at your 24.0% rate — not tax advice; consult a CPA.
Schools (NCES district)
- District
- Paoli
- NCES district ID
- 4023430
- Math proficiency
- 15% ▲ 5.00%
- Reading proficiency
- 20% ▬ 0.00%
- Median HH income
- $46,285
- Composite
- 18.82/100
- National rank
- #13991
- State rank
- #426 of 513 in OK
Livability — Paoli
- Score
- 60/100
- State rank
- #362
- US rank
- #19216
Category grades
Schools grade is shown separately in the Schools card above.
Census & demographics
- Census place
- Paoli, OK
- Population (ZIP)
- 1,147
Population outlook (Garvin County) Hauer SSP2
- Today (2025)
- 28,277 people
- By 2030
- 28,619 · +1.2%
- By 2040
- 29,478 · +4.2%
- By 2050
- 30,384 · +7.5%
- By 2075
- 34,074 · +20.5%
- By 2100
- 36,099 · +27.7%
Race, ethnicity, and origin ACS 2023
- Neighborhood character
- Predominantly White (70%)
- Race & ethnicity
- White 70% Two or more races 18% Hispanic / Latino 9% Native American 6% Asian 1%
- Hispanic origin (detail)
- Mexican 7%
- Common ancestry
- Lithuanian 9% European 2% Iranian 2%
- Foreign-born
- 2% · China, Canada
- Languages at home
- 95% English-only · Spanish 3% Chinese 1% Other Indo-European 1%
Political lean MEDSL · Garvin
- 2024 margin
- Solid R (+66.1) · D 16.4% · R 82.5% · Other 1.1%
- 2008→2024 swing
- -22.5pp toward R · 2008: -43.6pp · 2024: -66.1pp
- All cycles
- 2024: R+66.1 2020: R+64.2 2016: R+60.7 2012: R+46.1 2008: R+43.6
Not yet ingested
- Civics
- —
Market trends
- HPI YoY
- ▲ 8.87%
- Current HPI
- 236.8197
- Rent YoY
- —
- Metro
- —
- State GDP YoY
- ▲ 1.55%
- F500 in state
- 6
Industry mix (Fortune 500 HQ in OK)
| Industry | F500 HQs | Revenue |
|---|---|---|
| Energy | 3 | $48B |
|
||
Price history
1 event — show timeline
- 2026-06-07 Listed $150,000 FSBO.com
Cash-flow waterfall
monthlySold comps — $/sqft
last 12 mo · ≤1 miLoading sold comps…