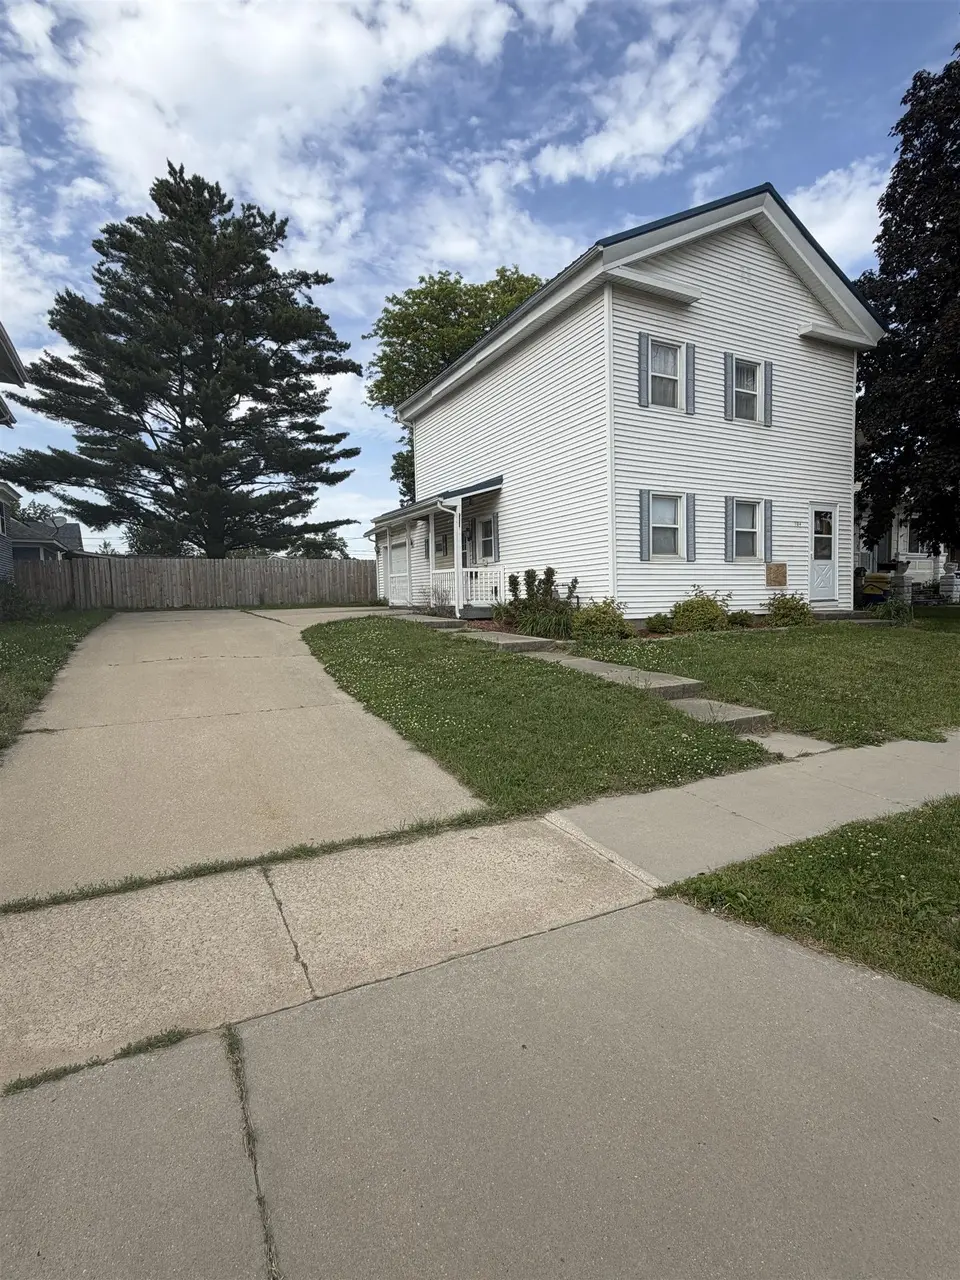
704 E 1st Street St · Independence, IA
Flood risk 1/10 · Minimal
- FEMA flood zone
- X (unshaded)
- Chance of flooding over 30 yrs
- 0.0%
- Est. flood insurance / yr
- $473 – $860
Fire risk 4/10 · Minor
- Est. fire insurance / yr
- $902 – $1,676
Heat risk 3/10 · Minor
- Hot days now (above 102°F)
- 7 days/yr
- Hot days in 30 yrs
- 15 days/yr
Wind risk 2/10 · Minimal
- Chance of severe wind over 30 yrs
- —
Air-quality risk 1/10 · Minimal
- Unhealthy air days now
- 0 days/yr
- Unhealthy air days in 30 yrs
- 0 days/yr
Risk factors via First Street. Map © Google.
Why this score? — see what drove the B grade
The composite is a weighted blend of 9 inputs, each scored 0–100. Each bar is that input's sub-score; the figure is the points it added to the 100-point composite (weight × sub-score).
- Cash flow +30.0/30.0
- 1% rule +10.0/10.0
- DSCR +10.0/10.0
- ARV discount +7.5/15.0
- Schools +6.3/10.0
- Livability +3.8/5.0
- Rent growth +2.5/5.0
- Condition / age +2.5/5.0
- Appreciation +0.0/10.0
$71,500
🖨 Deal sheet 📄 Offer letter ✓ Due diligence
Listing remarks
Looking for a property to put a little sweat equity into and make your own, look no further! This house has a bedroom and bathroom on the main level with bedroom and bathroom options upstairs also. Currently the upstairs is unfinished.
Key facts
- 3,640 sq ft lot
- Parking
- Built 1870
Neighborhood map
What this means for you Summary
Snapshot
- This is a 1-bed/1.0-bath single-family listed at $72k.
Deal economics
- At list price, monthly cash flow is $621 ($7k/yr) — positive.
- The deal already cash-flows at list — no discount required.
- Meets the 1% rule at list price ($1k rent vs $72k).
- Cap rate 16.7% vs local median 3.6% in Independence — top-decile yield for the area; either an underpriced asset or a hidden risk that comps aren't pricing in. Stress-test before assuming the spread holds.
Location & tenants
- Location reads 76/100 on livability (#198 in IA, #3,628 nationally) — a middle-class / working-renter tenant base. Strengths: crime A+, cost of living A+, housing A+; Watch: amenities F, commute F.
- Independence Community School District (rural): math 73% / reading 74% proficiency, ranked #86 of 289 in IA (top 30%) — strong family-tenant draw, lease renewals of 3-5y typical.
- Zoned schools: Independence Junior Senior High School (math 74% / reading 77%, grade A-, #79 of 336 statewide, top 25%, 701 students, 32% FRL).
- Market conditions: 61 active listings in the ZIP; 3 comparable units currently listed for rent nearby; rentals leasing fast (median 1d on market — plan ~1-2 weeks tenant-placement turnaround); 19 units permitted in Buchanan County in 2024 (0 in 5+ unit buildings).
Forward outlook
- Local home prices are declining (-3.0%/yr); year-one equity from $494 of loan paydown is wiped out by about $2k of value loss. Plan a longer hold.
- Buchanan County population projected to shrink 9% by 2050 — rents likely to lag national; underwrite the cash flow, not the appreciation.
- At projected returns (-3.0% appreciation + 3.0% rent growth), your $20k cash investment doubles in ~4 years — after that, you're playing with house money.
Negotiation context
- Only 0 days on market — expect competitive offers; lowballing is unlikely to land.
Risks & watch-outs
- Watch-outs: built in 1870 — expect roof / HVAC / electrical / plumbing capex.
Questions for the listing agent
- Built in 1870 — when were the roof, HVAC, electrical panel, plumbing, and water heater last replaced?
- Is there a deadline driving the sale (1031 exchange, divorce, estate, relocation)? That informs how much negotiation room exists.
- Schools are A-rated — typically a magnet for longer-tenancy family renters. What's the average tenant stay here, and is there a school-zone premium baked into asking?
- What's the average days-on-market for RENTAL listings here right now (not sales)? A rising rental-DOM trend means longer vacancies and softer asking-rent achievability than the comps imply.
- What's the recent tenant-quality profile in this submarket — average credit score on applications, eviction rate, late-payment / NSF rate, and stable-employment percentage? A property-management company in the area should have these aggregated.
- How much new for-sale + rental construction is in the pipeline within 1–3 miles? Heavy new supply typically softens prices + rents 12–24 months out; constrained supply supports both.
Investment metrics
- 1% rule
- 1.89% ✓
- Cap rate
- 16.72%
- Cash-on-cash
- 37.25%
- DSCR
- 2.66
- GRM
- 4.4
CMA / ARV
- ARV (on-the-fly)
- $162,360
- Comps found
- 8
Show comp detail 8 sales within ~0.75 mi
| Address | Dist | Beds/Ba | Sqft | Sold | Price | $/sf | Match |
|---|---|---|---|---|---|---|---|
| 708 3rd St SE | 0.15mi | 2/1.0 (+1) | 1,200 (-9%) | 1mo | $148,000 | $123 | 72 |
| 1117 NE 3rd St | 0.37mi | 2/1.5 (+1) | 1,392 (+6%) | 3mo | $174,000 | $125 | 64 |
| 814 SE 3rd St | 0.18mi | 2/1.0 (+1) | 1,208 (-8%) | 17mo | $140,000 | $116 | 59 |
| 610 2nd Ave SW | 0.57mi | 2/1.5 (+1) | 1,256 (-5%) | 12mo | $199,900 | $159 | 48 |
| 812 6th Ave NE | 0.54mi | 2/1.5 (+1) | 1,284 (-3%) | 21mo | $164,000 | $128 | 46 |
| 703 Center Ave | 0.74mi | 2/2.0 (+1) | 1,318 (-0%) | 13mo | $137,500 | $104 | 46 |
| 816 NE 5th Ave | 0.55mi | 2/1.0 (+1) | 1,198 (-9%) | 12mo | $52,500 | $44 | 44 |
| 307 SE 7th Street St | 0.52mi | 2/1.0 (+1) | 1,224 (-7%) | 19mo | $144,900 | $118 | 43 |
Match score weights: distance 35% · size 25% · config 20% · recency 20%. Top-matched comps best support the ARV.
Projected returns pro-forma
-3.0% appreciation · 3.0% rent growth · sell at horizon
- IRR
- 33.2%
- Equity multiple
- 2.40×
- Total profit
- $27,983
- Equity at exit
- $10,661
- IRR
- 40.1%
- Equity multiple
- 4.76×
- Total profit
- $75,291
- Equity at exit
- $6,182
Cash invested: $20,020 (down + closing). Projections, not guarantees.
Landlord ↔ Tenant lean methodology
- Overall (STATE)
- 83 Strongly Landlord-Friendly
- State Iowa
- 83 Strongly Landlord-Friendly · R+6
- County
- — inherits STATE
- City
- — inherits STATE
ZIP-level market 50644
- Home prices YoY
- -24.3%
- Active inventory
- 61
- Price-to-rent
- 4.4×
Monthly cashflow live
- Estimated rent
- $1,350 medium interval (Pro) →
- Mortgage (P&I)
- −$375
- Tax from tax record
- −$40 /mo · $484/yr
- Insurance
- −$30
- HOA
- −$0
- Vacancy / Maint / Mgmt
- −$284
- Net cashflow
- $621
Break-even live
UW: 25.0% down · 7.5% · 30yr · 1.5% tax · 5.0% vac · 8.0% maint · 8.0% mgmt
Financing live
Cash to close
- Down payment
- $17,875
- Closing costs
- $2,145
- Reserves months
- —
- Total cash needed
- —
Loan-product check · same deal, 3 products live
Conventional
25% down · 7.5% · 30yr
- Down + closing
- —
- Monthly P&I
- —
- Monthly cashflow
- —
- DSCR
- —
- Eligible?
- —
Personal DTI + credit; lowest rate.
DSCR
20% down · 8.5% · 30yr
- Down + closing
- —
- Monthly P&I
- —
- Monthly cashflow
- —
- DSCR
- —
- Eligible?
- —
No personal income docs; deal must DSCR.
Hard money
10% down · 12.0% · 12mo
- Down + closing
- —
- Monthly P&I
- —
- Monthly cashflow
- —
- DSCR
- —
- Eligible?
- —
Short-term bridge; refi at stabilization.
Rent comps 3 comps
| Address | Beds | Baths | Sqft | Rent | $/sqft | DOM | Units | Dist |
|---|---|---|---|---|---|---|---|---|
| 503 Enterprise Ct Apt 5 Independence, IA | 2.0 | 2.0 | 1054 | $1,350 | $1.28 | 44d | 1 | 1.44mi |
| 507 Enterprise Ct Apt 4 Independence, IA | 2.0 | 2.0 | 1050 | $1,350 | $1.29 | 1d | 1 | 1.46mi |
| 505 Enterprise Ct Independence, IA | 2.0 | 2.0 | 1054 | $1,350 | $1.28 | 1d | 2 | 1.46mi |
Listing history 2 events
-
2026-06-01remarks 236-char remark
-
2026-06-01$71,500 Pending
ⓘ Source: listings_history table (triggers on properties + properties_extension) + one-shot
backfill from property_details.listing_events for pre-trigger history.
Tax reassessment forecast IA · Partial reset (capped growth)
- Current annual tax
- $484 · $40/mo
- Projected year-2 tax
- $803 · $67/mo
- Expected delta
- +$319/yr (+$27/mo · 66.0%)
ⓘ Screening estimate from a state-policy table — verify with the county assessor before closing.
Climate risk First Street
- Flood 1/10 Low FEMA zone X (unshaded) · 0% chance over 30 yrs
- Wildfire 4/10 Moderate
- Heat 3/10 Moderate 7 d/yr ≥102°F today · 15 d/yr by 30 yrs out
- Wind 2/10 Low
- Air quality 1/10 Low 0 unhealthy d/yr today · 0 by 30 yrs out
Nearby sold comps map
Loading sold comps map…
Walkable amenities ~0.75 mi
Loading nearby amenities…
Taxation est. · year 1
- Rental income
- $16,200
- − Mortgage interest
- −$4,005
- − Property taxes
- −$484
- − Insurance
- −$358
- − Repairs & maintenance
- −$1,296
- − Management
- −$1,296
- − Depreciation
- −$2,080
- Taxable income
- $6,681
- Est. tax owed @ 24.0%
- −$1,604
- After-tax cash flow
- $5,854/yr
For passive investors: Depreciation is non-cash, so a rental often shows a tax loss while cash-flowing — sheltering income. Rental losses are passive: they offset passive income freely, and up to $25,000/yr can offset ordinary (W-2) income if you actively participate and your MAGI is under $100k (phasing out to $0 by $150k); unused losses carry forward. On sale, claimed depreciation is recaptured at up to 25%, and gains may owe capital-gains tax (a 1031 exchange can defer both). Figures are a year-1 estimate at your 24.0% rate — not tax advice; consult a CPA.
Schools (NCES district)
- District
- Independence Community School District
- NCES district ID
- 1914580
- Math proficiency
- 73% ▼ -3.00%
- Reading proficiency
- 74% ▲ 4.00%
- Median HH income
- $54,269
- Composite
- 62.68/100
- National rank
- #674
- State rank
- #86 of 289 in IA
Livability — Independence
- Score
- 76/100
- State rank
- #198
- US rank
- #3628
Category grades
Schools grade is shown separately in the Schools card above.
Census & demographics
- Census place
- Independence, IA
- City population
- 8,475
- Population (ZIP)
- 8,475
Population outlook (Buchanan County) Hauer SSP2
- Today (2025)
- 20,892 people
- By 2030
- 20,578 · -1.5%
- By 2040
- 19,906 · -4.7%
- By 2050
- 19,024 · -8.9%
- By 2075
- 16,289 · -22.0%
- By 2100
- 12,561 · -39.9%
Race, ethnicity, and origin ACS 2023
- Neighborhood character
- Predominantly White (95%)
- Race & ethnicity
- White 95% Hispanic / Latino 2% Two or more races 2% Black 1%
- Common ancestry
- Portuguese 5% Iranian 4% Slovak 3%
- Foreign-born
- 2% · Canada
- Languages at home
- 98% English-only · Spanish 1% German/W. Germanic 1%
Political lean MEDSL · Buchanan
- 2024 margin
- Strong R (+28.2) · D 35.1% · R 63.4% · Other 1.5%
- 2008→2024 swing
- -46.7pp toward R · 2008: 18.5pp · 2024: -28.2pp
- All cycles
- 2024: R+28.2 2020: R+20.9 2016: R+15.2 2012: D+13.9 2008: D+18.5
Not yet ingested
- Civics
- —
Market trends
- HPI YoY
- ▼ -61.31%
- Current HPI
- 190.6265
- Rent YoY
- —
- Metro
- —
- State GDP YoY
- ▲ 2.48%
- F500 in state
- 4
Industry mix (Fortune 500 HQ in IA)
| Industry | F500 HQs | Revenue |
|---|---|---|
| Financial Services | 1 | $16B |
|
||
| Retail / Convenience | 1 | $15B |
|
||
Property tax history
-5.9%/yrLatest (2025): $484 · -18.8% YoY. Source: county tax records.
Cash-flow waterfall
monthlySold comps — $/sqft
last 12 mo · ≤1 miLoading sold comps…