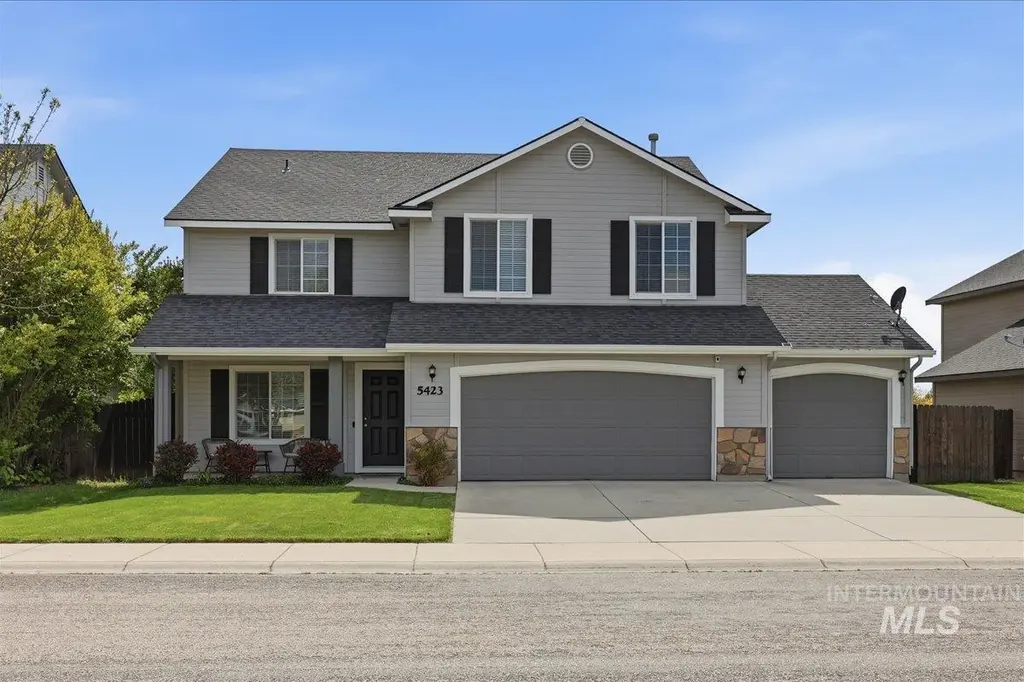
5423 N Isla Ave · Meridian, ID
Flood risk 1/10 · Minimal
- FEMA flood zone
- X (unshaded)
- Chance of flooding over 30 yrs
- 0.0%
- Est. flood insurance / yr
- $507 – $1,088
Fire risk 5/10 · Moderate
- Est. fire insurance / yr
- $584 – $1,086
Heat risk 5/10 · Moderate
- Hot days now (above 97°F)
- 7 days/yr
- Hot days in 30 yrs
- 17 days/yr
Wind risk 1/10 · Minimal
- Chance of severe wind over 30 yrs
- —
Air-quality risk 9/10 · Severe
- Unhealthy air days now
- 19 days/yr
- Unhealthy air days in 30 yrs
- 20 days/yr
Risk factors via First Street. Map © Google.
Why this score? — see what drove the C grade
The composite is a weighted blend of 9 inputs, each scored 0–100. Each bar is that input's sub-score; the figure is the points it added to the 100-point composite (weight × sub-score).
- Cash flow +17.5/30.0
- ARV discount +13.5/15.0
- DSCR +5.5/10.0
- Schools +5.2/10.0
- Livability +4.1/5.0
- 1% rule +3.6/10.0
- Rent growth +3.6/5.0
- Condition / age +2.5/5.0
- Appreciation +0.0/10.0
$585,000
🖨 Deal sheet 📄 Offer letter ✓ Due diligence
Listing remarks
Beautiful 5 bed, 2.5 bath home with a 3-car garage in the highly desirable Ventana community! This popular Sundance floor plan offers a great mix of space and functionality with a main-level bedroom that’s perfect for guests or a home office. The open-concept layout features a spacious living room, dining area, and a large kitchen with center island, stainless steel appliances, and plenty of room to gather. Upstairs offers 4 additional bedrooms plus a loft, ideal for a second living space, playroom, or flex area. The primary suite includes a soaker tub, dual vanities, and a walk-in closet. Secondary bedrooms are generously sized, with great storage throughout. The home has been well c
Key facts
- Main-level bedroom
- Loft
- Large kitchen
Tags
Property features AI
Finance
- HOA & community: Association fee required — $383.25 semi-annually; Community pool (HOA amenity)
Exterior
- Parking: Attached garage with 3 covered spaces; Finished driveway; Total parking for 3 vehicles
- Utilities: City water service; Sewer connected; Natural gas available
- Home design: Single-family residence; Built in 2009; Frame construction with wood siding; Composition roof; Public road with paved frontage; Standard residential lot (6000–9999 SF)
- Construction: Built in 2009; Frame construction with wood siding; Composition roof
- Exterior features: Wood full fencing; Auto sprinkler system / irrigation available; Community pool
Interior
- Kitchen: Kitchen on main level; Kitchen island; Pantry; Breakfast bar; Dishwasher; Disposal; Microwave; Freestanding oven/range
- Bedrooms: 5 bedrooms — primary and four bedrooms upstairs; one bedroom on the main level
- Flooring: Carpet
- Bathrooms: 3 bathrooms
- Heating & cooling: Forced air heating (natural gas); No central cooling listed
- Interior features: Master bathroom; Walk-in closets; Breakfast bar; Pantry; Kitchen island; Gas fireplace
- Laundry & utility: Utility room on main level (approx. 11 x 6); Gas water heater
Neighborhood map
What this means for you Summary
Snapshot
- This is a 5-bed/3.0-bath single-family listed at $585k.
Deal economics
- At list price, monthly cash flow is $449 ($5k/yr) — positive.
- The deal already cash-flows at list — no discount required.
- To meet the 1% rule (rent ≥ 1% of price), the offer needs to be $503k (14.0% below list).
- Recommended offer: $503k (14.0% below list) — sets the bar for 1% rule.
- Cap rate 7.2% vs local median 3.1% in Meridian — top-decile yield for the area; either an underpriced asset or a hidden risk that comps aren't pricing in. Stress-test before assuming the spread holds.
Location & tenants
- Location reads 82/100 on livability (#10 in ID, #1,176 nationally) — a professional / high-income tenant draw. Strengths: crime A+, commute A+, employment A+; Watch: cost of living D+.
- Joint School District No. 2 (suburban): math 53% / reading 67% proficiency, ranked #11 of 92 in ID (top 12%) — acceptable for families but not a draw, mixed tenant base, ~2y average lease.
- Zoned schools: Prospect Elementary School (math 63% / reading 60%, grade B, #68 of 357 statewide, top 19%, 532 students, 15% FRL); Rocky Mountain High School (math 47% / reading 76%, grade B-, #18 of 169 statewide, top 10%, 1,917 students, 8% FRL).
- Market conditions: Rents rising fast (+4.2%/yr); 893 active listings in the ZIP; 3 comparable units currently listed for rent nearby; rentals leasing fast (median 12d on market — plan ~1-2 weeks tenant-placement turnaround); solid renter incomes; 5,129 units permitted in Ada County in 2024 (414 in 5+ unit buildings).
- At $5,033/mo this rent would consume 59% of the median local household income ($103k/yr) (locally 1017% of renters already pay >50% of income on rent) — very limited rent-growth headroom before tenants either downsize or default.
Forward outlook
- Local home prices are declining (-3.0%/yr); year-one equity from $4k of loan paydown is wiped out by about $18k of value loss. Plan a longer hold.
- Ada County population projected at +45% by 2050 — long-run rental-demand tailwind backs the buy-and-hold thesis.
Negotiation context
- Only 4 days on market — expect competitive offers; lowballing is unlikely to land.
- 8 sale attempts since 17y ago with the ask held roughly flat each time — persistent listings suggest the price (not the market) is what's stuck; bring a comps-based counter.
- Current owner paid $269k; list at $585k implies a 118% gain — meaningful room to come down on a strong offer.
Risks & watch-outs
- Climate carrying-cost: moderate wildfire risk; extreme-heat days projected 7→17/yr by 2055 (HVAC capex compounding) — expect insurance premiums to compound above CPI over the hold.
Questions for the listing agent
- What does the HOA fee cover, when was the last increase, and are there any pending special assessments or reserve-fund shortfalls?
- Is there a deadline driving the sale (1031 exchange, divorce, estate, relocation)? That informs how much negotiation room exists.
- Schools are A-rated — typically a magnet for longer-tenancy family renters. What's the average tenant stay here, and is there a school-zone premium baked into asking?
- What's the average days-on-market for RENTAL listings here right now (not sales)? A rising rental-DOM trend means longer vacancies and softer asking-rent achievability than the comps imply.
- What's the recent tenant-quality profile in this submarket — average credit score on applications, eviction rate, late-payment / NSF rate, and stable-employment percentage? A property-management company in the area should have these aggregated.
- How much new for-sale + rental construction is in the pipeline within 1–3 miles? Heavy new supply typically softens prices + rents 12–24 months out; constrained supply supports both.
Investment metrics
- 1% rule
- 0.86% ✗
- Cap rate
- 7.21%
- Cash-on-cash
- 3.29%
- DSCR
- 1.15
- GRM
- 9.7
CMA / ARV
- ARV (on-the-fly)
- $675,148
- Comps found
- 12
Show comp detail 12 sales within ~0.75 mi
| Address | Dist | Beds/Ba | Sqft | Sold | Price | $/sf | Match |
|---|---|---|---|---|---|---|---|
| 5423 N Isla Ave | 0.00mi | 5/2.5 | 2,767 (0%) | 1mo | $585,000 | $211 | 97 |
| 5363 N Red Hills Pl | 0.24mi | 4/3.0 (-1) | 2,686 (-3%) | 2mo | $724,900 | $270 | 78 |
| 432 W Broderick | 0.47mi | 4/2.5 (-1) | 2,740 (-1%) | 0mo | $749,900 | $274 | 69 |
| 891 E Silver Torch St | 0.46mi | 5/2.5 | 2,895 (+5%) | 2mo | $699,000 | $241 | 67 |
| 5455 Peppard Ave | 0.23mi | 4/2.5 (-1) | 2,524 (-9%) | 1mo | $649,900 | $257 | 67 |
| 834 W Crosby Dr | 0.67mi | 4/3.0 (-1) | 2,746 (-1%) | 1mo | $750,000 | $273 | 62 |
| 4481 N Diamond Crk | 0.59mi | 4/2.5 (-1) | 2,826 (+2%) | 1mo | $635,000 | $225 | 61 |
| 489 W Dreyfuss St | 0.48mi | 4/3.0 (-1) | 2,965 (+7%) | 1mo | $707,700 | $239 | 60 |
| 5832 N Claret Cup Way | 0.29mi | 4/2.0 (-1) | 2,439 (-12%) | 1mo | $725,000 | $297 | 57 |
| 514 W Black Rock Dr | 0.70mi | 4/2.5 (-1) | 2,937 (+6%) | 1mo | $639,900 | $218 | 49 |
| 815 W Arnaz | 0.64mi | 5/2.5 | 3,093 (+12%) | 0mo | $749,000 | $242 | 48 |
| 4364 N Portage Ave | 0.75mi | 4/3.0 (-1) | 2,373 (-14%) | 0mo | $579,900 | $244 | 36 |
Match score weights: distance 35% · size 25% · config 20% · recency 20%. Top-matched comps best support the ARV.
Projected returns pro-forma
-3.0% appreciation · 4.21% rent growth · sell at horizon
- IRR
- -10.0%
- Equity multiple
- 0.63×
- Total profit
- $-60,218
- Equity at exit
- $87,225
- IRR
- 0.8%
- Equity multiple
- 1.06×
- Total profit
- $9,512
- Equity at exit
- $50,580
Cash invested: $163,800 (down + closing). Projections, not guarantees.
Landlord ↔ Tenant lean methodology
- Overall (STATE)
- 91 Strongly Landlord-Friendly
- State Idaho
- 91 Strongly Landlord-Friendly · R+18
- County
- — inherits STATE
- City
- — inherits STATE
ZIP-level market 83646
- Home prices YoY
- -33.6%
- Rents YoY
- 4.2%
- Active inventory
- 893
- Price-to-rent
- 9.7×
Monthly cashflow live
- Estimated rent
- $5,033 medium interval (Pro) →
- Mortgage (P&I)
- −$3,068
- Tax from tax record
- −$151 /mo · $1,810/yr
- Insurance
- −$244
- HOA
- −$64
- Vacancy / Maint / Mgmt
- −$1,057
- Net cashflow
- $449
Break-even live
UW: 25.0% down · 7.5% · 30yr · 1.5% tax · 5.0% vac · 8.0% maint · 8.0% mgmt
Financing live
Cash to close
- Down payment
- $146,250
- Closing costs
- $17,550
- Reserves months
- —
- Total cash needed
- —
Loan-product check · same deal, 3 products live
Conventional
25% down · 7.5% · 30yr
- Down + closing
- —
- Monthly P&I
- —
- Monthly cashflow
- —
- DSCR
- —
- Eligible?
- —
Personal DTI + credit; lowest rate.
DSCR
20% down · 8.5% · 30yr
- Down + closing
- —
- Monthly P&I
- —
- Monthly cashflow
- —
- DSCR
- —
- Eligible?
- —
No personal income docs; deal must DSCR.
Hard money
10% down · 12.0% · 12mo
- Down + closing
- —
- Monthly P&I
- —
- Monthly cashflow
- —
- DSCR
- —
- Eligible?
- —
Short-term bridge; refi at stabilization.
Rent comps 3 comps
| Address | Beds | Baths | Sqft | Rent | $/sqft | DOM | Units | Dist |
|---|---|---|---|---|---|---|---|---|
| 5327 N Red Hills Pl Unit 1460932P Meridian, ID | 5.0 | 2.5 | 3390 | $7,384 | $2.18 | 14d | 1 | 0.29mi |
| 236 W Wausau St Meridian, ID | 4.0 | 2.5 | 2692 | $2,795 | $1.04 | 11d | 1 | 0.75mi |
| 1781 W Milazzo St Meridian, ID | 4.0 | 2.5 | 2501 | $3,100 | $1.24 | 3d | 1 | 1.35mi |
HOA detail
- Monthly dues
- $64 · $768/yr
Listing history 17 events
-
2026-05-28price $585,000
-
2026-05-04status Pending
-
2026-04-30$579,000 Active
-
2025-06-23historical
-
2025-05-31price $574,900
-
2025-05-16$585,000 Active
-
2021-10-01historical
-
2021-09-18$594,500 Active
-
2018-04-05soldstatus $268,750
-
2018-04-04soldstatus Sold
-
2018-03-06status Pending
-
2018-03-03$309,990 Active
-
2011-12-30soldstatus
-
2011-09-29$185,990
-
2011-02-22$185,990
-
2010-10-26$174,686
-
2009-05-18$189,686
ⓘ Source: listings_history table (triggers on properties + properties_extension) + one-shot
backfill from property_details.listing_events for pre-trigger history.
Tax reassessment forecast ID · Resets to sale price
- Current annual tax
- $1,810 · $151/mo
- Projected year-2 tax
- $4,036 · $336/mo
- Expected delta
- +$2,227/yr (+$186/mo · 123.1%)
ⓘ Screening estimate from a state-policy table — verify with the county assessor before closing.
Climate risk First Street
- Flood 1/10 Low FEMA zone X (unshaded) · 0% chance over 30 yrs
- Wildfire 5/10 Major
- Heat 5/10 Major 7 d/yr ≥97°F today · 17 d/yr by 30 yrs out
- Wind 1/10 Low
- Air quality 9/10 Extreme 19 unhealthy d/yr today · 20 by 30 yrs out
Nearby sold comps map
Loading sold comps map…
Walkable amenities ~0.75 mi
Loading nearby amenities…
Taxation est. · year 1
- Rental income
- $60,390
- − Mortgage interest
- −$32,769
- − Property taxes
- −$1,810
- − Insurance
- −$2,925
- − Repairs & maintenance
- −$4,831
- − Management
- −$4,831
- − HOA
- −$768
- − Depreciation
- −$17,018
- Taxable loss
- −$4,562
- Est. tax savings @ 24.0%
- +$1,095
- After-tax cash flow
- $6,487/yr
For passive investors: Depreciation is non-cash, so a rental often shows a tax loss while cash-flowing — sheltering income. Rental losses are passive: they offset passive income freely, and up to $25,000/yr can offset ordinary (W-2) income if you actively participate and your MAGI is under $100k (phasing out to $0 by $150k); unused losses carry forward. On sale, claimed depreciation is recaptured at up to 25%, and gains may owe capital-gains tax (a 1031 exchange can defer both). Figures are a year-1 estimate at your 24.0% rate — not tax advice; consult a CPA.
Schools (NCES district)
- District
- Joint School District No. 2
- NCES district ID
- 1602100
- Math proficiency
- 53% ▼ -6.00%
- Reading proficiency
- 67% ▼ -1.00%
- Median HH income
- $64,573
- Composite
- 52.42/100
- National rank
- #1576
- State rank
- #11 of 92 in ID
Livability — Meridian
- Score
- 82/100
- State rank
- #10
- US rank
- #1176
Category grades
Schools grade is shown separately in the Schools card above.
Census & demographics
- Census place
- Meridian, ID
- County
- Ada County · 522,161 people
- City population
- 138,302
- Metro
- Boise City, ID
- Population (ZIP)
- 76,023
- Household income
- $102,861
- Rent vs Own
- Severe rent burden
- 1017.0
Population outlook (Ada County) Hauer SSP2
- Today (2025)
- 535,818 people
- By 2030
- 585,751 · +9.3%
- By 2040
- 682,435 · +27.4%
- By 2050
- 775,818 · +44.8%
- By 2075
- 994,458 · +85.6%
- By 2100
- 1,148,884 · +114.4%
Race, ethnicity, and origin ACS 2023
- Neighborhood character
- Predominantly White (81%)
- Race & ethnicity
- White 81% Two or more races 10% Hispanic / Latino 9% Black 2% Asian 2%
- Hispanic origin (detail)
- Mexican 7%
- Common ancestry
- Italian 3% Portuguese 3% Slovak 2%
- Foreign-born
- 4% · Canada
- Languages at home
- 93% English-only · Spanish 3% Russian/Polish/Slavic 1%
Political lean MEDSL · Ada
- 2024 margin
- R (+10.3) · D 43.4% · R 53.8% · Other 2.8%
- 2008→2024 swing
- -4.2pp toward R · 2008: -6.2pp · 2024: -10.3pp
- All cycles
- 2024: R+10.3 2020: R+3.9 2016: R+9.2 2012: R+11.3 2008: R+6.2
Not yet ingested
- Civics
- —
Market trends
- HPI YoY
- ▼ -161.13%
- Current HPI
- 318.2697
- Rent YoY
- ▲ 4.21%
- Metro
- Boise City, ID
- State GDP YoY
- ▲ 4.51%
- F500 in state
- 6
Industry mix (Fortune 500 HQ in ID)
| Industry | F500 HQs | Revenue |
|---|---|---|
| Retail | 1 | $79B |
|
||
| Technology | 1 | $25B |
|
||
| Food / Agriculture | 1 | $6B |
|
||
Price history
+208.4% since first listed17 events — show timeline
- 2026-05-28 Price Changed $585,000 IMLS
- 2026-05-04 Pending — IMLS
- 2026-04-30 Listed $579,000 IMLS
- 2025-06-23 Listing Removed — IMLS
- 2025-05-31 Price Changed $574,900 IMLS
- 2025-05-16 Listed $585,000 IMLS
- 2021-10-01 Listing Removed — IMLS
- 2021-09-18 Listed $594,500 IMLS
- 2018-04-05 Sold (Public Records) $268,750 Public Records
- 2018-04-04 Sold (MLS) — IMLS
- 2018-03-06 Pending — IMLS
- 2018-03-03 Listed $309,990 IMLS
- 2011-12-30 Sold (Public Records) — Public Records
- 2011-09-29 Listed $185,990 IMLS
- 2011-02-22 Listed $185,990 IMLS
- 2010-10-26 Listed $174,686 IMLS
- 2009-05-18 Listed $189,686 IMLS
Property tax history
-4.0%/yrLatest (2025): $1,810 · -3.9% YoY. Source: county tax records.
Cash-flow waterfall
monthlySold comps — $/sqft
last 12 mo · ≤1 miLoading sold comps…