2192 Mcray · Springdale, AR
Flood risk 1/10 · Minimal
- FEMA flood zone
- X (unshaded)
- Chance of flooding over 30 yrs
- 0.0%
- Est. flood insurance / yr
- $507 – $1,088
Fire risk 4/10 · Minor
- Est. fire insurance / yr
- $1,499 – $2,785
Heat risk 5/10 · Moderate
- Hot days now (above 106°F)
- 7 days/yr
- Hot days in 30 yrs
- 20 days/yr
Wind risk 2/10 · Minimal
- Chance of severe wind over 30 yrs
- 2.0%
Air-quality risk 1/10 · Minimal
- Unhealthy air days now
- 0 days/yr
- Unhealthy air days in 30 yrs
- 0 days/yr
Risk factors via First Street. Map © Google.
Why this score? — see what drove the B- grade
The composite is a weighted blend of 9 inputs, each scored 0–100. Each bar is that input's sub-score; the figure is the points it added to the 100-point composite (weight × sub-score).
- Cash flow +28.7/30.0
- DSCR +10.0/10.0
- ARV discount +7.5/15.0
- 1% rule +7.2/10.0
- Livability +3.5/5.0
- Rent growth +3.2/5.0
- Schools +3.1/10.0
- Condition / age +2.5/5.0
- Appreciation +0.0/10.0
$150,000
🖨 Deal sheet 📄 Offer letter ✓ Due diligence
Listing remarks
FIXER UPPER. Financing to be Conventional or Cash only as property is selling "AS IS, WHERE IS. No Property Disclosure as owner has deceased. All offers need to state: Subject to approval of Probate Court of Washington County, Arkansas, and have proof of funds attached. Bedroom#3 & Den along with 2nd kitchen would make a great mother-in-law apartment or area for teenagers.
Key facts
- 2nd kitchen
- 0.26 acre lot
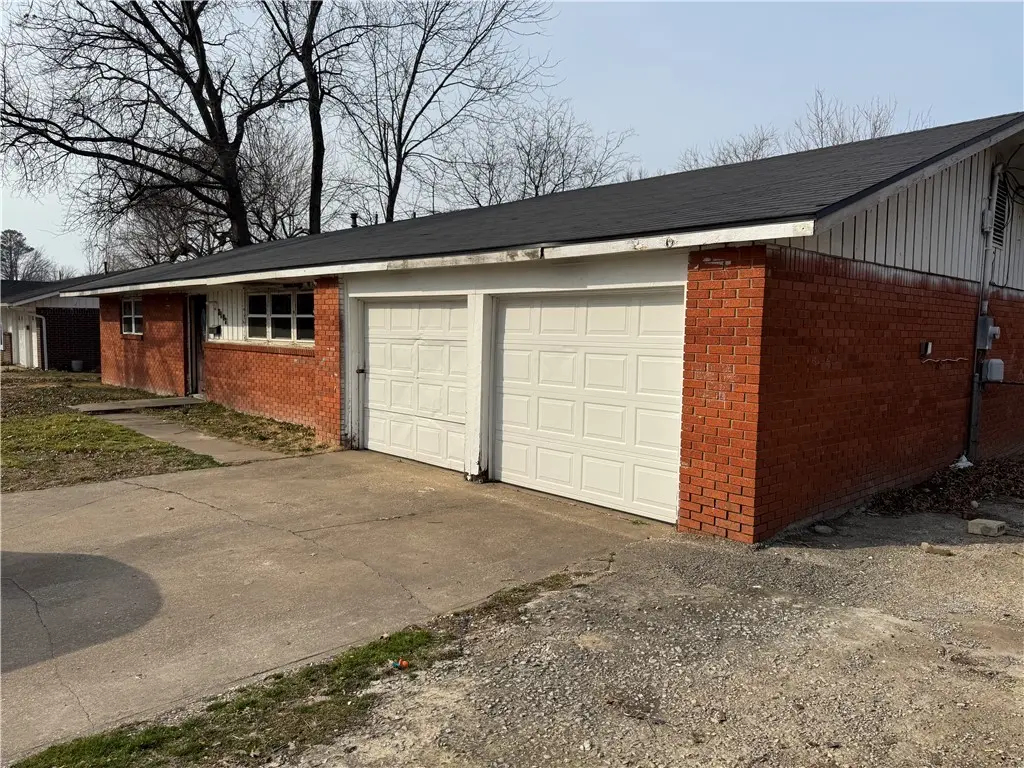
- Garage
Tags
Property features AI
Finance
- HOA & community: Monthly association fee applies; Near hospital; Near schools
Exterior
- Parking: Attached garage; 2 covered spaces
- Utilities: Electricity available; Natural gas available; Public water; Public sewer
- Home design: Single-story; Primary construction of brick, frame and Masonite; Asphalt shingle roof; Built 25+ years ago; Slab foundation
- Construction: Brick, frame and Masonite construction; Asphalt shingle roof; Slab foundation; Built 25+ years ago
- Exterior features: Concrete driveway; Patio; Chain link fencing; Level city lot in a subdivision; Public paved road frontage
Interior
- Flooring: Laminate
- Bathrooms: 2 full bathrooms
- Heating & cooling: Central heating; Gas heating
- Interior features: Ceiling fan(s); Laminate flooring
- Laundry & utility: Washer hookup; Dryer hookup; Gas water heater
Neighborhood map
What this means for you Summary
Snapshot
- This is a 3-bed/2.0-bath single-family listed at $150k.
Deal economics
- At list price, monthly cash flow is $499 ($6k/yr) — positive.
- The deal already cash-flows at list — no discount required.
- Meets the 1% rule at list price ($2k rent vs $150k).
- Cap rate 10.3% vs local median 3.3% in Springdale — top-decile yield for the area; either an underpriced asset or a hidden risk that comps aren't pricing in. Stress-test before assuming the spread holds.
Location & tenants
- Location reads 70/100 on livability (#48 in AR) — a middle-class / working-renter tenant base. Strengths: cost of living A+, housing A+, health & safety A+; Watch: schools D+, commute D+, employment D+.
- Springdale School District (urban): math 38% / reading 35% proficiency, ranked #100 of 238 in AR (top 42%) — families likely to look elsewhere, expect single-tenant / working-renter base with shorter leases.
- Market conditions: Rents rising (+2.7%/yr); 695 active listings in the ZIP; 7 comparable units currently listed for rent nearby; rentals at typical pace (median 23d on market — plan ~3-4 weeks tenant-placement turnaround); solid renter incomes; 3,494 units permitted in Washington County in 2024 (1,497 in 5+ unit buildings).
Forward outlook
- Local home prices are declining (-3.0%/yr); year-one equity from $1k of loan paydown is wiped out by about $4k of value loss. Plan a longer hold.
- Washington County population projected at +47% by 2050 — long-run rental-demand tailwind backs the buy-and-hold thesis.
- At projected returns (-3.0% appreciation + 2.7% rent growth), your $42k cash investment doubles in ~9 years — after that, you're playing with house money.
Negotiation context
- Only 3 days on market — expect competitive offers; lowballing is unlikely to land.
- Current owner paid $68k; list at $150k implies a 121% gain — meaningful room to come down on a strong offer.
Risks & watch-outs
- Climate carrying-cost: extreme-heat days projected 7→20/yr by 2055 (HVAC capex compounding) — expect insurance premiums to compound above CPI over the hold.
Questions for the listing agent
- Built in 1961 — when were the roof, HVAC, electrical panel, plumbing, and water heater last replaced?
- Is there a deadline driving the sale (1031 exchange, divorce, estate, relocation)? That informs how much negotiation room exists.
- Schools are D-rated, which usually means shorter tenancies and higher turnover. Who's the typical renter profile here, and what's been the actual vacancy rate?
- Crime grade is D in this area — have there been break-ins, vandalism, or insurance claims at this property in the last 3 years? What carrier currently insures it and at what premium?
- What's the average days-on-market for RENTAL listings here right now (not sales)? A rising rental-DOM trend means longer vacancies and softer asking-rent achievability than the comps imply.
- What's the recent tenant-quality profile in this submarket — average credit score on applications, eviction rate, late-payment / NSF rate, and stable-employment percentage? A property-management company in the area should have these aggregated.
- How much new for-sale + rental construction is in the pipeline within 1–3 miles? Heavy new supply typically softens prices + rents 12–24 months out; constrained supply supports both.
Investment metrics
- 1% rule
- 1.22% ✓
- Cap rate
- 10.29%
- Cash-on-cash
- 14.26%
- DSCR
- 1.63
- GRM
- 6.8
CMA / ARV
- ARV (on-the-fly)
- $312,900
- Comps found
- 12
Show comp detail 12 sales within ~0.75 mi
| Address | Dist | Beds/Ba | Sqft | Sold | Price | $/sf | Match |
|---|---|---|---|---|---|---|---|
| 2192 Mcray | 0.00mi | 3/2.0 | 1,788 (0%) | 1mo | $156,200 | $87 | 100 |
| 1807 Westwood Ave | 0.15mi | 3/1.5 | 1,858 (+4%) | 2mo | $272,000 | $146 | 83 |
| 2003 Dee Ave | 0.15mi | 4/2.0 (+1) | 1,685 (-6%) | 2mo | $305,610 | $181 | 77 |
| 713 Carlton St | 0.38mi | 4/2.0 (+1) | 1,732 (-3%) | 1mo | $310,000 | $179 | 71 |
| 469 Brandon's Loop | 0.60mi | 4/2.0 (+1) | 1,673 (-6%) | 2mo | $340,000 | $203 | 55 |
| 1703 W Emma Ave | 0.31mi | 4/2.5 (+1) | 2,048 (+14%) | 1mo | $355,000 | $173 | 54 |
| 126 Rogers Circle Dr | 0.44mi | 3/2.5 | 2,032 (+14%) | 1mo | $333,000 | $164 | 54 |
| 1902 Melissa Ln | 0.70mi | 4/2.5 (+1) | 1,750 (-2%) | 4mo | $312,000 | $178 | 54 |
| 406 Pleasant St | 0.62mi | 3/1.5 | 1,610 (-10%) | 1mo | $315,000 | $196 | 51 |
| 1713 W Huntsville Ave | 0.48mi | 4/2.0 (+1) | 2,026 (+13%) | 3mo | $245,000 | $121 | 48 |
| 301 Michael St | 0.57mi | 4/2.5 (+1) | 1,998 (+12%) | 3mo | $317,000 | $159 | 44 |
| 2002 Melissa Ln | 0.70mi | 4/2.0 (+1) | 1,572 (-12%) | 1mo | $275,000 | $175 | 41 |
Match score weights: distance 35% · size 25% · config 20% · recency 20%. Top-matched comps best support the ARV.
Projected returns pro-forma
-3.0% appreciation · 2.7% rent growth · sell at horizon
- IRR
- 4.3%
- Equity multiple
- 1.16×
- Total profit
- $6,908
- Equity at exit
- $22,365
- IRR
- 13.5%
- Equity multiple
- 2.06×
- Total profit
- $44,595
- Equity at exit
- $12,969
Cash invested: $42,000 (down + closing). Projections, not guarantees.
Landlord ↔ Tenant lean methodology
- Overall (STATE)
- 92 Strongly Landlord-Friendly
- State Arkansas
- 92 Strongly Landlord-Friendly · R+14
- County
- — inherits STATE
- City
- — inherits STATE
ZIP-level market 72762
- Rents YoY
- 2.7%
- Active inventory
- 695
- Price-to-rent
- 6.8×
Monthly cashflow live
- Estimated rent
- $1,829 high interval (Pro) →
- Mortgage (P&I)
- −$787
- Tax from tax record
- −$96 /mo · $1,157/yr
- Insurance
- −$62
- HOA
- −$0
- Vacancy / Maint / Mgmt
- −$384
- Net cashflow
- $499
Break-even live
UW: 25.0% down · 7.5% · 30yr · 1.5% tax · 5.0% vac · 8.0% maint · 8.0% mgmt
Financing live
Cash to close
- Down payment
- $37,500
- Closing costs
- $4,500
- Reserves months
- —
- Total cash needed
- —
Loan-product check · same deal, 3 products live
Conventional
25% down · 7.5% · 30yr
- Down + closing
- —
- Monthly P&I
- —
- Monthly cashflow
- —
- DSCR
- —
- Eligible?
- —
Personal DTI + credit; lowest rate.
DSCR
20% down · 8.5% · 30yr
- Down + closing
- —
- Monthly P&I
- —
- Monthly cashflow
- —
- DSCR
- —
- Eligible?
- —
No personal income docs; deal must DSCR.
Hard money
10% down · 12.0% · 12mo
- Down + closing
- —
- Monthly P&I
- —
- Monthly cashflow
- —
- DSCR
- —
- Eligible?
- —
Short-term bridge; refi at stabilization.
Rent comps 7 comps
| Address | Beds | Baths | Sqft | Rent | $/sqft | DOM | Units | Dist |
|---|---|---|---|---|---|---|---|---|
| 303 Harve St Springdale, AR | 3.0 | 1.0 | 1312 | $1,550 | $1.18 | 23d | 1 | 0.31mi |
| 257 Arborside Rd Springdale, AR | 1.0–2.0 | 1.0–2.5 | 1022 | $1,575 | $1.54 | 13d | 10 | 0.36mi |
| 574 Westford St Springdale, AR | 3.0 | 2.0 | 1656 | $1,850 | $1.12 | 43d | 1 | 1.04mi |
| 302 S Shiloh St Unit 1475799P Springdale, AR | 2.0 | 1.5 | 2281 | $8,581 | $3.76 | 23d | 1 | 1.09mi |
| 303 Grove Ave Unit 1221802P Springdale, AR | 3.0 | 2.0 | 1614 | $4,225 | $2.62 | 21d | 1 | 1.15mi |
| 3006 Scott Ln Springdale, AR | 3.0 | 2.0 | 1736 | $2,100 | $1.21 | 23d | 1 | 1.21mi |
| 1707 Phillips Dr Springdale, AR | 3.0 | 2.0 | 1519 | $1,745 | $1.15 | 23d | 1 | 1.27mi |
Listing history 3 events
-
2026-04-11status Pending
-
2026-04-07$150,000 Active
-
2001-04-10soldstatus $68,000
ⓘ Source: listings_history table (triggers on properties + properties_extension) + one-shot
backfill from property_details.listing_events for pre-trigger history.
Tax reassessment forecast AR · Resets to sale price
- Current annual tax
- $1,157 · $96/mo
- Projected year-2 tax
- $1,157 · $96/mo
- Expected delta
- $0/yr ($0/mo · 0.0%)
ⓘ Screening estimate from a state-policy table — verify with the county assessor before closing.
Climate risk First Street
- Flood 1/10 Low FEMA zone X (unshaded) · 0% chance over 30 yrs
- Wildfire 4/10 Moderate
- Heat 5/10 Major 7 d/yr ≥106°F today · 20 d/yr by 30 yrs out
- Wind 2/10 Low 2% chance of damaging wind over 30 yrs
- Air quality 1/10 Low 0 unhealthy d/yr today · 0 by 30 yrs out
Nearby sold comps map
Loading sold comps map…
Walkable amenities ~0.75 mi
Loading nearby amenities…
Taxation est. · year 1
- Rental income
- $21,945
- − Mortgage interest
- −$8,402
- − Property taxes
- −$1,157
- − Insurance
- −$750
- − Repairs & maintenance
- −$1,756
- − Management
- −$1,756
- − Depreciation
- −$4,364
- Taxable income
- $3,761
- Est. tax owed @ 24.0%
- −$903
- After-tax cash flow
- $5,088/yr
For passive investors: Depreciation is non-cash, so a rental often shows a tax loss while cash-flowing — sheltering income. Rental losses are passive: they offset passive income freely, and up to $25,000/yr can offset ordinary (W-2) income if you actively participate and your MAGI is under $100k (phasing out to $0 by $150k); unused losses carry forward. On sale, claimed depreciation is recaptured at up to 25%, and gains may owe capital-gains tax (a 1031 exchange can defer both). Figures are a year-1 estimate at your 24.0% rate — not tax advice; consult a CPA.
Schools (NCES district)
- District
- Springdale School District
- NCES district ID
- 0512660
- Math proficiency
- 38% ▼ -11.00%
- Reading proficiency
- 35% ▼ -6.00%
- Median HH income
- $45,469
- Composite
- 31.18/100
- National rank
- #6046
- State rank
- #100 of 238 in AR
Livability — Springdale
- Score
- 70/100
- State rank
- #48
- US rank
- #7326
Category grades
Schools grade is shown separately in the Schools card above.
Census & demographics
- Census place
- Springdale, AR
- County
- Washington County · 252,056 people
- City population
- 104,811
- Metro
- Fayetteville-Springdale-Rogers, AR
- Population (ZIP)
- 46,092
- Household income
- $82,228
- Rent vs Own
- Severe rent burden
- 719.0
Population outlook (Washington County) Hauer SSP2
- Today (2025)
- 271,748 people
- By 2030
- 296,414 · +9.1%
- By 2040
- 346,874 · +27.6%
- By 2050
- 398,552 · +46.7%
- By 2075
- 523,309 · +92.6%
- By 2100
- 615,280 · +126.4%
Race, ethnicity, and origin ACS 2023
- Neighborhood character
- Diverse neighborhood (Simpson 0.62)
- Race & ethnicity
- White 55% Hispanic / Latino 27% Two or more races 23% Pacific Islander 3% Asian 2% Black 1%
- Hispanic origin (detail)
- Mexican 21%
- Common ancestry
- Italian 3% Slovak 2% Lithuanian 1%
- Foreign-born
- 15% · Canada, Jamaica
- Languages at home
- 75% English-only · Spanish 21% Other Asian/Pacific 3%
Political lean MEDSL · Washington
- 2024 margin
- Lean R (+6.7) · D 45.1% · R 51.7% · Other 3.2%
- 2008→2024 swing
- +6.4pp toward D · 2008: -13.1pp · 2024: -6.7pp
- All cycles
- 2024: R+6.7 2020: R+3.9 2016: R+10.4 2012: R+16.3 2008: R+13.1
Not yet ingested
- Civics
- —
Market trends
- HPI YoY
- ▼ -258.50%
- Current HPI
- 291.4661
- Rent YoY
- ▲ 2.70%
- Metro
- Fayetteville-Springdale-Rogers, AR
- State GDP YoY
- ▲ 3.80%
- F500 in state
- 10
Industry mix (Fortune 500 HQ in AR)
| Industry | F500 HQs | Revenue |
|---|---|---|
| Retail | 1 | $681B |
|
||
| Food / Agriculture | 1 | $53B |
|
||
| Retail / Energy | 1 | $22B |
|
||
| Transportation / Logistics | 1 | $12B |
|
||
| Energy | 1 | $4B |
|
||
Price history
+120.6% since first listed3 events — show timeline
- 2026-04-11 Pending — NWARMLS
- 2026-04-07 Listed $150,000 NWARMLS
- 2001-04-10 Sold (Public Records) $68,000 Public Records
Property tax history
+3.8%/yrLatest (2025): $1,157 · +110.5% YoY. Source: county tax records.
Cash-flow waterfall
monthlySold comps — $/sqft
last 12 mo · ≤1 miLoading sold comps…