 🏷️ Likely Rental
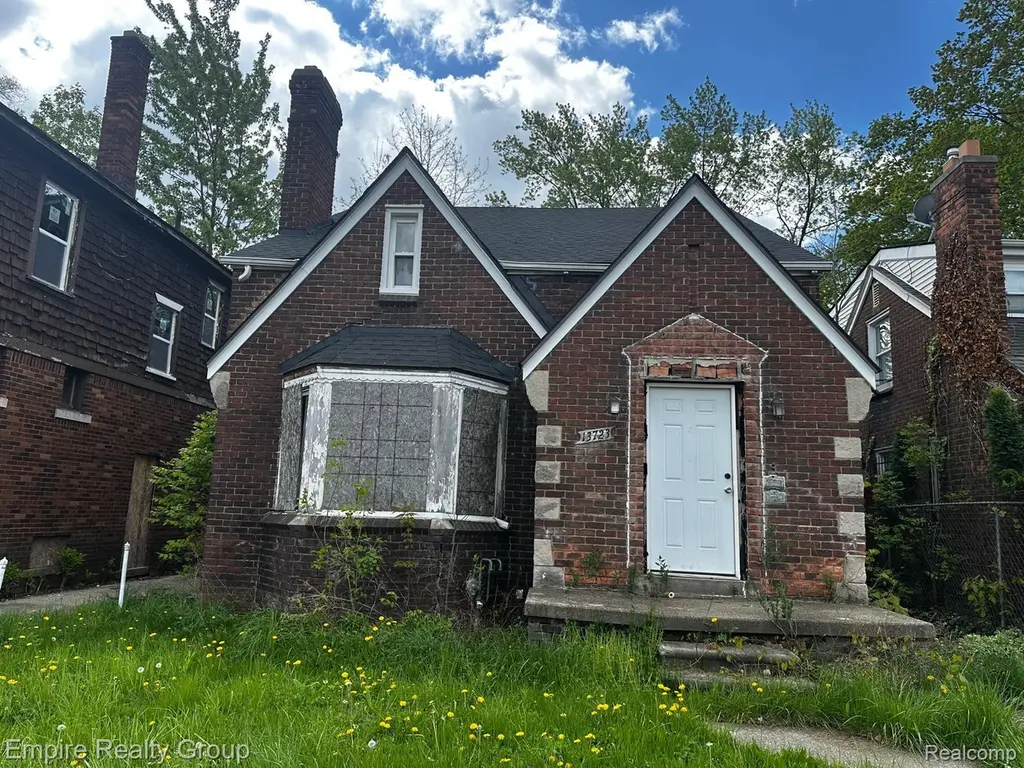
13723 Castleton St · Detroit, MI
Flood risk 1/10 · Minimal
- FEMA flood zone
- X (unshaded)
- Chance of flooding over 30 yrs
- 0.0%
- Est. flood insurance / yr
- $473 – $860
Fire risk 1/10 · Minimal
- Est. fire insurance / yr
- $784 – $1,456
Heat risk 3/10 · Minor
- Hot days now (above 97°F)
- 7 days/yr
- Hot days in 30 yrs
- 15 days/yr
Wind risk 2/10 · Minimal
- Chance of severe wind over 30 yrs
- —
Air-quality risk 3/10 · Minor
- Unhealthy air days now
- 2 days/yr
- Unhealthy air days in 30 yrs
- 5 days/yr
Risk factors via First Street. Map © Google.
Why this score? — see what drove the D grade
The composite is a weighted blend of 9 inputs, each scored 0–100. Each bar is that input's sub-score; the figure is the points it added to the 100-point composite (weight × sub-score).
- Cash flow +15.0/30.0
- ARV discount +7.5/15.0
- 1% rule +5.0/10.0
- DSCR +5.0/10.0
- Rent growth +3.9/5.0
- Livability +3.7/5.0
- Condition / age +2.5/5.0
- Schools +1.3/10.0
- Appreciation +0.0/10.0
$25,000
🖨 Deal sheet 📄 Offer letter ✓ Due diligence
Listing remarks MLS
Investor Opportunity – 13723 Castleton Attention investors! 13723 Castleton offers a strong opportunity for those seeking a value-add or buy-and-hold investment. The property features a functional layout with solid potential for renovation and improvement, allowing investors to maximize returns through strategic updates. Situated in an established neighborhood with ongoing rental demand, this property is well-positioned for long-term cash flow or resale after rehab. Convenient access to nearby amenities, schools, and major roads enhances tenant appeal and future resale value. Sold as-is. Back on the market due to previous buyer's financing falling through
Key facts
- 3,920 sq ft lot
- Built 1939
- Listed 7 days
Property features AI
Exterior
- Parking: No garage
- Utilities: Public water; Public sewer
- Home design: Single-family residential; One and one-half stories; Ground-level entry with steps; Brick construction
- Construction: Block foundation
- Exterior features: Paved road access; Lot dimensions approximately 35 x 114 (0.09 acres)
Interior
- Bathrooms: 2 full bathrooms
- Heating & cooling: Forced air heating (natural gas); No cooling
- Interior features: Unfinished basement; 4 total rooms
Neighborhood map
What this means for you Summary
Snapshot
- This is a 4-bed/1.5-bath single-family listed at $25k.
Deal economics
- At list price, monthly cash flow is $961 ($12k/yr) — positive.
- The deal already cash-flows at list — no discount required.
- Meets the 1% rule at list price ($1k rent vs $25k).
- Cap rate 52.4% vs local median 10.2% in Detroit — top-decile yield for the area; either an underpriced asset or a hidden risk that comps aren't pricing in. Stress-test before assuming the spread holds.
Location & tenants
- Location reads 73/100 on livability (#218 in MI) — a middle-class / working-renter tenant base. Strengths: amenities A+, commute A+, cost of living A+; Watch: schools F, crime F, employment F.
- Detroit Public Schools Community District (urban): math 10% / reading 24% proficiency, ranked #499 of 540 in MI (top 92%) — low school quality limits family demand, transient renter base, plan for 1-2y turnover; 90% free/reduced lunch — lower-income household profile, screen leases tightly.
- Market conditions: Rents rising fast (+5.6%/yr); 385 active listings in the ZIP; 22 comparable units currently listed for rent nearby; rentals at typical pace (median 25d on market — plan ~3-4 weeks tenant-placement turnaround); 41% of comp listings sitting > 30 days — soft ceiling on asking rent; lower-income renter base — watch delinquency; 2,639 units permitted in Wayne County in 2024 (1,216 in 5+ unit buildings).
- At $1,435/mo this rent would consume 47% of the median local household income ($37k/yr) (locally 2371% of renters already pay >50% of income on rent) — very limited rent-growth headroom before tenants either downsize or default.
Forward outlook
- Local home prices are declining (-3.0%/yr); year-one equity from $173 of loan paydown is wiped out by about $750 of value loss. Plan a longer hold.
- Wayne County population projected at -17% by 2050 — secular population decline; favor cash flow + early exit over multi-decade hold.
- At projected returns (-3.0% appreciation + 5.6% rent growth), your $7k cash investment doubles in ~1 year — after that, you're playing with house money.
Negotiation context
- Only 7 days on market — expect competitive offers; lowballing is unlikely to land.
- 17 sale attempts since 9y ago with the ask held roughly flat each time — persistent listings suggest the price (not the market) is what's stuck; bring a comps-based counter.
- Current owner paid $4k; list at $25k implies a 525% gain — meaningful room to come down on a strong offer.
Risks & watch-outs
- Watch-outs: built in 1939 — expect roof / HVAC / electrical / plumbing capex.
Questions for the listing agent
- Built in 1939 — when were the roof, HVAC, electrical panel, plumbing, and water heater last replaced?
- Is there a deadline driving the sale (1031 exchange, divorce, estate, relocation)? That informs how much negotiation room exists.
- Schools are F-rated, which usually means shorter tenancies and higher turnover. Who's the typical renter profile here, and what's been the actual vacancy rate?
- Crime grade is F in this area — have there been break-ins, vandalism, or insurance claims at this property in the last 3 years? What carrier currently insures it and at what premium?
- The area grade is low — what's the realistic commute time and amenity access for the typical tenant pool here? Any planned neighborhood developments (good or bad) we should know about?
- What's the average days-on-market for RENTAL listings here right now (not sales)? A rising rental-DOM trend means longer vacancies and softer asking-rent achievability than the comps imply.
- What's the recent tenant-quality profile in this submarket — average credit score on applications, eviction rate, late-payment / NSF rate, and stable-employment percentage? A property-management company in the area should have these aggregated.
- How much new for-sale + rental construction is in the pipeline within 1–3 miles? Heavy new supply typically softens prices + rents 12–24 months out; constrained supply supports both.
Investment metrics
- 1% rule
- 5.74% ✓
- Cap rate
- 52.41%
- Cash-on-cash
- 164.72%
- DSCR
- 8.33
- GRM
- 1.5
CMA / ARV
- ARV (median comp)
- $58,315
- List price
- $25,000
- Delta
- -57.13%
- Verdict
- UNDERPRICED
- Comps
- 20 within 1.0 mi
Show comp detail 12 sales within ~0.75 mi
| Address | Dist | Beds/Ba | Sqft | Sold | Price | $/sf | Match |
|---|---|---|---|---|---|---|---|
| 12090 Ward Ave | 0.39mi | 4/1.0 | 1,634 (-1%) | 14mo | $60,000 | $37 | 66 |
| 11327 Hartwell St | 0.38mi | 4/2.0 | 1,728 (+5%) | 9mo | $130,000 | $75 | 65 |
| 13660 Mecca St | 0.15mi | 3/1.0 (-1) | 1,509 (-8%) | 20mo | $73,000 | $48 | 55 |
| 13244 Ardmore St | 0.63mi | 4/2.0 | 1,650 (0%) | 18mo | $51,000 | $31 | 54 |
| 10038 Mark Twain St | 0.46mi | 4/1.0 | 1,860 (+13%) | 4mo | $47,000 | $25 | 52 |
| 10023 Hartwell St | 0.45mi | 3/1.0 (-1) | 1,619 (-2%) | 22mo | $50,000 | $31 | 51 |
| 10054 Littlefield St | 0.47mi | 5/2.0 (+1) | 1,562 (-5%) | 17mo | $60,000 | $38 | 48 |
| 9966 Ward St | 0.61mi | 3/2.5 (-1) | 1,764 (+7%) | 7mo | $55,000 | $31 | 45 |
| 13240 Hubbell St | 0.71mi | 3/2.0 (-1) | 1,612 (-2%) | 20mo | $65,000 | $40 | 39 |
| 11300 Ward St | 0.53mi | 4/2.0 | 1,878 (+14%) | 21mo | $40,000 | $21 | 32 |
| 11319 Hubbell St | 0.52mi | 3/2.0 (-1) | 1,424 (-14%) | 20mo | $110,000 | $77 | 29 |
| 9647 Sorrento St | 0.70mi | 3/1.0 (-1) | 1,489 (-10%) | 20mo | $25,000 | $17 | 27 |
Match score weights: distance 35% · size 25% · config 20% · recency 20%. Top-matched comps best support the ARV.
Projected returns pro-forma
-3.0% appreciation · 5.59% rent growth · sell at horizon
- IRR
- —
- Equity multiple
- 9.71×
- Total profit
- $61,005
- Equity at exit
- $3,728
- IRR
- —
- Equity multiple
- 22.23×
- Total profit
- $148,613
- Equity at exit
- $2,162
Cash invested: $7,000 (down + closing). Projections, not guarantees.
Landlord ↔ Tenant lean methodology
- Overall (STATE)
- 62 Landlord-Friendly
- State Michigan
- 62 Landlord-Friendly · EVEN
- County
- — inherits STATE
- City
- — inherits STATE
ZIP-level market 48227
- Rents YoY
- 5.6%
- Active inventory
- 385
- Price-to-rent
- 1.5×
Monthly cashflow live
- Estimated rent
- $1,435 high interval (Pro) →
- Mortgage (P&I)
- −$131
- Tax est. 1.5%
- −$31 /mo · $375/yr
- Insurance
- −$10
- HOA
- −$0
- Vacancy / Maint / Mgmt
- −$301
- Net cashflow
- $961
Break-even live
UW: 25.0% down · 7.5% · 30yr · 1.5% tax · 5.0% vac · 8.0% maint · 8.0% mgmt
Financing live
Cash to close
- Down payment
- $6,250
- Closing costs
- $750
- Reserves months
- —
- Total cash needed
- —
Loan-product check · same deal, 3 products live
Conventional
25% down · 7.5% · 30yr
- Down + closing
- —
- Monthly P&I
- —
- Monthly cashflow
- —
- DSCR
- —
- Eligible?
- —
Personal DTI + credit; lowest rate.
DSCR
20% down · 8.5% · 30yr
- Down + closing
- —
- Monthly P&I
- —
- Monthly cashflow
- —
- DSCR
- —
- Eligible?
- —
No personal income docs; deal must DSCR.
Hard money
10% down · 12.0% · 12mo
- Down + closing
- —
- Monthly P&I
- —
- Monthly cashflow
- —
- DSCR
- —
- Eligible?
- —
Short-term bridge; refi at stabilization.
Rent comps 22 comps
| Address | Beds | Baths | Sqft | Rent | $/sqft | DOM | Units | Dist |
|---|---|---|---|---|---|---|---|---|
| 11431 Marlowe St Detroit, MI | 3.0 | 1.0 | 1172 | $1,400 | $1.19 | 16d | 1 | 0.49mi |
| 12778 Strathmoor St Detroit, MI | 3.0 | 1.0 | 1597 | $1,150 | $0.72 | 5d | 1 | 0.55mi |
| 11634 Sussex St Detroit, MI | 3.0 | 1.0 | 1091 | $1,326 | $1.22 | 24d | 1 | 0.69mi |
| 13331 Strathmoor St Detroit, MI | 3.0 | 1.0 | 1084 | $1,100 | $1.01 | 16d | 1 | 0.76mi |
| 11397 Whitcomb St Detroit, MI | 3.0 | 1.0 | 1070 | $1,400 | $1.31 | 16d | 1 | 0.80mi |
| 10002 Manor Unit 2 Detroit, MI | 3.0 | 1.0 | 1100 | $1,150 | $1.05 | 43d | 1 | 0.83mi |
| 9501 Lauder St Detroit, MI | 3.0 | 2.0 | 1152 | $1,350 | $1.17 | 43d | 1 | 0.84mi |
| 9355 Ward St Detroit, MI | 3.0 | 1.0 | 1200 | $1,327 | $1.11 | 43d | 1 | 0.89mi |
| 13279 Coyle St Detroit, MI | 3.0 | 1.0 | 1444 | $1,373 | $0.95 | 43d | 1 | 0.91mi |
| 12650 Griggs St Detroit, MI | 3.0 | 2.0 | 1628 | $1,375 | $0.84 | 24d | 1 | 1.06mi |
| 12144 Washburn St Detroit, MI | 3.0 | 1.0 | 1200 | $1,200 | $1.00 | 15d | 1 | 1.11mi |
| 14284 Cruse St Detroit, MI | 3.0 | 1.0 | 1121 | $1,150 | $1.03 | 16d | 1 | 1.13mi |
| 14104 Coyle St Detroit, MI | 3.0 | 1.0 | 1327 | $1,350 | $1.02 | 5d | 1 | 1.14mi |
| 11641 Mansfield St Unit 2 Detroit, MI | 3.0 | 1.0 | 1449 | $1,300 | $0.90 | 43d | 1 | 1.18mi |
| 9209 Pinehurst St Detroit, MI | 3.0 | 1.0 | 1589 | $1,500 | $0.94 | 43d | 1 | 1.21mi |
| 13965 Mendota St Detroit, MI | 3.0 | 1.0 | 1222 | $1,294 | $1.06 | 17d | 1 | 1.24mi |
| 14375 Terry St Detroit, MI | 3.0 | 2.0 | 1300 | $1,425 | $1.10 | 43d | 1 | 1.32mi |
| 9589 Mansfield St Detroit, MI | 4.0 | 1.0 | 1250 | $1,500 | $1.20 | 5d | 1 | 1.33mi |
| 14590 Ardmore St Detroit, MI | 3.0 | 1.0 | 1200 | $1,195 | $1.00 | 2d | 1 | 1.39mi |
| 14600 Strathmoor St Detroit, MI | 4.0 | 1.0 | 1300 | $1,450 | $1.12 | 43d | 1 | 1.42mi |
| 13620 Kentucky St Detroit, MI | 3.0 | 1.0 | 1248 | $1,200 | $0.96 | 5d | 1 | 1.44mi |
| 9220 Mansfield St Detroit, MI | 3.0 | 1.0 | 1200 | $1,300 | $1.08 | 43d | 1 | 1.46mi |
Listing history 44 events
-
2026-05-18status Pending 682-char remark
Show marketing remark (682 chars)
Investor Opportunity – 13723 Castleton Attention investors! 13723 Castleton offers a strong opportunity for those seeking a value-add or buy-and-hold investment. The property features a functional layout with solid potential for renovation and improvement, allowing investors to maximize returns through strategic updates. Situated in an established neighborhood with ongoing rental demand, this property is well-positioned for long-term cash flow or resale after rehab. Convenient access to nearby amenities, schools, and major roads enhances tenant appeal and future resale value. Sold as-is. Back on the market due to previous buyer's financing falling through
-
2026-05-18status Pending 669-char remark
Show marketing remark (682 chars)
Investor Opportunity – 13723 Castleton Attention investors! 13723 Castleton offers a strong opportunity for those seeking a value-add or buy-and-hold investment. The property features a functional layout with solid potential for renovation and improvement, allowing investors to maximize returns through strategic updates. Situated in an established neighborhood with ongoing rental demand, this property is well-positioned for long-term cash flow or resale after rehab. Convenient access to nearby amenities, schools, and major roads enhances tenant appeal and future resale value. Sold as-is. Back on the market due to previous buyer's financing falling through
-
2026-05-11$25,000 Active 669-char remark
Show marketing remark (682 chars)
Investor Opportunity – 13723 Castleton Attention investors! 13723 Castleton offers a strong opportunity for those seeking a value-add or buy-and-hold investment. The property features a functional layout with solid potential for renovation and improvement, allowing investors to maximize returns through strategic updates. Situated in an established neighborhood with ongoing rental demand, this property is well-positioned for long-term cash flow or resale after rehab. Convenient access to nearby amenities, schools, and major roads enhances tenant appeal and future resale value. Sold as-is. Back on the market due to previous buyer's financing falling through
-
2026-05-11$25,000 Active 682-char remark
Show marketing remark (682 chars)
Investor Opportunity – 13723 Castleton Attention investors! 13723 Castleton offers a strong opportunity for those seeking a value-add or buy-and-hold investment. The property features a functional layout with solid potential for renovation and improvement, allowing investors to maximize returns through strategic updates. Situated in an established neighborhood with ongoing rental demand, this property is well-positioned for long-term cash flow or resale after rehab. Convenient access to nearby amenities, schools, and major roads enhances tenant appeal and future resale value. Sold as-is. Back on the market due to previous buyer's financing falling through
-
2026-05-07historical
-
2026-04-17price $32,900
-
2026-04-16price $32,900
-
2026-03-25status Active
-
2026-03-25status Active
-
2026-03-11status Pending
-
2026-03-11status Pending
-
2026-02-16price $37,800
-
2026-02-15price $37,800
-
2026-02-04price $45,000
-
2026-02-04price $45,000
-
2026-01-20$59,000 Active
-
2026-01-19$59,000 Active
-
2019-09-17soldstatus $4,000 Sold
-
2019-09-17soldstatus $4,000 Closed
-
2019-09-06status Pending
-
2019-09-06status Pending
-
2019-07-19status Active
-
2019-07-16historical
-
2019-07-10$8,000 Active
-
2019-07-10$8,000 Active
-
2019-07-10historical
-
2019-07-09historical
-
2019-02-08status Active
-
2019-01-25historical
-
2018-07-24price $8,000
-
2018-07-23price $8,000
-
2018-07-20status Active
-
2018-07-12historical
-
2018-07-10$13,000 Active
-
2018-07-10$13,000 Active
-
2018-03-01historical
-
2018-03-01historical
-
2017-12-27status Active
-
2017-12-27status Active
-
2017-11-30status Pending
-
2017-11-30status Pending
-
2017-10-11$8,500 Active
-
2017-10-11$8,500 Active
-
1991-11-26soldstatus $30,000
ⓘ Source: listings_history table (triggers on properties + properties_extension) + one-shot
backfill from property_details.listing_events for pre-trigger history.
Climate risk First Street
- Flood 1/10 Low FEMA zone X (unshaded) · 0% chance over 30 yrs
- Wildfire 1/10 Low
- Heat 3/10 Moderate 7 d/yr ≥97°F today · 15 d/yr by 30 yrs out
- Wind 2/10 Low
- Air quality 3/10 Moderate 2 unhealthy d/yr today · 5 by 30 yrs out
Nearby sold comps map
Loading sold comps map…
Walkable amenities ~0.75 mi
Loading nearby amenities…
Taxation est. · year 1
- Rental income
- $17,220
- − Mortgage interest
- −$1,400
- − Property taxes
- −$375
- − Insurance
- −$125
- − Repairs & maintenance
- −$1,378
- − Management
- −$1,378
- − Depreciation
- −$727
- Taxable income
- $11,837
- Est. tax owed @ 24.0%
- −$2,841
- After-tax cash flow
- $8,690/yr
For passive investors: Depreciation is non-cash, so a rental often shows a tax loss while cash-flowing — sheltering income. Rental losses are passive: they offset passive income freely, and up to $25,000/yr can offset ordinary (W-2) income if you actively participate and your MAGI is under $100k (phasing out to $0 by $150k); unused losses carry forward. On sale, claimed depreciation is recaptured at up to 25%, and gains may owe capital-gains tax (a 1031 exchange can defer both). Figures are a year-1 estimate at your 24.0% rate — not tax advice; consult a CPA.
Schools (NCES district)
- District
- Detroit Public Schools Community District
- NCES district ID
- 2601103
- Math proficiency
- 10% ▼ -2.00%
- Reading proficiency
- 24% ▲ 6.00%
- Median HH income
- $25,815
- Composite
- 13.06/100
- National rank
- #9564
- State rank
- #499 of 540 in MI
Livability — Detroit
- Score
- 73/100
- State rank
- #218
- US rank
- #5427
Category grades
Schools grade is shown separately in the Schools card above.
Census & demographics
- Census place
- Detroit, MI
- County
- Wayne County · 1,562,939 people
- City population
- 572,865
- Metro
- Detroit-Warren-Dearborn, MI
- Population (ZIP)
- 40,302
- Household income
- $36,527
- Rent vs Own
- Severe rent burden
- 2371.0
Population outlook (Wayne County) Hauer SSP2
- Today (2025)
- 1,675,273 people
- By 2030
- 1,620,300 · -3.3%
- By 2040
- 1,502,341 · -10.3%
- By 2050
- 1,384,039 · -17.4%
- By 2075
- 1,124,592 · -32.9%
- By 2100
- 881,193 · -47.4%
Race, ethnicity, and origin ACS 2023
- Neighborhood character
- Predominantly Black (95%)
- Race & ethnicity
- Black 95% Two or more races 3% White 1%
- Foreign-born
- 1%
- Languages at home
- 98% English-only · Spanish 1% French/Haitian/Cajun 1%
Political lean MEDSL · Wayne
- 2024 margin
- Strong D (+29.0) · D 62.7% · R 33.7% · Other 3.6%
- 2008→2024 swing
- -20.5pp toward R · 2008: 49.5pp · 2024: 29.0pp
- All cycles
- 2024: D+29.0 2020: D+38.1 2016: D+37.3 2012: D+46.9 2008: D+49.5
Not yet ingested
- Civics
- —
Market trends
- HPI YoY
- ▼ -125.00%
- Current HPI
- 186.4158
- Rent YoY
- ▲ 5.59%
- Metro
- Detroit-Warren-Dearborn, MI
- State GDP YoY
- ▲ 1.37%
- F500 in state
- 28
Industry mix (Fortune 500 HQ in MI)
| Industry | F500 HQs | Revenue |
|---|---|---|
| Automotive Parts | 3 | $48B |
|
||
| Automotive | 2 | $372B |
|
||
| Chemicals | 1 | $45B |
|
||
| Automotive Retail | 1 | $29B |
|
||
| Healthcare / Medical Devices | 1 | $23B |
|
||
| Automotive Technology | 1 | $20B |
|
||
Price history
-16.7% since first listed44 events — show timeline
- 2026-05-18 Pending — MiRealSource-MiMLS
- 2026-05-18 Pending — REALCOMP
- 2026-05-11 Listed $25,000 REALCOMP
- 2026-05-11 Listed $25,000 MiRealSource-MiMLS
- 2026-05-07 Listing Removed — MiRealSource-MiMLS
- 2026-04-17 Price Changed $32,900 MiRealSource-MiMLS
- 2026-04-16 Price Changed $32,900 REALCOMP
- 2026-03-25 Relisted — MiRealSource-MiMLS
- 2026-03-25 Relisted — REALCOMP
- 2026-03-11 Pending — MiRealSource-MiMLS
- 2026-03-11 Pending — REALCOMP
- 2026-02-16 Price Changed $37,800 MiRealSource-MiMLS
- 2026-02-15 Price Changed $37,800 REALCOMP
- 2026-02-04 Price Changed $45,000 MiRealSource-MiMLS
- 2026-02-04 Price Changed $45,000 REALCOMP
- 2026-01-20 Listed $59,000 REALCOMP
- 2026-01-19 Listed $59,000 MiRealSource-MiMLS
- 2019-09-17 Sold (MLS) $4,000 MiRealSource-MiMLS
- 2019-09-17 Sold (MLS) $4,000 REALCOMP
- 2019-09-06 Pending — MiRealSource-MiMLS
- 2019-09-06 Pending — REALCOMP
- 2019-07-19 Relisted — REALCOMP
- 2019-07-16 Listing Removed — REALCOMP
- 2019-07-10 Listed $8,000 MiRealSource-MiMLS
- 2019-07-10 Listed $8,000 REALCOMP
- 2019-07-10 Listing Removed — REALCOMP
- 2019-07-09 Listing Removed — MiRealSource-MiMLS
- 2019-02-08 Relisted — REALCOMP
- 2019-01-25 Listing Removed — REALCOMP
- 2018-07-24 Price Changed $8,000 MiRealSource-MiMLS
- 2018-07-23 Price Changed $8,000 REALCOMP
- 2018-07-20 Relisted — REALCOMP
- 2018-07-12 Listing Removed — REALCOMP
- 2018-07-10 Listed $13,000 MiRealSource-MiMLS
- 2018-07-10 Listed $13,000 REALCOMP
- 2018-03-01 Listing Removed — MiRealSource-MiMLS
- 2018-03-01 Listing Removed — REALCOMP
- 2017-12-27 Relisted — MiRealSource-MiMLS
- 2017-12-27 Relisted — REALCOMP
- 2017-11-30 Pending — MiRealSource-MiMLS
- 2017-11-30 Pending — REALCOMP
- 2017-10-11 Listed $8,500 MiRealSource-MiMLS
- 2017-10-11 Listed $8,500 REALCOMP
- 1991-11-26 Sold (Public Records) $30,000 Public Records
Property tax history
+22.2%/yrLatest (2025): $3,661 · +0.6% YoY. Source: county tax records.
Cash-flow waterfall
monthlySold comps — $/sqft
last 12 mo · ≤1 miLoading sold comps…