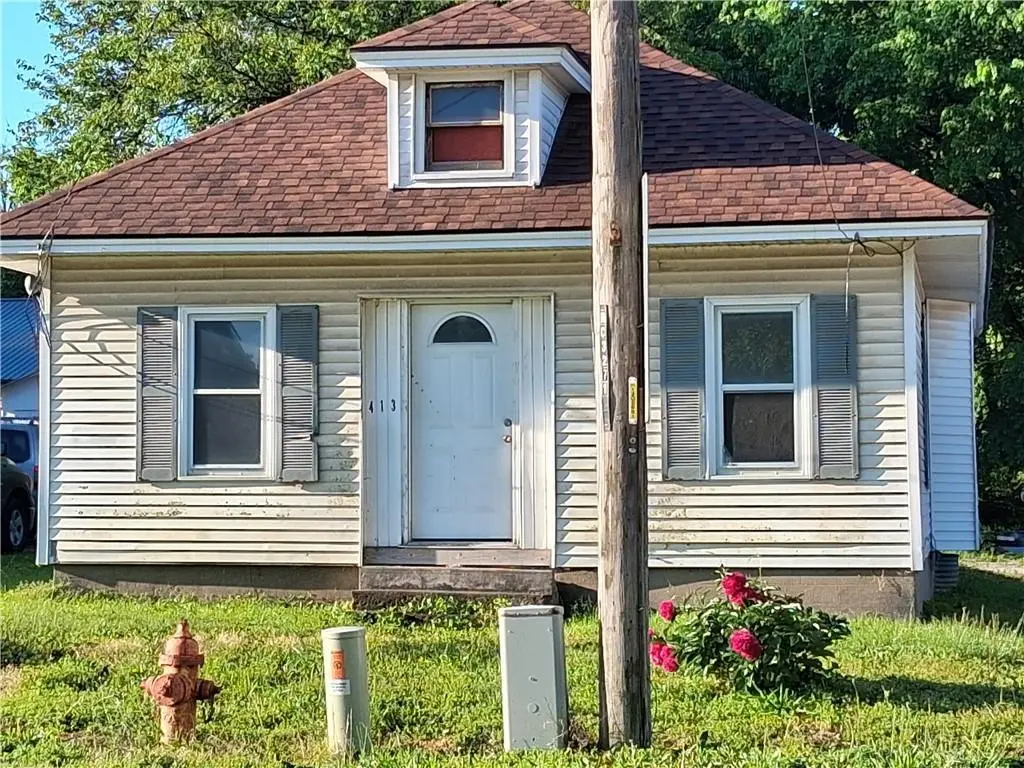
413 W Main St · Richmond, MO
Flood risk 4/10 · Minor
- FEMA flood zone
- X (unshaded)
- Chance of flooding over 30 yrs
- 0.22%
- Est. flood insurance / yr
- $507 – $1,088
Fire risk 3/10 · Minor
- Est. fire insurance / yr
- $1,054 – $1,958
Heat risk 4/10 · Minor
- Hot days now (above 107°F)
- 7 days/yr
- Hot days in 30 yrs
- 16 days/yr
Wind risk 2/10 · Minimal
- Chance of severe wind over 30 yrs
- —
Air-quality risk 2/10 · Minimal
- Unhealthy air days now
- 2 days/yr
- Unhealthy air days in 30 yrs
- 2 days/yr
Risk factors via First Street. Map © Google.
Why this score? — see what drove the B grade
The composite is a weighted blend of 9 inputs, each scored 0–100. Each bar is that input's sub-score; the figure is the points it added to the 100-point composite (weight × sub-score).
- Cash flow +26.7/30.0
- ARV discount +15.0/15.0
- DSCR +9.2/10.0
- 1% rule +6.1/10.0
- Appreciation +5.1/10.0
- Livability +3.4/5.0
- Schools +3.0/10.0
- Rent growth +2.5/5.0
- Condition / age +2.5/5.0
$87,500
🖨 Deal sheet 📄 Offer letter ✓ Due diligence
Listing remarks
Welcome to the small town of Richmond! Motivated sellers still need to do some clean-up on property. Very large walk-in closet with primary bedroom. Outdated bathroom features. Updated electric in 2017. Great AS IS property to make your own or invest in. The large shop/garage in the backyard is a plus! Just being 2 blocks from downtown shopping and amenities provides a nice walk at nearly every time of year.
Key facts
- Walk-in closet
- Updated electric
- Large shop garage
Tags
Property features AI
Finance
- Other: Lot includes stream(s); Lot roughly 9,583 square feet (public records); Not in a flood plain; Age: 101+ years; Above-grade living area reported as 990 (agent source); Basement: cellar and crawl space
- HOA & community: No association fees
Exterior
- Parking: Detached garage facing front; 2-car garage; Shared driveway
- Utilities: Public water; Public sewer; Paved public road
- Home design: Single-family residential; Bungalow / Ranch floor plan; Located inside city limits
- Construction: Vinyl siding; Composition roof; Garage(s) present
- Exterior features: Deck and patio; Property needs repair / fixer
Interior
- Kitchen: Kitchen with off-the-kitchen laundry access
- Bedrooms: 2 bedrooms (both on the first floor)
- Flooring: Wood flooring and other flooring
- Bathrooms: 1 full bathroom
- Heating & cooling: No heating system specified; No cooling system specified
- Interior features: Walk-in closet(s); Storm and thermal windows, with wood window frames; Liv/Dining combo
- Laundry & utility: Dryer hookup (electric) located off the kitchen
Neighborhood map
What this means for you Summary
Snapshot
- This is a 2-bed/1.0-bath single-family listed at $88k.
Deal economics
- At list price, monthly cash flow is $236 ($3k/yr) — positive.
- The deal already cash-flows at list — no discount required.
- Meets the 1% rule at list price ($975 rent vs $88k).
- Recommended offer: $86k (1.5% below list) — sets the bar for market timing.
- Cap rate 9.5% vs local median 3.7% in Richmond — top-decile yield for the area; either an underpriced asset or a hidden risk that comps aren't pricing in. Stress-test before assuming the spread holds.
Location & tenants
- Location reads 67/100 on livability (#198 in MO) — a middle-class / working-renter tenant base. Strengths: cost of living A+, housing A+; Watch: health & safety C-, schools D+, amenities F.
- Richmond R-XVI (town): math 32% / reading 39% proficiency, ranked #209 of 324 in MO (top 64%) — families likely to look elsewhere, expect single-tenant / working-renter base with shorter leases.
- Market conditions: 99 active listings in the ZIP; 3 comparable units currently listed for rent nearby; rentals leasing fast (median 2d on market — plan ~1-2 weeks tenant-placement turnaround); 56 units permitted in Ray County in 2024 (0 in 5+ unit buildings).
Forward outlook
- In year one you build about $864 of equity ($605 loan paydown + $259 appreciation (0.3% local appreciation)).
- Ray County population projected at -23% by 2050 — secular population decline; favor cash flow + early exit over multi-decade hold.
- At projected returns (0.3% appreciation + 3.0% rent growth), your $24k cash investment doubles in ~6 years — after that, you're playing with house money.
Negotiation context
- It's been on market 18 days — a 2% lower offer ($86k) is reasonable based on typical stale-listing flexibility.
Risks & watch-outs
- Watch-outs: built in 1900 — expect roof / HVAC / electrical / plumbing capex.
Questions for the listing agent
- Built in 1900 — when were the roof, HVAC, electrical panel, plumbing, and water heater last replaced?
- Is there a deadline driving the sale (1031 exchange, divorce, estate, relocation)? That informs how much negotiation room exists.
- Schools are D-rated, which usually means shorter tenancies and higher turnover. Who's the typical renter profile here, and what's been the actual vacancy rate?
- What's the average days-on-market for RENTAL listings here right now (not sales)? A rising rental-DOM trend means longer vacancies and softer asking-rent achievability than the comps imply.
- What's the recent tenant-quality profile in this submarket — average credit score on applications, eviction rate, late-payment / NSF rate, and stable-employment percentage? A property-management company in the area should have these aggregated.
- How much new for-sale + rental construction is in the pipeline within 1–3 miles? Heavy new supply typically softens prices + rents 12–24 months out; constrained supply supports both.
Investment metrics
- 1% rule
- 1.11% ✓
- Cap rate
- 9.53%
- Cash-on-cash
- 11.58%
- DSCR
- 1.52
- GRM
- 7.5
CMA / ARV
- ARV (median comp)
- $134,244
- List price
- $87,500
- Delta
- -34.82%
- Verdict
- UNDERPRICED
- Comps
- 20 within 1.0 mi
Show comp detail 12 sales within ~0.75 mi
| Address | Dist | Beds/Ba | Sqft | Sold | Price | $/sf | Match |
|---|---|---|---|---|---|---|---|
| 305 Wilson Blvd | 0.14mi | 3/1.0 (+1) | 1,036 (+4%) | 2mo | $199,900 | $193 | 80 |
| 802 W Lexington St | 0.28mi | 2/1.0 | 1,038 (+4%) | 1mo | $139,000 | $134 | 79 |
| 500 Shotwell St | 0.26mi | 2/1.0 | 1,060 (+7%) | 2mo | $54,900 | $52 | 75 |
| 403 S Thornton St | 0.34mi | 2/1.0 | 1,017 (+2%) | 6mo | $59,500 | $59 | 75 |
| 310 S College St | 0.23mi | 2/1.0 | 1,064 (+7%) | 4mo | $179,900 | $169 | 74 |
| 509 Sycamore Dr | 0.43mi | 3/1.0 (+1) | 1,008 (+1%) | 1mo | $220,000 | $218 | 72 |
| 905 W Main St | 0.42mi | 2/1.0 | 950 (-4%) | 6mo | $149,000 | $157 | 68 |
| 701 W Lexington St | 0.23mi | 2/1.0 | 858 (-14%) | 6mo | $155,000 | $181 | 61 |
| 616 Shotwell St | 0.50mi | 2/1.0 | 1,092 (+10%) | 3mo | $186,000 | $170 | 58 |
| 309 Joseph St | 0.66mi | 2/1.0 | 900 (-10%) | 2mo | $159,900 | $178 | 52 |
| 519 S Shaw St | 0.57mi | 2/1.0 | 1,116 (+12%) | 4mo | $184,900 | $166 | 50 |
| 408 S Shaw St | 0.39mi | 3/1.0 (+1) | 1,131 (+14%) | 6mo | $159,900 | $141 | 49 |
Match score weights: distance 35% · size 25% · config 20% · recency 20%. Top-matched comps best support the ARV.
Projected returns pro-forma
0.3% appreciation · 3.0% rent growth · sell at horizon
- IRR
- 11.5%
- Equity multiple
- 1.56×
- Total profit
- $13,690
- Equity at exit
- $26,709
- IRR
- 15.9%
- Equity multiple
- 2.80×
- Total profit
- $44,068
- Equity at exit
- $33,164
Cash invested: $24,500 (down + closing). Projections, not guarantees.
Landlord ↔ Tenant lean methodology
- Overall (STATE)
- 81 Strongly Landlord-Friendly
- State Missouri
- 81 Strongly Landlord-Friendly · R+10
- County
- — inherits STATE
- City
- — inherits STATE
ZIP-level market 64085
- Home prices YoY
- 0.1%
- Active inventory
- 99
- Price-to-rent
- 7.5×
Monthly cashflow live
- Estimated rent
- $975 medium interval (Pro) →
- Mortgage (P&I)
- −$459
- Tax from tax record
- −$38 /mo · $460/yr
- Insurance
- −$36
- HOA
- −$0
- Vacancy / Maint / Mgmt
- −$205
- Net cashflow
- $236
Break-even live
UW: 25.0% down · 7.5% · 30yr · 1.5% tax · 5.0% vac · 8.0% maint · 8.0% mgmt
Financing live
Cash to close
- Down payment
- $21,875
- Closing costs
- $2,625
- Reserves months
- —
- Total cash needed
- —
Loan-product check · same deal, 3 products live
Conventional
25% down · 7.5% · 30yr
- Down + closing
- —
- Monthly P&I
- —
- Monthly cashflow
- —
- DSCR
- —
- Eligible?
- —
Personal DTI + credit; lowest rate.
DSCR
20% down · 8.5% · 30yr
- Down + closing
- —
- Monthly P&I
- —
- Monthly cashflow
- —
- DSCR
- —
- Eligible?
- —
No personal income docs; deal must DSCR.
Hard money
10% down · 12.0% · 12mo
- Down + closing
- —
- Monthly P&I
- —
- Monthly cashflow
- —
- DSCR
- —
- Eligible?
- —
Short-term bridge; refi at stabilization.
Rent comps 3 comps
| Address | Beds | Baths | Sqft | Rent | $/sqft | DOM | Units | Dist |
|---|---|---|---|---|---|---|---|---|
| 1101 S Camden St Unit 1107 1 Richmond, MO | 2.0 | 1.0 | 750 | $1,000 | $1.33 | 2d | 1 | 1.11mi |
| 1101 S Camden St Unit 1105 5 Richmond, MO | 2.0 | 1.0 | 750 | $1,000 | $1.33 | 1d | 1 | 1.11mi |
| 1105 Fairway Dr Richmond, MO | 2.0 | 1.0 | 782 | $925 | $1.18 | 1d | 1 | 1.14mi |
Listing history 2 events
-
2026-05-13price $87,500 411-char remark
-
2026-05-09$95,000 Active 411-char remark
ⓘ Source: listings_history table (triggers on properties + properties_extension) + one-shot
backfill from property_details.listing_events for pre-trigger history.
Tax reassessment forecast MO · Resets to sale price
- Current annual tax
- $460 · $38/mo
- Projected year-2 tax
- $849 · $71/mo
- Expected delta
- +$389/yr (+$32/mo · 84.7%)
ⓘ Screening estimate from a state-policy table — verify with the county assessor before closing.
Climate risk First Street
- Flood 4/10 Moderate FEMA zone X (unshaded) · 22% chance over 30 yrs
- Wildfire 3/10 Moderate
- Heat 4/10 Moderate 7 d/yr ≥107°F today · 16 d/yr by 30 yrs out
- Wind 2/10 Low
- Air quality 2/10 Low 2 unhealthy d/yr today · 2 by 30 yrs out
Nearby sold comps map
Loading sold comps map…
Walkable amenities ~0.75 mi
Loading nearby amenities…
Taxation est. · year 1
- Rental income
- $11,696
- − Mortgage interest
- −$4,901
- − Property taxes
- −$460
- − Insurance
- −$438
- − Repairs & maintenance
- −$936
- − Management
- −$936
- − Depreciation
- −$2,545
- Taxable income
- $1,481
- Est. tax owed @ 24.0%
- −$355
- After-tax cash flow
- $2,481/yr
For passive investors: Depreciation is non-cash, so a rental often shows a tax loss while cash-flowing — sheltering income. Rental losses are passive: they offset passive income freely, and up to $25,000/yr can offset ordinary (W-2) income if you actively participate and your MAGI is under $100k (phasing out to $0 by $150k); unused losses carry forward. On sale, claimed depreciation is recaptured at up to 25%, and gains may owe capital-gains tax (a 1031 exchange can defer both). Figures are a year-1 estimate at your 24.0% rate — not tax advice; consult a CPA.
Schools (NCES district)
- District
- Richmond R-XVI
- NCES district ID
- 2926480
- Math proficiency
- 32% ▼ -11.00%
- Reading proficiency
- 39% ▼ -8.00%
- Median HH income
- $44,070
- Composite
- 30.17/100
- National rank
- #6321
- State rank
- #209 of 324 in MO
Livability — Richmond
- Score
- 67/100
- State rank
- #198
- US rank
- #10160
Category grades
Schools grade is shown separately in the Schools card above.
Census & demographics
- Census place
- Richmond, MO
- Population (ZIP)
- 8,113
Population outlook (Ray County) Hauer SSP2
- Today (2025)
- 21,420 people
- By 2030
- 20,507 · -4.3%
- By 2040
- 18,550 · -13.4%
- By 2050
- 16,516 · -22.9%
- By 2075
- 12,899 · -39.8%
- By 2100
- 10,413 · -51.4%
Race, ethnicity, and origin ACS 2023
- Neighborhood character
- Predominantly White (91%)
- Race & ethnicity
- White 91% Hispanic / Latino 3% Two or more races 3% Black 2% Native American 1%
- Common ancestry
- Lithuanian 3% Slovak 2% Italian 1%
- Foreign-born
- 1% · Canada
- Languages at home
- 97% English-only · Spanish 2%
Political lean MEDSL · Ray
- 2024 margin
- Solid R (+48.7) · D 25.1% · R 73.8% · Other 1.1%
- 2008→2024 swing
- -45.5pp toward R · 2008: -3.2pp · 2024: -48.7pp
- All cycles
- 2024: R+48.7 2020: R+45.0 2016: R+37.1 2012: R+14.9 2008: R+3.2
Not yet ingested
- Civics
- —
Market trends
- HPI YoY
- ▲ 0.30%
- Current HPI
- 374.3671
- Rent YoY
- —
- Metro
- —
- State GDP YoY
- ▲ 1.84%
- F500 in state
- 20
Industry mix (Fortune 500 HQ in MO)
| Industry | F500 HQs | Revenue |
|---|---|---|
| Healthcare | 1 | $163B |
|
||
| Insurance | 1 | $21B |
|
||
| Industrial Technology | 1 | $17B |
|
||
| Retail | 1 | $16B |
|
||
| Industrial Distribution | 1 | $10B |
|
||
| Utilities | 1 | $9B |
|
||
Price history
-7.9% since first listed3 events — show timeline
- 2026-05-29 Listing Removed — Heartland MLS as Distributed by MLS Grid
- 2026-05-13 Price Changed $87,500 Heartland MLS as Distributed by MLS Grid
- 2026-05-09 Listed $95,000 Heartland MLS as Distributed by MLS Grid
Property tax history
+4.4%/yrLatest (2025): $460 · +6.5% YoY. Source: county tax records.
Cash-flow waterfall
monthlySold comps — $/sqft
last 12 mo · ≤1 miLoading sold comps…