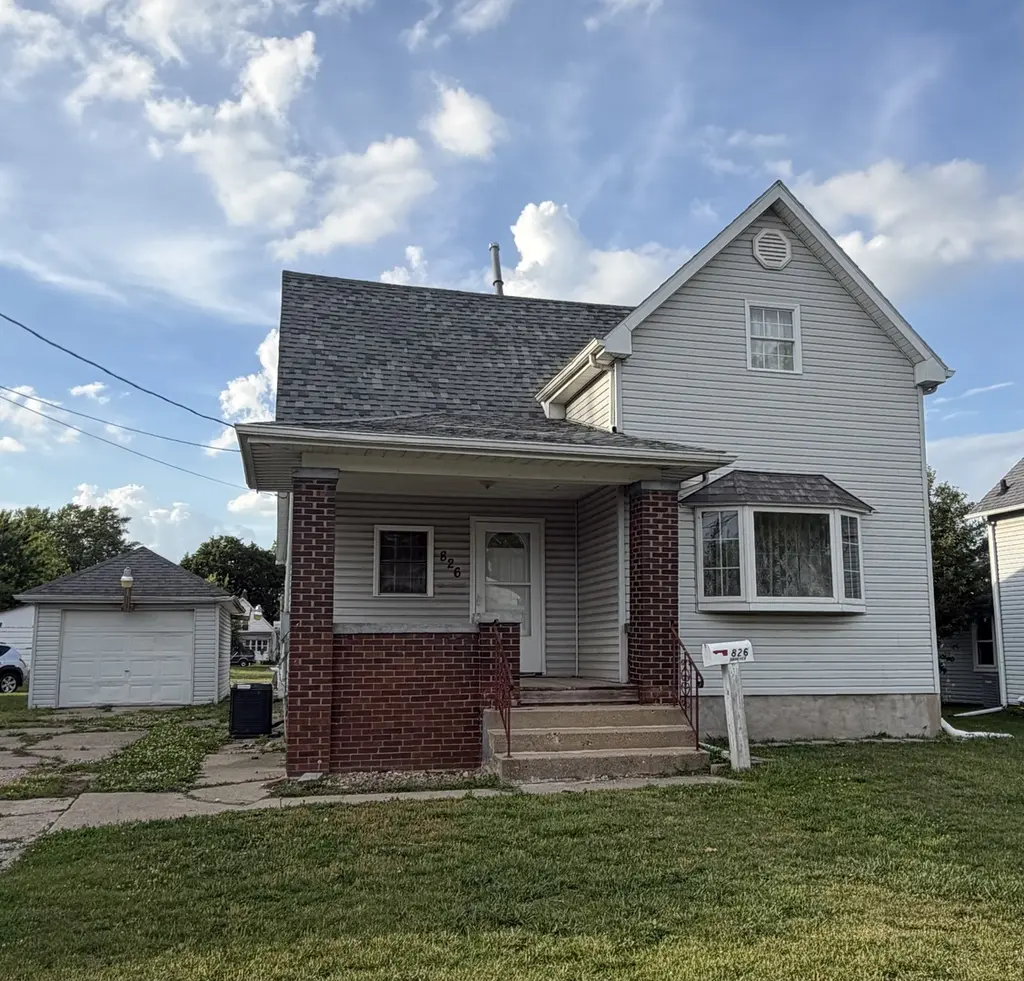
826 Prairie Ave · Kewanee, IL
Flood risk 1/10 · Minimal
- FEMA flood zone
- X (unshaded)
- Chance of flooding over 30 yrs
- 0.0%
- Est. flood insurance / yr
- $473 – $860
Fire risk 1/10 · Minimal
- Est. fire insurance / yr
- $804 – $1,492
Heat risk 3/10 · Minor
- Hot days now (above 103°F)
- 7 days/yr
- Hot days in 30 yrs
- 17 days/yr
Wind risk 2/10 · Minimal
- Chance of severe wind over 30 yrs
- —
Air-quality risk 3/10 · Minor
- Unhealthy air days now
- 2 days/yr
- Unhealthy air days in 30 yrs
- 3 days/yr
Risk factors via First Street. Map © Google.
Why this score? — see what drove the B- grade
The composite is a weighted blend of 9 inputs, each scored 0–100. Each bar is that input's sub-score; the figure is the points it added to the 100-point composite (weight × sub-score).
- Cash flow +30.0/30.0
- 1% rule +10.0/10.0
- DSCR +10.0/10.0
- ARV discount +7.8/15.0
- Livability +3.5/5.0
- Rent growth +2.5/5.0
- Condition / age +2.5/5.0
- Schools +1.2/10.0
- Appreciation +0.0/10.0
$79,900
🖨 Deal sheet (PDF) 📄 Offer letter ✓ Due diligence
Listing remarks MLS
If you are looking for a real fixer upper, look no further! This home needs lots of work but has great potential. There is a 1- car-detached garage & inside features: living room w/ bay window, the dining room is open to the kitchen, main floor bath, main floor bedroom & mudroom. The 3 additional bedrooms are located on the 2nd floor. This home is being sold " AS IS ".
Key facts
- 8,410 sq ft lot
- Built 1907
- Listed 12 days
Property features AI
Finance
- Other: Living area source: Assessor; Directions: From West Prospect St turn right to 5th Avenue then turn left onto Prairie Avenue.
- Financial info: Financial details not provided
- HOA & community: No master association fee required
Exterior
- Parking: Parking information not provided
- Security: Security information not provided
- Utilities: Public water; Public sewer
- Home design: Detached single-family home; 1.5-story design; Property more than 100 years old; Facing direction not specified
- Construction: Vinyl siding exterior; Asphalt roof; Brick/mortar foundation; Built before 1978
- Exterior features: Level lot; Lot dimensions approximately 58 x 145
Interior
- Kitchen: Kitchen on main level (15 x 11)
- Bedrooms: Master bedroom on main level (9 x 12); Three additional bedrooms on second level (12 x 11; 12 x 10; 10 x 11)
- Flooring: Laminate flooring in living room; Ceramic tile in kitchen, family room, and dining room
- Bathrooms: One full bathroom
- Heating & cooling: Forced air heating; Central air conditioning
- Interior features: Eight total rooms; Separate dining room; Unfinished partial basement; Bay window(s) in living room; Wood burning stove in family room
- Laundry & utility: Laundry room
Neighborhood map
What this means for you Summary
Snapshot
- This is a 4-bed/1.0-bath single-family listed at $80k.
Deal economics
- At list price, monthly cash flow is $403 ($5k/yr) — positive.
- The deal already cash-flows at list — no discount required.
- Meets the 1% rule at list price ($1k rent vs $80k).
- Cap rate 12.4% vs local median 8.6% in Kewanee — top-decile yield for the area; either an underpriced asset or a hidden risk that comps aren't pricing in. Stress-test before assuming the spread holds.
Location & tenants
- Location reads 69/100 on livability (#409 in IL) — a middle-class / working-renter tenant base. Strengths: cost of living A+, health & safety A+, housing A; Watch: schools F, crime D-, amenities F.
- Kewanee CUSD 229 (town): math 8% / reading 20% proficiency, ranked #540 of 620 in IL (top 87%) — low school quality limits family demand, transient renter base, plan for 1-2y turnover; 73% free/reduced lunch — lower-income household profile, screen leases tightly.
- Market conditions: 39 active listings in the ZIP; 32 units permitted in Henry County in 2024 (0 in 5+ unit buildings).
Forward outlook
- Local home prices are declining (-3.0%/yr); year-one equity from $552 of loan paydown is wiped out by about $2k of value loss. Plan a longer hold.
- Henry County population projected at -16% by 2050 — secular population decline; favor cash flow + early exit over multi-decade hold.
- At projected returns (-3.0% appreciation + 3.0% rent growth), your $22k cash investment doubles in ~6 years — after that, you're playing with house money.
Negotiation context
- Only 12 days on market — expect competitive offers; lowballing is unlikely to land.
- 5 sale attempts since 13y ago with the ask held roughly flat each time — persistent listings suggest the price (not the market) is what's stuck; bring a comps-based counter.
- Current owner paid $19k; list at $80k implies a 321% gain — meaningful room to come down on a strong offer.
Risks & watch-outs
- Watch-outs: built in 1907 — expect roof / HVAC / electrical / plumbing capex.
Questions for the listing agent
- Built in 1907 — when were the roof, HVAC, electrical panel, plumbing, and water heater last replaced?
- Is there a deadline driving the sale (1031 exchange, divorce, estate, relocation)? That informs how much negotiation room exists.
- Schools are F-rated, which usually means shorter tenancies and higher turnover. Who's the typical renter profile here, and what's been the actual vacancy rate?
- Crime grade is D in this area — have there been break-ins, vandalism, or insurance claims at this property in the last 3 years? What carrier currently insures it and at what premium?
- What's the average days-on-market for RENTAL listings here right now (not sales)? A rising rental-DOM trend means longer vacancies and softer asking-rent achievability than the comps imply.
- What's the recent tenant-quality profile in this submarket — average credit score on applications, eviction rate, late-payment / NSF rate, and stable-employment percentage? A property-management company in the area should have these aggregated.
- How much new for-sale + rental construction is in the pipeline within 1–3 miles? Heavy new supply typically softens prices + rents 12–24 months out; constrained supply supports both.
Investment metrics
- 1% rule
- 1.52% ✓
- Cap rate
- 12.35%
- Cash-on-cash
- 21.64%
- DSCR
- 1.96
- GRM
- 5.5
CMA / ARV
- ARV (on-the-fly)
- $80,467
- Comps found
- 12
Show comp detail 12 sales within ~0.75 mi
| Address | Dist | Beds/Ba | Sqft | Sold | Price | $/sf | Match |
|---|---|---|---|---|---|---|---|
| 1202 W Prospect St | 0.24mi | 4/1.0 | 1,083 (-10%) | 6mo | $56,540 | $52 | 67 |
| 216 N Boss St St | 0.39mi | 4/2.0 | 1,255 (+4%) | 5mo | $103,000 | $82 | 66 |
| 422 Ross St | 0.59mi | 3/1.0 (-1) | 1,200 (-0%) | 1mo | $64,900 | $54 | 66 |
| 213 Elliott St | 0.38mi | 3/2.0 (-1) | 1,170 (-3%) | 8mo | $55,000 | $47 | 62 |
| 110 N Park St | 0.46mi | 3/1.0 (-1) | 1,088 (-9%) | 2mo | $105,000 | $97 | 57 |
| 410 Ross St | 0.56mi | 4/1.0 | 1,114 (-7%) | 8mo | $33,000 | $30 | 56 |
| 517 W 1st St | 0.37mi | 3/3.0 (-1) | 1,263 (+5%) | 7mo | $119,000 | $94 | 55 |
| 323 S Chestnut St | 0.45mi | 3/1.0 (-1) | 1,098 (-9%) | 8mo | $67,500 | $61 | 53 |
| 216 Hillcrest Dr | 0.60mi | 3/1.5 (-1) | 1,252 (+4%) | 7mo | $84,000 | $67 | 52 |
| 216 Hillcrest Dr | 0.60mi | 3/1.5 (-1) | 1,252 (+4%) | 7mo | $84,000 | $67 | 52 |
| 622 S Tremont St | 0.60mi | 3/2.0 (-1) | 1,124 (-6%) | 8mo | $46,000 | $41 | 45 |
| 136 W Mill St | 0.60mi | 3/1.0 (-1) | 1,039 (-14%) | 1mo | $107,000 | $103 | 44 |
Match score weights: distance 35% · size 25% · config 20% · recency 20%. Top-matched comps best support the ARV.
Projected returns pro-forma
-3.0% appreciation · 3.0% rent growth · sell at horizon
- IRR
- 14.3%
- Equity multiple
- 1.57×
- Total profit
- $12,771
- Equity at exit
- $11,913
- IRR
- 23.0%
- Equity multiple
- 2.98×
- Total profit
- $44,293
- Equity at exit
- $6,908
Cash invested: $22,372 (down + closing). Projections, not guarantees.
Landlord ↔ Tenant lean methodology
- Overall (STATE)
- 43 Moderately Tenant-Leaning
- State Illinois
- 43 Moderately Tenant-Leaning · D+7
- County
- — inherits STATE
- City
- — inherits STATE
ZIP-level market 61443
- Active inventory
- 39
- Price-to-rent
- 5.5×
Monthly cashflow live
- Estimated rent
- $1,214 medium interval (Pro) →
- Mortgage (P&I)
- −$419
- Tax from tax record
- −$103 /mo · $1,238/yr
- Insurance
- −$33
- HOA
- −$0
- Vacancy / Maint / Mgmt
- −$255
- Net cashflow
- $403
Break-even live
Sensitivity live
| Price | -10% $449 | -5% $426 | +0% $403 | +5% $381 | +10% $358 |
|---|---|---|---|---|---|
| Rent | -10% $308 | -5% $356 | +0% $403 | +5% $451 | +10% $499 |
| Rate | -1.0pp $444 | -0.5pp $424 | base $403 | +0.5pp $383 | +1.0pp $362 |
UW: 25.0% down · 7.5% · 30yr · 1.5% tax · 5.0% vac · 8.0% maint · 8.0% mgmt
Financing live
Cash to close
- Down payment
- $19,975
- Closing costs
- $2,397
- Reserves months
- —
- Total cash needed
- —
Loan-product check · same deal, 3 products live
Conventional
25% down · 7.5% · 30yr
- Down + closing
- —
- Monthly P&I
- —
- Monthly cashflow
- —
- DSCR
- —
- Eligible?
- —
Personal DTI + credit; lowest rate.
DSCR
20% down · 8.5% · 30yr
- Down + closing
- —
- Monthly P&I
- —
- Monthly cashflow
- —
- DSCR
- —
- Eligible?
- —
No personal income docs; deal must DSCR.
Hard money
10% down · 12.0% · 12mo
- Down + closing
- —
- Monthly P&I
- —
- Monthly cashflow
- —
- DSCR
- —
- Eligible?
- —
Short-term bridge; refi at stabilization.
Listing history 9 events
-
2026-06-21statusdays on market $79,900 Contingent - Continue to Show 12 DOM
-
2026-06-18days on market $79,900 Active 10 DOM
-
2026-06-17days on market $79,900 Active 9 DOM
-
2026-06-16days on market $79,900 Active 8 DOM
-
2026-06-15days on market $79,900 Active 7 DOM
-
2026-06-13days on market $79,900 Active 5 DOM
-
2026-06-12days on market $79,900 Active 4 DOM
-
2026-06-09remarks 284-char remark
-
2026-06-09$79,900 Active 1 DOM
ⓘ Source: listings_history table (triggers on properties + properties_extension) + one-shot
backfill from property_details.listing_events for pre-trigger history.
Tax reassessment forecast IL · Partial reset (capped growth)
- Current annual tax
- $1,238 · $103/mo
- Projected year-2 tax
- $1,526 · $127/mo
- Expected delta
- +$288/yr (+$24/mo · 23.2%)
ⓘ Screening estimate from a state-policy table — verify with the county assessor before closing.
Climate risk First Street
- Flood 1/10 Low FEMA zone X (unshaded) · 0% chance over 30 yrs
- Wildfire 1/10 Low
- Heat 3/10 Moderate 7 d/yr ≥103°F today · 17 d/yr by 30 yrs out
- Wind 2/10 Low
- Air quality 3/10 Moderate 2 unhealthy d/yr today · 3 by 30 yrs out
Nearby sold comps map
Loading sold comps map…
Walkable amenities ~0.75 mi
Loading nearby amenities…
Taxation est. · year 1
- Rental income
- $14,567
- − Mortgage interest
- −$4,476
- − Property taxes
- −$1,238
- − Insurance
- −$400
- − Repairs & maintenance
- −$1,165
- − Management
- −$1,165
- − Depreciation
- −$2,324
- Taxable income
- $3,798
- Est. tax owed @ 24.0%
- −$912
- After-tax cash flow
- $3,930/yr
For passive investors: Depreciation is non-cash, so a rental often shows a tax loss while cash-flowing — sheltering income. Rental losses are passive: they offset passive income freely, and up to $25,000/yr can offset ordinary (W-2) income if you actively participate and your MAGI is under $100k (phasing out to $0 by $150k); unused losses carry forward. On sale, claimed depreciation is recaptured at up to 25%, and gains may owe capital-gains tax (a 1031 exchange can defer both). Figures are a year-1 estimate at your 24.0% rate — not tax advice; consult a CPA.
Schools (NCES district)
- District
- Kewanee CUSD 229
- NCES district ID
- 1721000
- Math proficiency
- 8% ▼ -8.00%
- Reading proficiency
- 20% ▼ -12.00%
- Median HH income
- $38,294
- Composite
- 11.77/100
- National rank
- #9682
- State rank
- #540 of 620 in IL
Livability — Kewanee
- Score
- 69/100
- State rank
- #409
- US rank
- #8423
Category grades
Schools grade is shown separately in the Schools card above.
Census & demographics
- Census place
- Kewanee, IL
- Population (ZIP)
- 13,529
Population outlook (Henry County) Hauer SSP2
- Today (2025)
- 47,376 people
- By 2030
- 45,920 · -3.1%
- By 2040
- 42,829 · -9.6%
- By 2050
- 39,606 · -16.4%
- By 2075
- 31,848 · -32.8%
- By 2100
- 23,503 · -50.4%
Race, ethnicity, and origin ACS 2023
- Neighborhood character
- Predominantly White (79%)
- Race & ethnicity
- White 79% Hispanic / Latino 11% Black 6% Two or more races 5%
- Hispanic origin (detail)
- Mexican 9% Puerto Rican 1%
- Common ancestry
- Romanian 4% English 3% Italian 3%
- Foreign-born
- 3% · Canada
- Languages at home
- 92% English-only · Spanish 7%
Political lean MEDSL · Henry
- 2024 margin
- Strong R (+24.5) · D 36.8% · R 61.3% · Other 1.9%
- 2008→2024 swing
- -32.2pp toward R · 2008: 7.7pp · 2024: -24.5pp
- All cycles
- 2024: R+24.5 2020: R+21.4 2016: R+21.2 2012: D+3.1 2008: D+7.7
Not yet ingested
- Civics
- —
Market trends
- HPI YoY
- ▼ -68.32%
- Current HPI
- 121.8672
- Rent YoY
- —
- Metro
- —
- State GDP YoY
- ▲ 1.59%
- F500 in state
- 60
Industry mix (Fortune 500 HQ in IL)
| Industry | F500 HQs | Revenue |
|---|---|---|
| Insurance | 4 | $201B |
|
||
| Consumer Goods | 4 | $87B |
|
||
| Industrial Machinery | 3 | $64B |
|
||
| Healthcare | 2 | $55B |
|
||
| Retail / Pharmacy | 1 | $148B |
|
||
| Agriculture / Food | 1 | $86B |
|
||
Price history
+180.4% since first listed10 events — show timeline
- 2026-06-08 Price Changed $79,900 MRED as Distributed by MLS Grid
- 2026-06-08 Listed $79,000 MRED as Distributed by MLS Grid
- 2021-07-22 Sold (MLS) $19,000 RMLSA as Distributed by MLS Grid
- 2021-07-22 Sold (MLS) $19,000 MRED as Distributed by MLS Grid
- 2021-07-02 Listed $20,900 RMLSA as Distributed by MLS Grid
- 2021-07-02 Listed $20,900 MRED as Distributed by MLS Grid
- 2013-10-24 Sold (MLS) $26,000 RMLSA as Distributed by MLS Grid
- 2013-10-24 Sold (MLS) $26,000 MRED as Distributed by MLS Grid
- 2013-06-24 Listed $28,500 RMLSA as Distributed by MLS Grid
- 2013-06-24 Listed $28,500 MRED as Distributed by MLS Grid
Property tax history
+3.5%/yrLatest (2024): $1,238 · +18.1% YoY. Source: county tax records.
Cash-flow waterfall
monthlySold comps — $/sqft
last 12 mo · ≤1 miLoading sold comps…