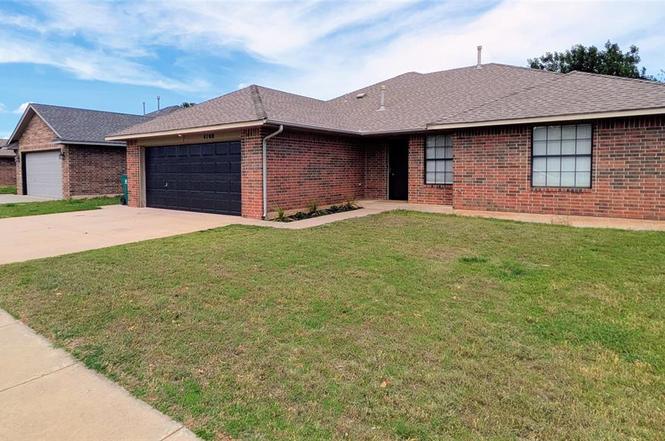
4108 Thorn Burn Pl · Oklahoma City, OK
Flood risk 1/10 · Minimal
- FEMA flood zone
- X (unshaded)
- Chance of flooding over 30 yrs
- 0.0%
- Est. flood insurance / yr
- $507 – $1,088
Fire risk 5/10 · Moderate
- Est. fire insurance / yr
- $2,463 – $4,575
Heat risk 6/10 · Moderate
- Hot days now (above 106°F)
- 7 days/yr
- Hot days in 30 yrs
- 19 days/yr
Wind risk 2/10 · Minimal
- Chance of severe wind over 30 yrs
- 4.0%
Air-quality risk 1/10 · Minimal
- Unhealthy air days now
- 0 days/yr
- Unhealthy air days in 30 yrs
- 0 days/yr
Risk factors via First Street. Map © Google.
Why this score? — see what drove the C grade
The composite is a weighted blend of 9 inputs, each scored 0–100. Each bar is that input's sub-score; the figure is the points it added to the 100-point composite (weight × sub-score).
- Cash flow +19.4/30.0
- ARV discount +14.2/15.0
- DSCR +6.1/10.0
- 1% rule +4.5/10.0
- Livability +4.0/5.0
- Schools +3.1/10.0
- Rent growth +2.5/5.0
- Condition / age +2.5/5.0
- Appreciation +0.0/10.0
$245,000
🖨 Deal sheet 📄 Offer letter ✓ Due diligence
Listing remarks MLS
This TRUE 4-bedroom home is an architectural dream and offers a fantastic layout. This sunlit home has a lot of natural light and a great entertaining flow for gatherings. The kitchen is truly fit for a chef with a breakfast bar and stainless steel appliances. Master Suite has a jetted tub, walk-in closet, tub and separate shower and double vanities. Generous sized secondary bedrooms and a mother-in-law floorplan. Spacious backyard and an incredible location close to highways, retail, schools. Don't miss out, it won't last long!
Key facts
- Updated countertops
- Modern fixtures
- Jacuzzi tub
Tags
Property features AI
Finance
- Other: Homestead exempt; No storm shelter; Property listed as active; Garage door lift, kitchen external exhaust, smoke alarm
- Financial info: Loan qualification: Yes
- HOA & community: No mandatory association dues
Exterior
- Parking: Concrete driveway; 2‑car garage
- Utilities: Cable available; High‑speed internet available; Public utilities
- Home design: Single family residence; One story; West facing; Residential property
- Construction: Brick construction; Composition roof (roof year 2026); Slab foundation; Existing property
- Exterior features: Covered patio; Covered porch; Rain gutters; Wood fencing; Interior lot
Interior
- Kitchen: Dishwasher; Disposal; Microwave; Refrigerator; Electric free‑standing range/oven
- Bedrooms: 4 bedrooms
- Flooring: Carpet; Laminate
- Bathrooms: 2 full bathrooms
- Heating & cooling: Zoned heating
- Interior features: Ceiling fans; Whirlpool tub; Window treatments
- Laundry & utility: Water heater
Neighborhood map
What this means for you Summary
Snapshot
- This is a 4-bed/2.0-bath single-family listed at $245k.
Deal economics
- At list price, monthly cash flow is $275 ($3k/yr) — positive.
- The deal already cash-flows at list — no discount required.
- To meet the 1% rule (rent ≥ 1% of price), the offer needs to be $233k (5.0% below list).
- Recommended offer: $230k (6.0% below list) — sets the bar for market timing.
- Cap rate 7.6% vs local median 3.7% in Oklahoma City — top-decile yield for the area; either an underpriced asset or a hidden risk that comps aren't pricing in. Stress-test before assuming the spread holds.
Location & tenants
- Location reads 80/100 on livability (#3 in OK, #1,635 nationally) — a professional / high-income tenant draw. Strengths: amenities A+, commute A+, cost of living A+; Watch: crime F.
- Mustang (suburban): math 35% / reading 33% proficiency, ranked #28 of 270 in OK (top 10%) — families likely to look elsewhere, expect single-tenant / working-renter base with shorter leases.
- Zoned schools: Prairie View Es (math 53% / reading 36%, grade F, #63 of 845 statewide, top 8%, 765 students, 0% FRL); Mustang Hs (math 28% / reading 39%, grade F, #65 of 447 statewide, top 14%, 3,756 students, 0% FRL) — zoned schools average 0% FRL vs 28% district-wide (28 pts lower); this property's tenant base skews higher-income than the district average.
- Market conditions: 99 active listings in the ZIP; 20 comparable units currently listed for rent nearby; rentals at typical pace (median 17d on market — plan ~3-4 weeks tenant-placement turnaround); high-income renter base; 5,365 units permitted in Oklahoma County in 2024 (569 in 5+ unit buildings).
Forward outlook
- Local home prices are declining (-3.0%/yr); year-one equity from $2k of loan paydown is wiped out by about $7k of value loss. Plan a longer hold.
- Oklahoma County population projected at +41% by 2050 — long-run rental-demand tailwind backs the buy-and-hold thesis.
Negotiation context
- It's been on market 90 days — a 6% lower offer ($230k) is reasonable based on typical stale-listing flexibility.
- 3 sale attempts since 7y ago; this cycle's ask has dropped $15k (6%) from the opening price — seller is motivated, your offer sets the floor, not the list.
- Current owner paid $150k; list at $245k implies a 63% gain — meaningful room to come down on a strong offer.
Risks & watch-outs
- Climate carrying-cost: moderate wildfire risk; extreme-heat days projected 7→19/yr by 2055 (HVAC capex compounding) — expect insurance premiums to compound above CPI over the hold.
Questions for the listing agent
- It's been on market 90 days. Have you received any prior offers? Is the seller open to a 6% concession, seller financing, or rate buy-down credit?
- Why hasn't it sold? Are there any deal-killer items the seller is aware of (foundation, flood, title, zoning, code violations)?
- Is there a deadline driving the sale (1031 exchange, divorce, estate, relocation)? That informs how much negotiation room exists.
- Schools are F-rated, which usually means shorter tenancies and higher turnover. Who's the typical renter profile here, and what's been the actual vacancy rate?
- Crime grade is F in this area — have there been break-ins, vandalism, or insurance claims at this property in the last 3 years? What carrier currently insures it and at what premium?
- What's the average days-on-market for RENTAL listings here right now (not sales)? A rising rental-DOM trend means longer vacancies and softer asking-rent achievability than the comps imply.
- What's the recent tenant-quality profile in this submarket — average credit score on applications, eviction rate, late-payment / NSF rate, and stable-employment percentage? A property-management company in the area should have these aggregated.
- How much new for-sale + rental construction is in the pipeline within 1–3 miles? Heavy new supply typically softens prices + rents 12–24 months out; constrained supply supports both.
Investment metrics
- 1% rule
- 0.95% ✗
- Cap rate
- 7.64%
- Cash-on-cash
- 4.80%
- DSCR
- 1.21
- GRM
- 8.8
CMA / ARV
- ARV (on-the-fly)
- $287,826
- Comps found
- 12
Show comp detail 12 sales within ~0.75 mi
| Address | Dist | Beds/Ba | Sqft | Sold | Price | $/sf | Match |
|---|---|---|---|---|---|---|---|
| 4013 Windgate West Rd | 0.14mi | 3/2.0 (-1) | 1,536 (-5%) | 2mo | $242,500 | $158 | 78 |
| 8800 SW 44th Ter | 0.29mi | 3/2.0 (-1) | 1,568 (-3%) | 2mo | $279,000 | $178 | 75 |
| 4001 Western Heights Ave | 0.04mi | 3/2.0 (-1) | 1,472 (-9%) | 4mo | $225,000 | $153 | 75 |
| 4413 Wind Haven Dr | 0.28mi | 3/2.0 (-1) | 1,539 (-5%) | 2mo | $281,500 | $183 | 72 |
| 4704 Caleb St | 0.39mi | 4/2.0 | 1,535 (-5%) | 2mo | $220,000 | $143 | 72 |
| 3920 Alnwick Ln | 0.32mi | 3/3.0 (-1) | 1,479 (-8%) | 1mo | $267,000 | $181 | 61 |
| 8716 SW 39th St | 0.24mi | 3/2.0 (-1) | 1,390 (-14%) | 0mo | $242,500 | $174 | 60 |
| 8516 SW 47th Cir | 0.43mi | 3/2.0 (-1) | 1,422 (-12%) | 1mo | $223,600 | $157 | 54 |
| 4801 Tsavo Way | 0.71mi | 3/2.0 (-1) | 1,556 (-4%) | 2mo | $255,000 | $164 | 54 |
| 9232 SW 44th Ter | 0.65mi | 4/2.0 | 1,800 (+11%) | 2mo | $341,150 | $190 | 49 |
| 9221 SW 44th Ter | 0.63mi | 4/2.0 | 1,851 (+14%) | 1mo | $344,875 | $186 | 46 |
| 9329 SW 42nd St | 0.72mi | 4/2.5 | 1,800 (+11%) | 4mo | $344,999 | $192 | 42 |
Match score weights: distance 35% · size 25% · config 20% · recency 20%. Top-matched comps best support the ARV.
Projected returns pro-forma
-3.0% appreciation · 3.0% rent growth · sell at horizon
- IRR
- -8.8%
- Equity multiple
- 0.68×
- Total profit
- $-22,252
- Equity at exit
- $36,530
- IRR
- 0.6%
- Equity multiple
- 1.04×
- Total profit
- $2,971
- Equity at exit
- $21,183
Cash invested: $68,600 (down + closing). Projections, not guarantees.
Landlord ↔ Tenant lean methodology
- Overall (STATE)
- 83 Strongly Landlord-Friendly
- State Oklahoma
- 83 Strongly Landlord-Friendly · R+20
- County
- — inherits STATE
- City
- — inherits STATE
ZIP-level market 73179
- Home prices YoY
- -5.5%
- Active inventory
- 99
- Price-to-rent
- 8.8×
Monthly cashflow live
- Estimated rent
- $2,329 high interval (Pro) →
- Mortgage (P&I)
- −$1,285
- Tax from tax record
- −$178 /mo · $2,137/yr
- Insurance
- −$102
- HOA
- −$0
- Vacancy / Maint / Mgmt
- −$489
- Net cashflow
- $275
Break-even live
UW: 25.0% down · 7.5% · 30yr · 1.5% tax · 5.0% vac · 8.0% maint · 8.0% mgmt
Financing live
Cash to close
- Down payment
- $61,250
- Closing costs
- $7,350
- Reserves months
- —
- Total cash needed
- —
Loan-product check · same deal, 3 products live
Conventional
25% down · 7.5% · 30yr
- Down + closing
- —
- Monthly P&I
- —
- Monthly cashflow
- —
- DSCR
- —
- Eligible?
- —
Personal DTI + credit; lowest rate.
DSCR
20% down · 8.5% · 30yr
- Down + closing
- —
- Monthly P&I
- —
- Monthly cashflow
- —
- DSCR
- —
- Eligible?
- —
No personal income docs; deal must DSCR.
Hard money
10% down · 12.0% · 12mo
- Down + closing
- —
- Monthly P&I
- —
- Monthly cashflow
- —
- DSCR
- —
- Eligible?
- —
Short-term bridge; refi at stabilization.
Rent comps 20 comps
| Address | Beds | Baths | Sqft | Rent | $/sqft | DOM | Units | Dist |
|---|---|---|---|---|---|---|---|---|
| 4101 Western Heights Ave Oklahoma City, OK | 4.0 | 2.5 | 1593 | $3,500 | $2.20 | 3d | 1 | 0.05mi |
| 4517 Hunter Blvd Oklahoma City, OK | 3.0 | 2.0 | 1709 | $1,695 | $0.99 | 23d | 1 | 0.34mi |
| 8913 SW 42nd St Oklahoma City, OK | 3.0 | 2.0 | 1492 | $1,850 | $1.24 | 23d | 1 | 0.35mi |
| 8421 SW 47th Cir Oklahoma City, OK | 3.0 | 2.0 | 1244 | $1,550 | $1.25 | 14d | 1 | 0.42mi |
| 8509 SW 49th Cir Oklahoma City, OK | 4.0 | 2.0 | 1673 | $1,750 | $1.05 | 23d | 1 | 0.54mi |
| 8517 SW 50th St Oklahoma City, OK | 3.0 | 2.0 | 1653 | $1,695 | $1.03 | 23d | 1 | 0.59mi |
| 9028 SW 46th St Oklahoma City, OK | 3.0 | 2.0 | 1250 | $1,575 | $1.26 | 23d | 1 | 0.62mi |
| 9028 SW 46th St Oklahoma City, OK | 3.0 | 2.0 | 1249 | $1,525 | $1.22 | 16d | 1 | 0.62mi |
| 9308 SW 42nd St Oklahoma City, OK | 4.0 | 2.5 | 2100 | $2,650 | $1.26 | 23d | 1 | 0.66mi |
| 9301 SW 44th Ter Oklahoma City, OK | 4.0 | 2.0 | 1891 | $2,249 | $1.19 | 14d | 1 | 0.68mi |
| 9301 SW 44th Ter Oklahoma City, OK | 4.0 | 2.0 | 1891 | $2,249 | $1.19 | 4d | 1 | 0.68mi |
| 9207 SW 47th St Oklahoma City, OK | 3.0 | 2.0 | 1340 | $1,600 | $1.19 | 23d | 1 | 0.76mi |
| 9356 SW 43rd St Oklahoma City, OK | 4.0 | 2.0 | 1814 | $2,199 | $1.21 | 23d | 1 | 0.82mi |
| 4217 Siena Ridge Blvd Oklahoma City, OK | 4.0 | 2.0 | 1840 | $1,695 | $0.92 | 10d | 1 | 1.02mi |
| 5705 Sanderling Rd Oklahoma City, OK | 3.0 | 2.0 | 1560 | $1,650 | $1.06 | 11d | 1 | 1.15mi |
| 5632 Dunlin Rd Oklahoma City, OK | 3.0 | 2.0 | 1319 | $1,540 | $1.17 | 4d | 1 | 1.18mi |
| 5809 Sanderling Rd Oklahoma City, OK | 4.0 | 3.0 | 1910 | $2,015 | $1.05 | 2d | 1 | 1.20mi |
| 9717 SW 40th St Oklahoma City, OK | 3.0 | 2.0 | 1152 | $1,279 | $1.11 | 1d | 1 | 1.24mi |
| 6405 Bent Wood Dr Oklahoma City, OK | 3.0 | 2.0 | 1945 | $2,200 | $1.13 | 2d | 1 | 1.44mi |
| 9532 SW 28th St Oklahoma City, OK | 3.0 | 2.0 | 1532 | $1,595 | $1.04 | 21d | 1 | 1.46mi |
Listing history 16 events
-
2026-06-08statusdays on market $245,000 Pending 90 DOM
-
2026-06-07days on market $245,000 Active 89 DOM
-
2026-06-05days on market $245,000 Active 86 DOM
-
2026-06-03days on market $245,000 Active 85 DOM
-
2026-06-02pricedays on market $245,000 Active 84 DOM
-
2026-06-01days on market $250,000 Active 83 DOM
-
2026-05-31days on market $250,000 Active 82 DOM
-
2026-05-21price $250,000
-
2026-05-07price $255,000
-
2026-03-18status Active
-
2026-03-07$260,000 Active
-
2019-03-04soldstatus $150,000
-
2019-02-28soldstatus $150,000 Sold 535-char remark
Show marketing remark (535 chars)
This TRUE 4-bedroom home is an architectural dream and offers a fantastic layout. This sunlit home has a lot of natural light and a great entertaining flow for gatherings. The kitchen is truly fit for a chef with a breakfast bar and stainless steel appliances. Master Suite has a jetted tub, walk-in closet, tub and separate shower and double vanities. Generous sized secondary bedrooms and a mother-in-law floorplan. Spacious backyard and an incredible location close to highways, retail, schools. Don't miss out, it won't last long!
-
2019-02-02status Pending 535-char remark
Show marketing remark (535 chars)
This TRUE 4-bedroom home is an architectural dream and offers a fantastic layout. This sunlit home has a lot of natural light and a great entertaining flow for gatherings. The kitchen is truly fit for a chef with a breakfast bar and stainless steel appliances. Master Suite has a jetted tub, walk-in closet, tub and separate shower and double vanities. Generous sized secondary bedrooms and a mother-in-law floorplan. Spacious backyard and an incredible location close to highways, retail, schools. Don't miss out, it won't last long!
-
2019-01-31$150,000 Active 535-char remark
Show marketing remark (535 chars)
This TRUE 4-bedroom home is an architectural dream and offers a fantastic layout. This sunlit home has a lot of natural light and a great entertaining flow for gatherings. The kitchen is truly fit for a chef with a breakfast bar and stainless steel appliances. Master Suite has a jetted tub, walk-in closet, tub and separate shower and double vanities. Generous sized secondary bedrooms and a mother-in-law floorplan. Spacious backyard and an incredible location close to highways, retail, schools. Don't miss out, it won't last long!
-
2005-08-16soldstatus $18,000
ⓘ Source: listings_history table (triggers on properties + properties_extension) + one-shot
backfill from property_details.listing_events for pre-trigger history.
Tax reassessment forecast OK · Resets to sale price
- Current annual tax
- $2,137 · $178/mo
- Projected year-2 tax
- $2,205 · $184/mo
- Expected delta
- +$68/yr (+$6/mo · 3.2%)
ⓘ Screening estimate from a state-policy table — verify with the county assessor before closing.
Climate risk First Street
- Flood 1/10 Low FEMA zone X (unshaded) · 0% chance over 30 yrs
- Wildfire 5/10 Major
- Heat 6/10 Major 7 d/yr ≥106°F today · 19 d/yr by 30 yrs out
- Wind 2/10 Low 4% chance of damaging wind over 30 yrs
- Air quality 1/10 Low 0 unhealthy d/yr today · 0 by 30 yrs out
Nearby sold comps map
Loading sold comps map…
Walkable amenities ~0.75 mi
Loading nearby amenities…
Taxation est. · year 1
- Rental income
- $27,943
- − Mortgage interest
- −$13,724
- − Property taxes
- −$2,137
- − Insurance
- −$1,225
- − Repairs & maintenance
- −$2,235
- − Management
- −$2,235
- − Depreciation
- −$7,127
- Taxable loss
- −$740
- Est. tax savings @ 24.0%
- +$178
- After-tax cash flow
- $3,474/yr
For passive investors: Depreciation is non-cash, so a rental often shows a tax loss while cash-flowing — sheltering income. Rental losses are passive: they offset passive income freely, and up to $25,000/yr can offset ordinary (W-2) income if you actively participate and your MAGI is under $100k (phasing out to $0 by $150k); unused losses carry forward. On sale, claimed depreciation is recaptured at up to 25%, and gains may owe capital-gains tax (a 1031 exchange can defer both). Figures are a year-1 estimate at your 24.0% rate — not tax advice; consult a CPA.
Schools (NCES district)
- District
- Mustang
- NCES district ID
- 4021000
- Math proficiency
- 35% ▼ -10.00%
- Reading proficiency
- 33% ▼ -7.00%
- Median HH income
- $67,559
- Composite
- 31.21/100
- National rank
- #6038
- State rank
- #28 of 270 in OK
Livability — Oklahoma City
- Score
- 80/100
- State rank
- #3
- US rank
- #1635
Category grades
Schools grade is shown separately in the Schools card above.
Census & demographics
- Census place
- Oklahoma City, OK
- County
- Oklahoma County · 771,644 people
- City population
- 498,656
- Metro
- Oklahoma City, OK
- Population (ZIP)
- 8,532
- Household income
- $112,656
- Rent vs Own
- Severe rent burden
- 144.0
Population outlook (Oklahoma County) Hauer SSP2
- Today (2025)
- 911,875 people
- By 2030
- 982,413 · +7.7%
- By 2040
- 1,130,468 · +24.0%
- By 2050
- 1,288,422 · +41.3%
- By 2075
- 1,711,482 · +87.7%
- By 2100
- 2,088,448 · +129.0%
Race, ethnicity, and origin ACS 2023
- Neighborhood character
- Diverse neighborhood (Simpson 0.65)
- Race & ethnicity
- White 55% Hispanic / Latino 18% Two or more races 15% Asian 10% Black 6% Native American 1%
- Hispanic origin (detail)
- Mexican 16%
- Common ancestry
- Slovak 3% Italian 1% Serbian 1%
- Foreign-born
- 14% · Vietnam, Canada, Philippines
- Languages at home
- 77% English-only · Spanish 9% Vietnamese 8% Other Asian/Pacific 2%
Political lean MEDSL · Oklahoma
- 2024 margin
- Toss-up / Even · D 48.0% · R 49.7% · Other 2.3%
- 2008→2024 swing
- +15.1pp toward D · 2008: -16.8pp · 2024: -1.7pp
- All cycles
- 2024: R+1.7 2020: R+1.1 2016: R+10.5 2012: R+16.7 2008: R+16.8
Not yet ingested
- Civics
- —
Market trends
- HPI YoY
- ▼ -13.22%
- Current HPI
- 229.2484
- Rent YoY
- —
- Metro
- Oklahoma City, OK
- State GDP YoY
- ▲ 1.55%
- F500 in state
- 6
Industry mix (Fortune 500 HQ in OK)
| Industry | F500 HQs | Revenue |
|---|---|---|
| Energy | 3 | $48B |
|
||
Price history
+1288.9% since first listed9 events — show timeline
- 2026-05-21 Price Changed $250,000 MLSOK
- 2026-05-07 Price Changed $255,000 MLSOK
- 2026-03-18 Relisted — MLSOK
- 2026-03-07 Listed $260,000 MLSOK
- 2019-03-04 Sold (Public Records) $150,000 Public Records
- 2019-02-28 Sold (MLS) $150,000 MLSOK
- 2019-02-02 Pending — MLSOK
- 2019-01-31 Listed $150,000 MLSOK
- 2005-08-16 Sold (Public Records) $18,000 Public Records
Property tax history
+2.1%/yrLatest (2025): $2,137 · +4.4% YoY. Source: county tax records.
Cash-flow waterfall
monthlySold comps — $/sqft
last 12 mo · ≤1 miLoading sold comps…