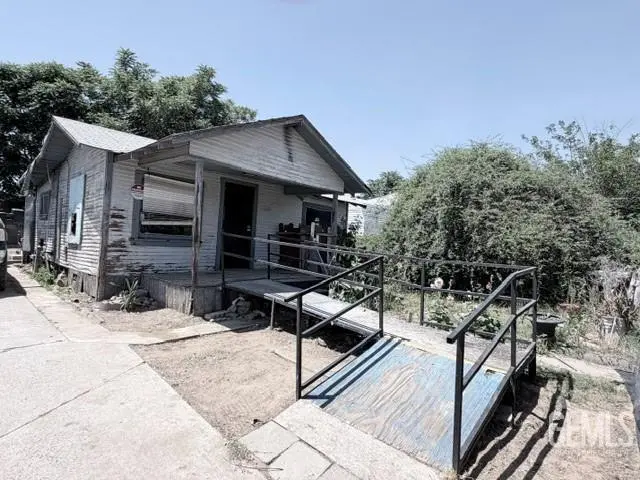
527 Locust St · Oildale, CA
Flood risk 1/10 · Minimal
- FEMA flood zone
- X (unshaded)
- Chance of flooding over 30 yrs
- 0.0%
- Est. flood insurance / yr
- $507 – $1,088
Fire risk 3/10 · Minor
- Est. fire insurance / yr
- $659 – $1,223
Heat risk 8/10 · Major
- Hot days now (above 105°F)
- 7 days/yr
- Hot days in 30 yrs
- 18 days/yr
Wind risk 1/10 · Minimal
- Chance of severe wind over 30 yrs
- —
Air-quality risk 10/10 · Severe
- Unhealthy air days now
- 39 days/yr
- Unhealthy air days in 30 yrs
- 45 days/yr
Risk factors via First Street. Map © Google.
Why this score? — see what drove the C grade
The composite is a weighted blend of 9 inputs, each scored 0–100. Each bar is that input's sub-score; the figure is the points it added to the 100-point composite (weight × sub-score).
- Cash flow +20.3/30.0
- ARV discount +15.0/15.0
- DSCR +6.4/10.0
- 1% rule +5.5/10.0
- Rent growth +3.1/5.0
- Livability +2.9/5.0
- Appreciation +2.7/10.0
- Condition / age +2.5/5.0
- Schools +1.0/10.0
$124,900
🖨 Deal sheet 📄 Offer letter ✓ Due diligence
Listing remarks
Terrible Home North of The River!! This 3 Bed, 1 Bath Home is so bad even the roaches moved out!! Need pretty much everything repaired or replaced, It's fully fenced, has extra large 2 car garage with shop area partially converted to ADU on good sized lot
Key facts
- Extra large garage
- Fully fenced
- Good sized lot
Tags
Property features AI
Exterior
- Parking: 2-car garage
- Utilities: Public water
- Home design: Pre-owned
- Construction: Composition roof
- Exterior features: Vacant property
Interior
- Bathrooms: 1 full bathroom
- Heating & cooling: Central heat and central A/C
- Interior features: Central air conditioning; Central heating
Neighborhood map
What this means for you Summary
Snapshot
- This is a 2-bed/1.0-bath single-family listed at $125k.
Deal economics
- At list price, monthly cash flow is $160 ($2k/yr) — positive.
- The deal already cash-flows at list — no discount required.
- Meets the 1% rule at list price ($1k rent vs $125k).
- Cap rate 7.8% vs local median 3.9% in Oildale — top-decile yield for the area; either an underpriced asset or a hidden risk that comps aren't pricing in. Stress-test before assuming the spread holds.
Location & tenants
- Location reads 58/100 on livability (#680 in CA) — a working-class tenant base; expect higher turnover. Strengths: housing A+; Watch: crime F, amenities F, commute F.
- Beardsley Elementary (suburban): math 7% / reading 18% proficiency, ranked #501 of 517 in CA (top 97%) — low school quality limits family demand, transient renter base, plan for 1-2y turnover; 76% free/reduced lunch — lower-income household profile, screen leases tightly.
- Zoned schools: Beardsley Elementary (math 2% / reading 8%, grade F, #1,564 of 1,571 statewide, top 100%, 421 students, 98% FRL) — zoned schools average 98% FRL vs 76% district-wide (22 pts higher); higher-poverty schools than district average — tighter screening recommended.
- Market conditions: Rents rising (+2.2%/yr); 307 active listings in the ZIP; 40 comparable units currently listed for rent nearby; rentals leasing fast (median 3d on market — plan ~1-2 weeks tenant-placement turnaround); 3,244 units permitted in Kern County in 2024 (73 in 5+ unit buildings).
Forward outlook
- Local home prices are declining (-3.0%/yr); year-one equity from $864 of loan paydown is wiped out by about $4k of value loss. Plan a longer hold.
- Kern County population projected at +17% by 2050 — long-run rental-demand tailwind backs the buy-and-hold thesis.
Negotiation context
- Only 7 days on market — expect competitive offers; lowballing is unlikely to land.
- Current owner paid $75k; list at $125k implies a 67% gain — meaningful room to come down on a strong offer.
Risks & watch-outs
- Watch-outs: built in 1937 — expect roof / HVAC / electrical / plumbing capex.
- Climate carrying-cost: extreme-heat days projected 7→18/yr by 2055 (HVAC capex compounding) — expect insurance premiums to compound above CPI over the hold.
Questions for the listing agent
- Built in 1937 — when were the roof, HVAC, electrical panel, plumbing, and water heater last replaced?
- Is there a deadline driving the sale (1031 exchange, divorce, estate, relocation)? That informs how much negotiation room exists.
- Schools are B-rated — typically a magnet for longer-tenancy family renters. What's the average tenant stay here, and is there a school-zone premium baked into asking?
- Crime grade is F in this area — have there been break-ins, vandalism, or insurance claims at this property in the last 3 years? What carrier currently insures it and at what premium?
- What's the average days-on-market for RENTAL listings here right now (not sales)? A rising rental-DOM trend means longer vacancies and softer asking-rent achievability than the comps imply.
- What's the recent tenant-quality profile in this submarket — average credit score on applications, eviction rate, late-payment / NSF rate, and stable-employment percentage? A property-management company in the area should have these aggregated.
- How much new for-sale + rental construction is in the pipeline within 1–3 miles? Heavy new supply typically softens prices + rents 12–24 months out; constrained supply supports both.
Investment metrics
- 1% rule
- 1.05% ✓
- Cap rate
- 7.83%
- Cash-on-cash
- 5.50%
- DSCR
- 1.24
- GRM
- 7.9
CMA / ARV
- ARV (on-the-fly)
- $224,388
- Comps found
- 12
Show comp detail 12 sales within ~0.75 mi
| Address | Dist | Beds/Ba | Sqft | Sold | Price | $/sf | Match |
|---|---|---|---|---|---|---|---|
| 527 Locust St | 0.00mi | 3/1.0 (+1) | 813 (0%) | 0mo | $128,000 | $157 | 95 |
| 336 Warren Ave | 0.10mi | 2/1.0 | 858 (+6%) | 7mo | $240,000 | $280 | 80 |
| 515 Lincoln Ave | 0.27mi | 2/1.0 | 852 (+5%) | 0mo | $215,000 | $252 | 79 |
| 506 Washington Ave | 0.34mi | 2/1.0 | 786 (-3%) | 6mo | $235,000 | $299 | 74 |
| 414 Woodrow Ave | 0.38mi | 2/1.0 | 861 (+6%) | 2mo | $233,000 | $271 | 70 |
| 711 Huskey Dr | 0.63mi | 2/1.0 | 816 (+0%) | 3mo | $225,000 | $276 | 68 |
| 216 Decatur St | 0.29mi | 2/1.0 | 914 (+12%) | 2mo | $215,000 | $235 | 64 |
| 350 S Oildale Dr | 0.51mi | 2/1.0 | 875 (+8%) | 1mo | $265,000 | $303 | 63 |
| 1600 Hurrle | 0.67mi | 2/1.0 | 789 (-3%) | 2mo | $225,000 | $285 | 62 |
| 309 El Tejon Ave | 0.50mi | 2/1.0 | 760 (-6%) | 7mo | $265,000 | $349 | 60 |
| 115 Hart | 0.70mi | 2/1.0 | 888 (+9%) | 6mo | $140,000 | $158 | 46 |
| 501 Belmont Ave #16 | 0.49mi | 2/2.0 | 924 (+14%) | 7mo | $35,500 | $38 | 44 |
Match score weights: distance 35% · size 25% · config 20% · recency 20%. Top-matched comps best support the ARV.
Projected returns pro-forma
-3.0% appreciation · 2.22% rent growth · sell at horizon
- IRR
- -8.7%
- Equity multiple
- 0.68×
- Total profit
- $-11,025
- Equity at exit
- $18,623
- IRR
- -0.2%
- Equity multiple
- 0.99×
- Total profit
- $-469
- Equity at exit
- $10,799
Cash invested: $34,972 (down + closing). Projections, not guarantees.
Landlord ↔ Tenant lean methodology
- Overall (STATE)
- 18 Strongly Tenant-Friendly
- State California
- 18 Strongly Tenant-Friendly · D+13
- County
- — inherits STATE
- City
- — inherits STATE
ZIP-level market 93308
- Home prices YoY
- -0.5%
- Rents YoY
- 2.2%
- Active inventory
- 307
- Price-to-rent
- 7.9×
Monthly cashflow live
- Estimated rent
- $1,311 high interval (Pro) →
- Mortgage (P&I)
- −$655
- Tax from tax record
- −$169 /mo · $2,024/yr
- Insurance
- −$52
- HOA
- −$0
- Vacancy / Maint / Mgmt
- −$275
- Net cashflow
- $160
Break-even live
UW: 25.0% down · 7.5% · 30yr · 1.5% tax · 5.0% vac · 8.0% maint · 8.0% mgmt
Financing live
Cash to close
- Down payment
- $31,225
- Closing costs
- $3,747
- Reserves months
- —
- Total cash needed
- —
Loan-product check · same deal, 3 products live
Conventional
25% down · 7.5% · 30yr
- Down + closing
- —
- Monthly P&I
- —
- Monthly cashflow
- —
- DSCR
- —
- Eligible?
- —
Personal DTI + credit; lowest rate.
DSCR
20% down · 8.5% · 30yr
- Down + closing
- —
- Monthly P&I
- —
- Monthly cashflow
- —
- DSCR
- —
- Eligible?
- —
No personal income docs; deal must DSCR.
Hard money
10% down · 12.0% · 12mo
- Down + closing
- —
- Monthly P&I
- —
- Monthly cashflow
- —
- DSCR
- —
- Eligible?
- —
Short-term bridge; refi at stabilization.
Rent comps 40 comps
| Address | Beds | Baths | Sqft | Rent | $/sqft | DOM | Units | Dist |
|---|---|---|---|---|---|---|---|---|
| 222 Harding Ave Unit B Bakersfield, CA | 3.0 | 2.0 | 1100 | $1,750 | $1.59 | 2d | 1 | 0.21mi |
| 213 Oildale Dr Unit A Bakersfield, CA | 2.0 | 2.0 | 928 | $1,195 | $1.29 | 2d | 1 | 0.22mi |
| 222 Moneta Ave Unit 222 Bakersfield, CA | 3.0 | 2.0 | 1040 | $1,700 | $1.63 | 2d | 1 | 0.22mi |
| 419 Washington Ave Unit 417 Bakersfield, CA | 3.0 | 2.0 | 975 | $1,500 | $1.54 | 2d | 1 | 0.30mi |
| 327 McCord Ave Unit 6 Bakersfield, CA | 3.0 | 1.0 | 1000 | $1,500 | $1.50 | 2d | 1 | 0.31mi |
| 120 Harding Ave Unit D Bakersfield, CA | 1.0 | 1.0 | 1000 | $900 | $0.90 | 2d | 1 | 0.34mi |
| 502 Beardsley Ave Unit T Bakersfield, CA | 1.0 | 1.0 | 624 | $950 | $1.52 | 43d | 1 | 0.40mi |
| 313 Beardsley Ave Unit 315 B Bakersfield, CA | 1.0 | 1.0 | 550 | $850 | $1.55 | 2d | 1 | 0.45mi |
| 214 Beardsley Ave Unit 11 Bakersfield, CA | 1.0 | 1.0 | 650 | $950 | $1.46 | 2d | 1 | 0.47mi |
| 214 Beardsley Ave Unit 12 Bakersfield, CA | 2.0 | 2.0 | 655 | $1,095 | $1.67 | 2d | 1 | 0.47mi |
| 611 Wilson Ave Unit B Bakersfield, CA | 2.0 | 1.0 | 750 | $1,195 | $1.59 | 43d | 1 | 0.48mi |
| 210 Beardsley Ave Unit 8 Bakersfield, CA | 1.0 | 1.0 | 650 | $895 | $1.38 | 2d | 1 | 0.49mi |
| 501 Belmont Ave Bakersfield, CA | 1.0 | 1.0 | 1000 | $625 | $0.62 | 43d | 1 | 0.50mi |
| 627 Beardsley Ave Bakersfield, CA | 3.0 | 1.0 | 967 | $1,575 | $1.63 | 43d | 1 | 0.51mi |
| 126 Wilson Ave Unit B Bakersfield, CA | 1.0 | 1.0 | 650 | $850 | $1.31 | 14d | 1 | 0.56mi |
| 706 Huskey Dr Bakersfield, CA | 2.0 | 1.0 | 832 | $1,450 | $1.74 | 43d | 1 | 0.60mi |
| 448 S Oildale Dr Bakersfield, CA | 3.0 | 2.0 | 1080 | $1,500 | $1.39 | 2d | 1 | 0.60mi |
| 819 Washington Ave Bakersfield, CA | 2.0 | 1.0 | 767 | $1,295 | $1.69 | 2d | 1 | 0.60mi |
| 1405 Yosemite Dr Unit 1405 Bakersfield, CA | 2.0 | 1.0 | 712 | $1,100 | $1.54 | 43d | 1 | 0.60mi |
| 117 Harris Dr Bakersfield, CA | 2.0 | 1.0 | 560 | $1,300 | $2.32 | 19d | 1 | 0.62mi |
| 811 Beardsley Ave Bakersfield, CA | 2.0 | 1.0 | 800 | $1,295 | $1.62 | 2d | 1 | 0.64mi |
| 214 E Belle Ave Unit A Bakersfield, CA | 1.0 | 1.0 | 875 | $1,250 | $1.43 | 2d | 1 | 0.67mi |
| 611 Ann Arbor Dr Unit A Bakersfield, CA | 1.0 | 1.0 | 650 | $1,100 | $1.69 | 43d | 1 | 0.67mi |
| 901 Castaic Ave Bakersfield, CA | 2.0 | 1.0 | 1076 | $1,700 | $1.58 | 2d | 1 | 0.79mi |
| 415 Arvin St Bakersfield, CA | 1.0 | 1.0 | 800 | $1,000 | $1.25 | 2d | 1 | 0.82mi |
| 1905 McCray St Bakersfield, CA | 2.0 | 1.0 | 736 | $1,450 | $1.97 | 2d | 1 | 0.88mi |
| 411 Highland Dr Bakersfield, CA | 2.0 | 1.0 | 1051 | $1,650 | $1.57 | 2d | 1 | 0.96mi |
| 615 W China Grade Loop Bakersfield, CA | 1.0–2.0 | 1.0–2.0 | 875 | $1,850 | $2.11 | 2d | 6 | 1.10mi |
| 3333 El Encanto Ct Bakersfield, CA | 2.0 | 1.5 | 990 | $1,495 | $1.51 | 2d | 1 | 1.22mi |
| 3333 El Encanto Ct Bakersfield, CA | 2.0 | 2.0 | 990 | $1,595 | $1.61 | 14d | 1 | 1.22mi |
| 3817 K St Unit A Bakersfield, CA | 2.0 | 1.0 | 763 | $1,285 | $1.68 | 2d | 1 | 1.26mi |
| 2301 Olympic Dr Unit C Bakersfield, CA | 1.0 | 1.0 | 756 | $1,095 | $1.45 | 2d | 1 | 1.28mi |
| 1201 40th St Bakersfield, CA | 2.0–3.0 | 1.0–2.0 | 870 | $1,075 | $1.23 | 2d | 1 | 1.29mi |
| 901 W Columbus St Unit 266 Bakersfield, CA | 2.0 | 1.0 | 864 | $1,325 | $1.53 | 21d | 1 | 1.31mi |
| 1951 Golden State Ave Bakersfield, CA | 1.0–3.0 | 1.0–2.5 | 1017 | $1,445 | $1.42 | 2d | 2 | 1.32mi |
| 2600 Park Meadows Dr Bakersfield, CA | 1.0–2.0 | 1.0–2.0 | 864 | $1,495 | $1.73 | 2d | 2 | 1.33mi |
| 1319 Wilson Ave Apt E Bakersfield, CA | 1.0 | 1.0 | 600 | $850 | $1.42 | 2d | 1 | 1.33mi |
| 901 W Columbus St Unit 236 Bakersfield, CA | 2.0 | 1.0 | 864 | $1,325 | $1.53 | 43d | 1 | 1.36mi |
| 901 W Columbus St Apt 232 Bakersfield, CA | 2.0 | 1.0 | 864 | $1,165 | $1.35 | 21d | 1 | 1.37mi |
| 901 W Columbus St Bakersfield, CA | 1.0–2.0 | 1.0 | 807 | $1,425 | $1.77 | 2d | 12 | 1.37mi |
Listing history 3 events
-
2026-05-19$124,900 Active
-
2025-12-15soldstatus $75,000
-
1992-02-14soldstatus $47,000
ⓘ Source: listings_history table (triggers on properties + properties_extension) + one-shot
backfill from property_details.listing_events for pre-trigger history.
Tax reassessment forecast CA · Resets to sale price
- Current annual tax
- $2,024 · $169/mo
- Projected year-2 tax
- $2,024 · $169/mo
- Expected delta
- $0/yr ($0/mo · 0.0%)
ⓘ Screening estimate from a state-policy table — verify with the county assessor before closing.
Climate risk First Street
- Flood 1/10 Low FEMA zone X (unshaded) · 0% chance over 30 yrs
- Wildfire 3/10 Moderate
- Heat 8/10 Severe 7 d/yr ≥105°F today · 18 d/yr by 30 yrs out
- Wind 1/10 Low
- Air quality 10/10 Extreme 39 unhealthy d/yr today · 45 by 30 yrs out
Nearby sold comps map
Loading sold comps map…
Walkable amenities ~0.75 mi
Loading nearby amenities…
Taxation est. · year 1
- Rental income
- $15,736
- − Mortgage interest
- −$6,996
- − Property taxes
- −$2,024
- − Insurance
- −$624
- − Repairs & maintenance
- −$1,259
- − Management
- −$1,259
- − Depreciation
- −$3,633
- Taxable loss
- −$60
- Est. tax savings @ 24.0%
- +$14
- After-tax cash flow
- $1,938/yr
For passive investors: Depreciation is non-cash, so a rental often shows a tax loss while cash-flowing — sheltering income. Rental losses are passive: they offset passive income freely, and up to $25,000/yr can offset ordinary (W-2) income if you actively participate and your MAGI is under $100k (phasing out to $0 by $150k); unused losses carry forward. On sale, claimed depreciation is recaptured at up to 25%, and gains may owe capital-gains tax (a 1031 exchange can defer both). Figures are a year-1 estimate at your 24.0% rate — not tax advice; consult a CPA.
Schools (NCES district)
- District
- Beardsley Elementary
- NCES district ID
- 0604260
- Math proficiency
- 7% ▼ -12.00%
- Reading proficiency
- 18% ▼ -16.00%
- Median HH income
- $28,808
- Composite
- 9.63/100
- National rank
- #9841
- State rank
- #501 of 517 in CA
Livability — Oildale
- Score
- 58/100
- State rank
- #680
- US rank
- #20848
Category grades
Schools grade is shown separately in the Schools card above.
Census & demographics
- Census place
- Oildale, CA
- County
- Kern County · 710,371 people
- Metro
- Bakersfield, CA
- Population (ZIP)
- 55,078
- Household income
- $62,445
- Rent vs Own
- Severe rent burden
- 2931.0
Population outlook (Kern County) Hauer SSP2
- Today (2025)
- 947,286 people
- By 2030
- 978,984 · +3.3%
- By 2040
- 1,045,018 · +10.3%
- By 2050
- 1,105,232 · +16.7%
- By 2075
- 1,229,538 · +29.8%
- By 2100
- 1,238,059 · +30.7%
Race, ethnicity, and origin ACS 2023
- Neighborhood character
- Diverse neighborhood (Simpson 0.57)
- Race & ethnicity
- White 57% Hispanic / Latino 32% Two or more races 15% Black 3% Asian 3% Native American 1%
- Hispanic origin (detail)
- Mexican 26%
- Common ancestry
- Slovak 3% Italian 1% Romanian 1%
- Foreign-born
- 8% · Canada, Vietnam
- Languages at home
- 80% English-only · Spanish 17%
Political lean MEDSL · Kern
- 2024 margin
- Strong R (+21.1) · D 38.2% · R 59.3% · Other 2.5%
- 2008→2024 swing
- -3.3pp toward R · 2008: -17.8pp · 2024: -21.1pp
- All cycles
- 2024: R+21.1 2020: R+10.2 2016: R+15.0 2012: R+20.9 2008: R+17.8
Not yet ingested
- Civics
- —
Market trends
- HPI YoY
- ▼ -4.52%
- Current HPI
- 825.65
- Rent YoY
- ▲ 2.22%
- Metro
- Bakersfield, CA
- State GDP YoY
- ▲ 3.21%
- F500 in state
- 116
Industry mix (Fortune 500 HQ in CA)
| Industry | F500 HQs | Revenue |
|---|---|---|
| Technology | 27 | $1,492B |
|
||
| Financial Services | 3 | $174B |
|
||
| Retail | 3 | $44B |
|
||
| Insurance | 3 | $26B |
|
||
| Media / Entertainment | 2 | $115B |
|
||
| Pharmaceuticals / Biotech | 2 | $62B |
|
||
Price history
+165.7% since first listed3 events — show timeline
- 2026-05-19 Listed $124,900 GEMLS
- 2025-12-15 Sold (Public Records) $75,000 Public Records
- 1992-02-14 Sold (Public Records) $47,000 Public Records
Property tax history
+5.1%/yrLatest (2025): $2,024 · +3.5% YoY. Source: county tax records.
Cash-flow waterfall
monthlySold comps — $/sqft
last 12 mo · ≤1 miLoading sold comps…