 Duplex
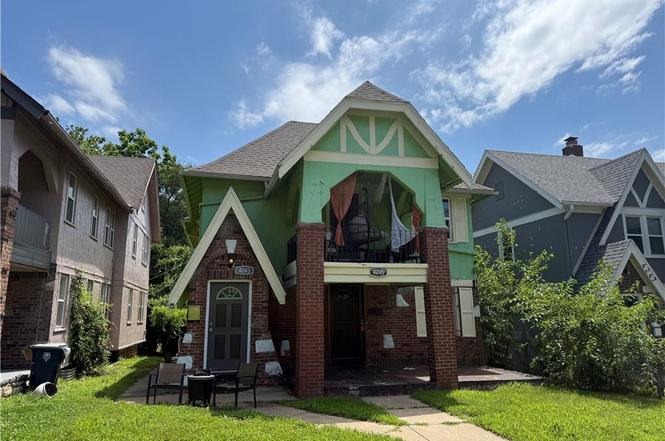
4245 Paseo Blvd · Kansas City, MO
Flood risk 1/10 · Minimal
- FEMA flood zone
- X (unshaded)
- Chance of flooding over 30 yrs
- 0.0%
- Est. flood insurance / yr
- $473 – $860
Fire risk 1/10 · Minimal
- Est. fire insurance / yr
- $1,054 – $1,958
Heat risk 4/10 · Minor
- Hot days now (above 106°F)
- 7 days/yr
- Hot days in 30 yrs
- 17 days/yr
Wind risk 2/10 · Minimal
- Chance of severe wind over 30 yrs
- —
Air-quality risk 3/10 · Minor
- Unhealthy air days now
- 2 days/yr
- Unhealthy air days in 30 yrs
- 4 days/yr
Risk factors via First Street. Map © Google.
Why this score? — see what drove the B- grade
The composite is a weighted blend of 9 inputs, each scored 0–100. Each bar is that input's sub-score; the figure is the points it added to the 100-point composite (weight × sub-score).
- Cash flow +29.0/30.0
- DSCR +10.0/10.0
- 1% rule +7.9/10.0
- ARV discount +7.5/15.0
- Livability +3.9/5.0
- Rent growth +3.5/5.0
- Condition / age +2.5/5.0
- Schools +1.5/10.0
- Appreciation +0.0/10.0
$229,900
🖨 Deal sheet 📄 Offer letter ✓ Due diligence
Multi-family units
County records classify this as Multi-Family (2-4 Unit). Listing-text estimate: 2 units. confirmed
Listing remarks MLS
Back on the Market. Looking for an investment property close to Rockhurst Univ/UMKC. .. .look no further in this up and coming neighborhood. Last updated in 2019 with new floors, paint, vinyl windows, kitchen cabinets/countertops, and garage doors. Each apartment has a private entrance and basement with an individual garage for each unit. Easy access to highway. Great opportunity for a turnkey operation. Each unit has approximately the same configuration: LR: 12x21, DR: 11x12, Kit: 8x14, Bath: 5x9, BR1: 12x10.5, BR2: 12x10.5, BR3: 10x6. Upper unit has new furnace/AC unit recently installed, as well as complete in/out exterminator treatment. Carpet has been professionally cleaned.
Key facts
- Centrally located
- 4,296 sq ft lot
- Garage
Tags
Property features AI
Finance
- Other: Zoning: R-1.5; Current occupancy under 80%
- Financial info: Gross income reported at $21,600; Operating expenses include insurance and real estate tax
- HOA & community: No association fees
Exterior
- Parking: Attached garage; Street parking
- Utilities: Public water; Public sewer; Individual heating and air; Independent water heaters
- Home design: Residential income duplex; Two-story
- Construction: Stucco and frame construction; Composition roof; Has basement; Estimated age: 76–100 years
- Exterior features: Porch; Balcony; Private entrance; Rear driveway with alley access; Lot approximately 37 x 115 (4,296 sq ft)
Interior
- Kitchen: Dishwasher; Electric range; Refrigerator
- Bedrooms: Two 3-bedroom units
- Bathrooms: Each unit has 1 bathroom
- Heating & cooling: Forced air heating; Electric cooling
- Interior features: Central laundry; Basement laundry; Disposal; Exhaust fan; Private entrances; Balcony; Porch
- Laundry & utility: Washer and dryer included; Independent water heaters
Neighborhood map
What this means for you Summary
Snapshot
- This is a 2 × 3-bed/1.0-bath units multifamily listed at $230k.
Deal economics
- At list price, monthly cash flow is $787 ($9k/yr) — positive. Per door: $394/mo.
- The deal already cash-flows at list — no discount required.
- Meets the 1% rule at list price ($3k rent vs $230k).
- Cap rate 10.4% vs local median 3.9% in Kansas City — top-decile yield for the area; either an underpriced asset or a hidden risk that comps aren't pricing in. Stress-test before assuming the spread holds.
Location & tenants
- Location reads 78/100 on livability (#28 in MO, #2,671 nationally) — a middle-class / working-renter tenant base. Strengths: amenities A+, commute A+, cost of living A+; Watch: schools C-, crime F.
- Kansas City 33 (urban): math 12% / reading 24% proficiency, ranked #308 of 324 in MO (top 95%) — low school quality limits family demand, transient renter base, plan for 1-2y turnover; 75% free/reduced lunch — lower-income household profile, screen leases tightly.
- Market conditions: Rents rising (+4.0%/yr); tight market (median 1 DOM); 125 active listings in the ZIP; 23 comparable units currently listed for rent nearby; rentals at typical pace (median 20d on market — plan ~3-4 weeks tenant-placement turnaround); 4,002 units permitted in Jackson County in 2024 (2,271 in 5+ unit buildings).
- At $2,974/mo this rent would consume 57% of the median local household income ($63k/yr) (locally 962% of renters already pay >50% of income on rent) — very limited rent-growth headroom before tenants either downsize or default.
Forward outlook
- Local home prices are declining (-3.0%/yr); year-one equity from $2k of loan paydown is wiped out by about $7k of value loss. Plan a longer hold.
- Jackson County population projected at +4% by 2050 — modest demand growth; plan on rents tracking national, not racing it.
- At projected returns (-3.0% appreciation + 4.0% rent growth), your $64k cash investment doubles in ~8 years — after that, you're playing with house money.
Negotiation context
- Only 2 days on market — expect competitive offers; lowballing is unlikely to land.
- 7 sale attempts since 7y ago with the ask held roughly flat each time — persistent listings suggest the price (not the market) is what's stuck; bring a comps-based counter.
Risks & watch-outs
- Watch-outs: built in 1930 — expect roof / HVAC / electrical / plumbing capex.
Questions for the listing agent
- Can we see the unit-by-unit rent roll, current vacancy, and any below-market leases? What's the average tenancy length?
- What capital expenditures (roof, boiler, parking lot, exteriors) have been made in the last 5 years, and what's planned in the next 2?
- Built in 1930 — when were the roof, HVAC, electrical panel, plumbing, and water heater last replaced?
- Is there a deadline driving the sale (1031 exchange, divorce, estate, relocation)? That informs how much negotiation room exists.
- Crime grade is F in this area — have there been break-ins, vandalism, or insurance claims at this property in the last 3 years? What carrier currently insures it and at what premium?
- What's the average days-on-market for RENTAL listings here right now (not sales)? A rising rental-DOM trend means longer vacancies and softer asking-rent achievability than the comps imply.
- What's the recent tenant-quality profile in this submarket — average credit score on applications, eviction rate, late-payment / NSF rate, and stable-employment percentage? A property-management company in the area should have these aggregated.
- How much new apartment / multifamily construction is in the pipeline within 1–3 miles? Heavy new supply (>2% of stock underway) typically softens rents 12–24 months out; light construction supports rent growth.
Investment metrics
- 1% rule
- 1.29% ✓
- Cap rate
- 10.40%
- Cash-on-cash
- 14.68%
- DSCR
- 1.65
- GRM
- 6.4
CMA / ARV
No comps found within radius.
Projected returns pro-forma
-3.0% appreciation · 3.95% rent growth · sell at horizon
- IRR
- 6.2%
- Equity multiple
- 1.25×
- Total profit
- $15,795
- Equity at exit
- $34,279
- IRR
- 16.4%
- Equity multiple
- 2.41×
- Total profit
- $90,452
- Equity at exit
- $19,878
Cash invested: $64,372 (down + closing). Projections, not guarantees.
Landlord ↔ Tenant lean methodology
- Overall (STATE)
- 81 Strongly Landlord-Friendly
- State Missouri
- 81 Strongly Landlord-Friendly · R+10
- County
- — inherits STATE
- City
- — inherits STATE
ZIP-level market 64110
- Rents YoY
- 4.0%
- Median DOM (111 sales)
- 1 d
- Active inventory
- 125
- Price-to-rent
- 12.9×
Monthly cashflow live
- Estimated rent
- $2,974 high interval (Pro) →
- Mortgage (P&I)
- −$1,206
- Tax from tax record
- −$261 /mo · $3,128/yr
- Insurance
- −$96
- HOA
- −$0
- Vacancy / Maint / Mgmt
- −$625
- Net cashflow
- $787
Break-even live
2-unit breakdown (identical units grouped — click to expand)
| Units | Beds | Baths | Est. rent |
|---|---|---|---|
| 2× units | 3 | 1 | $2,974 |
| #1 | 3 | 1 | $1,487 |
| #2 | 3 | 1 | $1,487 |
| Total (2 units) | $2,974 | ||
UW: 25.0% down · 7.5% · 30yr · 1.5% tax · 5.0% vac · 8.0% maint · 8.0% mgmt
Financing live
Cash to close
- Down payment
- $57,475
- Closing costs
- $6,897
- Reserves months
- —
- Total cash needed
- —
Loan-product check · same deal, 3 products live
Conventional
25% down · 7.5% · 30yr
- Down + closing
- —
- Monthly P&I
- —
- Monthly cashflow
- —
- DSCR
- —
- Eligible?
- —
Personal DTI + credit; lowest rate.
DSCR
20% down · 8.5% · 30yr
- Down + closing
- —
- Monthly P&I
- —
- Monthly cashflow
- —
- DSCR
- —
- Eligible?
- —
No personal income docs; deal must DSCR.
Hard money
10% down · 12.0% · 12mo
- Down + closing
- —
- Monthly P&I
- —
- Monthly cashflow
- —
- DSCR
- —
- Eligible?
- —
Short-term bridge; refi at stabilization.
Rent comps 23 comps
| Address | Beds | Baths | Sqft | Rent | $/sqft | DOM | Units | Dist |
|---|---|---|---|---|---|---|---|---|
| 4211 Woodland Ave Kansas City, MO | 4.0 | 2.5 | 1926 | $2,010 | $1.04 | 16d | 1 | 0.28mi |
| 4440 Troost Ave Kansas City, MO | 5.0 | 2.0 | 2400 | $2,250 | $0.94 | 43d | 1 | 0.36mi |
| 4444 Troost Ave Kansas City, MO | 5.0 | 2.0 | 2400 | $2,250 | $0.94 | 43d | 1 | 0.36mi |
| 4031 Campbell St Kansas City, MO | 4.0 | 1.5 | 2074 | $2,500 | $1.21 | 16d | 1 | 0.45mi |
| 3839 Harrison Blvd Kansas City, MO | 5.0 | 2.5 | 2709 | $2,950 | $1.09 | 43d | 1 | 0.57mi |
| 4112 Park Ave Kansas City, MO | 4.0 | 2.0 | 1700 | $1,800 | $1.06 | 14d | 1 | 0.59mi |
| 4511 Park Ave Kansas City, MO | 4.0 | 2.5 | 1915 | $1,982 | $1.03 | 23d | 1 | 0.65mi |
| 4138 Locust St Kansas City, MO | 4.0 | 2.0 | 1763 | $2,600 | $1.47 | 7d | 1 | 0.71mi |
| 404 E 41st St Kansas City, MO | 4.0 | 3.0 | 1711 | $2,650 | $1.55 | 19d | 1 | 0.76mi |
| 4018 Prospect Ave Kansas City, MO | 4.0 | 1.5 | 1900 | $1,695 | $0.89 | 43d | 1 | 0.80mi |
| 4119 S Benton Ave Kansas City, MO | 4.0 | 2.0 | 1700 | $1,800 | $1.06 | 43d | 1 | 0.97mi |
| 1330 Rockhurst Rd Kansas City, MO | 4.0 | 2.0 | 1984 | $2,500 | $1.26 | 43d | 1 | 1.12mi |
| 3434 Olive St Kansas City, MO | 3.0 | 2.0 | 2020 | $1,445 | $0.72 | 43d | 1 | 1.18mi |
| 3606 S Benton Ave Kansas City, MO | 5.0 | 3.0 | 2800 | $2,000 | $0.71 | 43d | 1 | 1.22mi |
| 5218 Highland Ave Kansas City, MO | 5.0 | 2.0 | 2300 | $1,995 | $0.87 | 7d | 1 | 1.23mi |
| 5017 Grand Ave Kansas City, MO | 4.0 | 4.5 | 2000 | $4,600 | $2.30 | 21d | 1 | 1.27mi |
| 551 W 44th St Kansas City, MO | 1.0–3.0 | 1.0–3.5 | 1293 | $4,866 | $3.76 | 1d | 12 | 1.35mi |
| 4653 Benton Blvd Kansas City, MO | 3.0 | 2.0 | 1594 | $1,600 | $1.00 | 7d | 1 | 1.42mi |
| 5346 Harrison St Kansas City, MO | 3.0 | 1.0 | 1580 | $1,695 | $1.07 | 19d | 1 | 1.42mi |
| 5346 Harrison St Kansas City, MO | 3.0 | 1.0 | 1580 | $1,695 | $1.07 | 16d | 1 | 1.42mi |
| 610 W 46th St Kansas City, MO | 3.0 | 1.0–3.5 | 1824 | $2,600 | $1.43 | 1d | 3 | 1.43mi |
| 5344 Brooklyn Ave Kansas City, MO | 3.0 | 1.0 | 2040 | $1,495 | $0.73 | 7d | 1 | 1.46mi |
| 4901 Wornall Rd Kansas City, MO | 1.0–3.0 | 1.0–3.0 | 1525 | $3,195 | $2.10 | 14d | 1 | 1.46mi |
Listing history 3 events
-
2026-06-18days on market $229,900 Active 2 DOM
-
2026-06-17remarks 699-char remark
-
2026-06-17$229,900 Active 1 DOM
ⓘ Source: listings_history table (triggers on properties + properties_extension) + one-shot
backfill from property_details.listing_events for pre-trigger history.
Tax reassessment forecast MO · Resets to sale price
- Current annual tax
- $3,128 · $261/mo
- Projected year-2 tax
- $3,128 · $261/mo
- Expected delta
- $0/yr ($0/mo · 0.0%)
ⓘ Screening estimate from a state-policy table — verify with the county assessor before closing.
Climate risk First Street
- Flood 1/10 Low FEMA zone X (unshaded) · 0% chance over 30 yrs
- Wildfire 1/10 Low
- Heat 4/10 Moderate 7 d/yr ≥106°F today · 17 d/yr by 30 yrs out
- Wind 2/10 Low
- Air quality 3/10 Moderate 2 unhealthy d/yr today · 4 by 30 yrs out
Nearby sold comps map
Loading sold comps map…
Walkable amenities ~0.75 mi
Loading nearby amenities…
Taxation est. · year 1
- Rental income
- $35,688
- − Mortgage interest
- −$12,878
- − Property taxes
- −$3,128
- − Insurance
- −$1,150
- − Repairs & maintenance
- −$2,855
- − Management
- −$2,855
- − Depreciation
- −$6,688
- Taxable income
- $6,135
- Est. tax owed @ 24.0%
- −$1,472
- After-tax cash flow
- $7,977/yr
For passive investors: Depreciation is non-cash, so a rental often shows a tax loss while cash-flowing — sheltering income. Rental losses are passive: they offset passive income freely, and up to $25,000/yr can offset ordinary (W-2) income if you actively participate and your MAGI is under $100k (phasing out to $0 by $150k); unused losses carry forward. On sale, claimed depreciation is recaptured at up to 25%, and gains may owe capital-gains tax (a 1031 exchange can defer both). Figures are a year-1 estimate at your 24.0% rate — not tax advice; consult a CPA.
Schools (NCES district)
- District
- Kansas City 33
- NCES district ID
- 2916400
- Math proficiency
- 12% ▼ -8.00%
- Reading proficiency
- 24% ▬ 0.00%
- Median HH income
- $35,227
- Composite
- 14.8/100
- National rank
- #9387
- State rank
- #308 of 324 in MO
Livability — Kansas City
- Score
- 78/100
- State rank
- #28
- US rank
- #2671
Category grades
Schools grade is shown separately in the Schools card above.
Census & demographics
- Census place
- Kansas City, MO
- County
- Jackson County · 687,798 people
- City population
- 439,467
- Metro
- Kansas City, MO-KS
- Population (ZIP)
- 16,878
- Household income
- $63,044
- Rent vs Own
- Severe rent burden
- 962.0
Population outlook (Jackson County) Hauer SSP2
- Today (2025)
- 719,589 people
- By 2030
- 731,456 · +1.6%
- By 2040
- 746,689 · +3.8%
- By 2050
- 749,289 · +4.1%
- By 2075
- 736,227 · +2.3%
- By 2100
- 668,210 · -7.1%
Race, ethnicity, and origin ACS 2023
- Neighborhood character
- Diverse neighborhood (Simpson 0.63)
- Race & ethnicity
- White 49% Black 34% Two or more races 10% Hispanic / Latino 9% Asian 2%
- Hispanic origin (detail)
- Mexican 6%
- Common ancestry
- Romanian 2% Lithuanian 2% Italian 2%
- Foreign-born
- 4% · Canada
- Languages at home
- 92% English-only · Spanish 6% French/Haitian/Cajun 1% Other Indo-European 1%
Political lean MEDSL · Jackson
- 2024 margin
- D (+19.3) · D 58.9% · R 39.5% · Other 1.6%
- 2008→2024 swing
- -6.1pp toward R · 2008: 25.4pp · 2024: 19.3pp
- All cycles
- 2024: D+19.3 2020: D+22.0 2016: D+16.6 2012: D+19.0 2008: D+25.4
Not yet ingested
- Civics
- —
Market trends
- HPI YoY
- ▼ -514.37%
- Current HPI
- 371.8501
- Rent YoY
- ▲ 3.95%
- Metro
- Kansas City, MO-KS
- State GDP YoY
- ▲ 1.84%
- F500 in state
- 20
Industry mix (Fortune 500 HQ in MO)
| Industry | F500 HQs | Revenue |
|---|---|---|
| Healthcare | 1 | $163B |
|
||
| Insurance | 1 | $21B |
|
||
| Industrial Technology | 1 | $17B |
|
||
| Retail | 1 | $16B |
|
||
| Industrial Distribution | 1 | $10B |
|
||
| Utilities | 1 | $9B |
|
||
Price history
+53.3% since first listed26 events — show timeline
- 2026-06-16 Listed $229,900 Heartland MLS as Distributed by MLS Grid
- 2021-12-21 Sold (Public Records) — Public Records
- 2021-12-17 Sold (MLS) — Heartland MLS as Distributed by MLS Grid
- 2021-11-15 Pending — Heartland MLS as Distributed by MLS Grid
- 2021-11-08 Price Changed $204,999 Heartland MLS as Distributed by MLS Grid
- 2021-10-26 Relisted — Heartland MLS as Distributed by MLS Grid
- 2021-10-04 Pending — Heartland MLS as Distributed by MLS Grid
- 2021-09-28 Price Changed $209,999 Heartland MLS as Distributed by MLS Grid
- 2021-09-28 Relisted — Heartland MLS as Distributed by MLS Grid
- 2021-09-09 Pending — Heartland MLS as Distributed by MLS Grid
- 2021-09-02 Relisted — Heartland MLS as Distributed by MLS Grid
- 2021-09-02 Price Changed $201,999 Heartland MLS as Distributed by MLS Grid
- 2021-07-07 Pending — Heartland MLS as Distributed by MLS Grid
- 2021-07-06 Listing Removed — Heartland MLS as Distributed by MLS Grid
- 2021-07-01 Listed $199,950 Heartland MLS as Distributed by MLS Grid
- 2019-09-05 Sold (MLS) — Heartland MLS as Distributed by MLS Grid
- 2019-05-27 Pending — Heartland MLS as Distributed by MLS Grid
- 2019-05-20 Price Changed $165,000 Heartland MLS as Distributed by MLS Grid
- 2019-04-01 Price Changed $175,000 Heartland MLS as Distributed by MLS Grid
- 2019-04-01 Relisted — Heartland MLS as Distributed by MLS Grid
- 2019-03-07 Listed $150,000 Heartland MLS as Distributed by MLS Grid
- 2019-03-07 Listing Removed — Heartland MLS as Distributed by MLS Grid
- 2017-11-28 Sold (Public Records) — Public Records
- 2017-11-28 Sold (Public Records) — Public Records
- 2005-04-05 Sold (Public Records) — Public Records
- 1986-12-09 Sold (Public Records) — Public Records
Property tax history
+18.9%/yrLatest (2025): $3,128 · +22.2% YoY. Source: county tax records.
Cash-flow waterfall
monthlySold comps — $/sqft
last 12 mo · ≤1 miLoading sold comps…