 Duplex
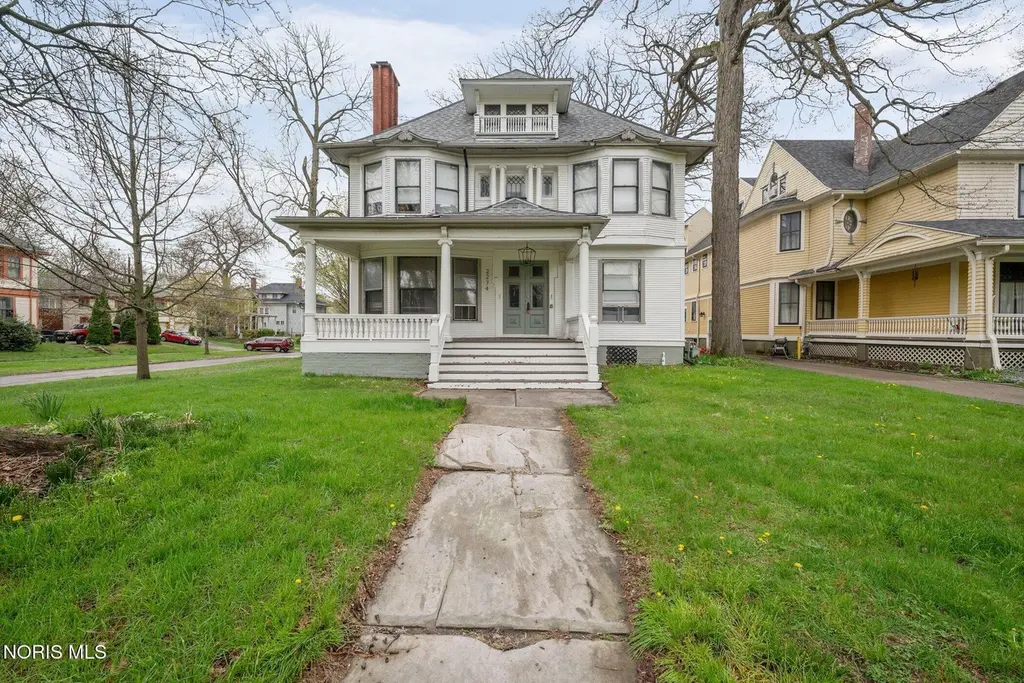
2274 Robinwood Ave · Toledo, OH
Flood risk 1/10 · Minimal
- FEMA flood zone
- X (unshaded)
- Chance of flooding over 30 yrs
- 0.0%
- Est. flood insurance / yr
- $507 – $1,088
Fire risk 1/10 · Minimal
- Est. fire insurance / yr
- $713 – $1,323
Heat risk 3/10 · Minor
- Hot days now (above 101°F)
- 7 days/yr
- Hot days in 30 yrs
- 16 days/yr
Wind risk 2/10 · Minimal
- Chance of severe wind over 30 yrs
- —
Air-quality risk 2/10 · Minimal
- Unhealthy air days now
- 1 days/yr
- Unhealthy air days in 30 yrs
- 3 days/yr
Risk factors via First Street. Map © Google.
Why this score? — see what drove the D grade
The composite is a weighted blend of 9 inputs, each scored 0–100. Each bar is that input's sub-score; the figure is the points it added to the 100-point composite (weight × sub-score).
- Cash flow +15.9/30.0
- ARV discount +7.5/15.0
- DSCR +4.9/10.0
- 1% rule +4.2/10.0
- Livability +3.3/5.0
- Rent growth +2.5/5.0
- Condition / age +2.5/5.0
- Schools +1.6/10.0
- Appreciation +0.0/10.0
$297,000
🖨 Deal sheet 📄 Offer letter ✓ Due diligence
Multi-family units
County records classify this as Multi-Family (5+ Unit). Listing-text estimate: 2 units. estimate disagrees with records
5+ unit building — per-unit beds/baths from public records are typically unavailable; the breakdown below (if shown) is an estimate from the listing text.
Listing remarks MLS
Investment opportunity in the heart of the Old West End. This beautiful historic building features hardwood floors, high ceilings, and original details throughout. Enjoy the charm of a covered front porch and strong income potential with four finished units plus an additional unit ready to be restored and rented. All bathrooms have been updated, and each unit includes new appliances.
Key facts
- Covered front porch
- Four finished units
- Historic building
Tags
Neighborhood map
What this means for you Summary
Snapshot
- This is a 2 × 3-bed/2.0-bath units multifamily listed at $297k.
Deal economics
- At list price, monthly cash flow is $140 ($2k/yr) — positive. Per door: $70/mo.
- The deal already cash-flows at list — no discount required.
- To meet the 1% rule (rent ≥ 1% of price), the offer needs to be $273k (8.1% below list).
- Recommended offer: $273k (8.1% below list) — sets the bar for 1% rule.
Location & tenants
- Location reads 66/100 on livability (#645 in OH) — a middle-class / working-renter tenant base. Strengths: cost of living A+, housing A+, health & safety A+; Watch: amenities C-, schools D-, crime F.
- Toledo City (urban): math 15% / reading 24% proficiency, ranked #634 of 656 in OH (top 97%) — low school quality limits family demand, transient renter base, plan for 1-2y turnover; 72% free/reduced lunch — lower-income household profile, screen leases tightly.
- Market conditions: 22 active listings in the ZIP; lower-income renter base — watch delinquency; 415 units permitted in Lucas County in 2024 (122 in 5+ unit buildings).
- At $2,728/mo this rent would consume 153% of the median local household income ($21k/yr) — very limited rent-growth headroom before tenants either downsize or default.
Forward outlook
- Local home prices are declining (-3.0%/yr); year-one equity from $2k of loan paydown is wiped out by about $9k of value loss. Plan a longer hold.
- Lucas County population projected at -16% by 2050 — secular population decline; favor cash flow + early exit over multi-decade hold.
Negotiation context
- It's been on market 28 days — a 2% lower offer ($293k) is reasonable based on typical stale-listing flexibility.
- 8 sale attempts since 16y ago; this cycle's ask has dropped $83k (22%) from the opening price — seller is motivated, your offer sets the floor, not the list.
- Current owner paid $165k; list at $297k implies a 80% gain — meaningful room to come down on a strong offer.
Risks & watch-outs
- Watch-outs: built in 1909 — expect roof / HVAC / electrical / plumbing capex.
Questions for the listing agent
- Can we see the unit-by-unit rent roll, current vacancy, and any below-market leases? What's the average tenancy length?
- What capital expenditures (roof, boiler, parking lot, exteriors) have been made in the last 5 years, and what's planned in the next 2?
- Built in 1909 — when were the roof, HVAC, electrical panel, plumbing, and water heater last replaced?
- Is there a deadline driving the sale (1031 exchange, divorce, estate, relocation)? That informs how much negotiation room exists.
- Schools are D-rated, which usually means shorter tenancies and higher turnover. Who's the typical renter profile here, and what's been the actual vacancy rate?
- Crime grade is F in this area — have there been break-ins, vandalism, or insurance claims at this property in the last 3 years? What carrier currently insures it and at what premium?
- The area grade is low — what's the realistic commute time and amenity access for the typical tenant pool here? Any planned neighborhood developments (good or bad) we should know about?
- What's the average days-on-market for RENTAL listings here right now (not sales)? A rising rental-DOM trend means longer vacancies and softer asking-rent achievability than the comps imply.
- What's the recent tenant-quality profile in this submarket — average credit score on applications, eviction rate, late-payment / NSF rate, and stable-employment percentage? A property-management company in the area should have these aggregated.
- How much new apartment / multifamily construction is in the pipeline within 1–3 miles? Heavy new supply (>2% of stock underway) typically softens rents 12–24 months out; light construction supports rent growth.
Investment metrics
- 1% rule
- 0.92% ✗
- Cap rate
- 6.86%
- Cash-on-cash
- 2.02%
- DSCR
- 1.09
- GRM
- 9.1
CMA / ARV
No comps found within radius.
Projected returns pro-forma
-3.0% appreciation · 3.0% rent growth · sell at horizon
- IRR
- -13.1%
- Equity multiple
- 0.53×
- Total profit
- $-39,176
- Equity at exit
- $44,284
- IRR
- -4.1%
- Equity multiple
- 0.73×
- Total profit
- $-22,539
- Equity at exit
- $25,679
Cash invested: $83,160 (down + closing). Projections, not guarantees.
Landlord ↔ Tenant lean methodology
- Overall (STATE)
- 73 Landlord-Friendly
- State Ohio
- 73 Landlord-Friendly · R+6
- County
- — inherits STATE
- City
- — inherits STATE
ZIP-level market 43620
- Home prices YoY
- -33.0%
- Active inventory
- 22
- Price-to-rent
- 18.1×
Monthly cashflow live
- Estimated rent
- $2,728 medium interval (Pro) →
- Mortgage (P&I)
- −$1,558
- Tax from tax record
- −$334 /mo · $4,003/yr
- Insurance
- −$124
- HOA
- −$0
- Vacancy / Maint / Mgmt
- −$573
- Net cashflow
- $140
Break-even live
2-unit breakdown (identical units grouped — click to expand)
| Units | Beds | Baths | Est. rent |
|---|---|---|---|
| 2× units | 3 | 2 | $2,728 |
| #1 | 3 | 2 | $1,364 |
| #2 | 3 | 2 | $1,364 |
| Total (2 units) | $2,728 | ||
UW: 25.0% down · 7.5% · 30yr · 1.5% tax · 5.0% vac · 8.0% maint · 8.0% mgmt
Financing live
Cash to close
- Down payment
- $74,250
- Closing costs
- $8,910
- Reserves months
- —
- Total cash needed
- —
Loan-product check · same deal, 3 products live
Conventional
25% down · 7.5% · 30yr
- Down + closing
- —
- Monthly P&I
- —
- Monthly cashflow
- —
- DSCR
- —
- Eligible?
- —
Personal DTI + credit; lowest rate.
DSCR
20% down · 8.5% · 30yr
- Down + closing
- —
- Monthly P&I
- —
- Monthly cashflow
- —
- DSCR
- —
- Eligible?
- —
No personal income docs; deal must DSCR.
Hard money
10% down · 12.0% · 12mo
- Down + closing
- —
- Monthly P&I
- —
- Monthly cashflow
- —
- DSCR
- —
- Eligible?
- —
Short-term bridge; refi at stabilization.
Listing history 36 events
-
2026-06-18days on market $297,000 Active 28 DOM
-
2026-06-17days on market $297,000 Active 27 DOM
-
2026-06-16remarks 491-char remark
-
2026-06-16pricedays on market $297,000 Active 26 DOM
-
2026-06-15days on market $315,000 Active 25 DOM
-
2026-06-14days on market $315,000 Active 23 DOM
-
2026-06-10days on market $315,000 Active 20 DOM
-
2026-06-09days on market $315,000 Active 19 DOM
-
2026-06-08days on market $315,000 Active 18 DOM
-
2026-06-07pricedays on market $315,000 Active 17 DOM
-
2026-06-05days on market $325,000 Active 14 DOM
-
2026-06-03days on market $325,000 Active 13 DOM
-
2026-06-02days on market $325,000 Active 12 DOM
-
2026-06-01days on market $325,000 Active 11 DOM
-
2026-05-31days on market $325,000 Active 10 DOM
-
2026-05-30days on market $325,000 Active 9 DOM
-
2026-04-29price $349,000 386-char remark
Show marketing remark (386 chars)
Investment opportunity in the heart of the Old West End. This beautiful historic building features hardwood floors, high ceilings, and original details throughout. Enjoy the charm of a covered front porch and strong income potential with four finished units plus an additional unit ready to be restored and rented. All bathrooms have been updated, and each unit includes new appliances.
-
2026-04-15$380,000 Active 386-char remark
Show marketing remark (386 chars)
Investment opportunity in the heart of the Old West End. This beautiful historic building features hardwood floors, high ceilings, and original details throughout. Enjoy the charm of a covered front porch and strong income potential with four finished units plus an additional unit ready to be restored and rented. All bathrooms have been updated, and each unit includes new appliances.
-
2025-10-13price $25,000 296-char remark
Show marketing remark (296 chars)
If this property is used for a comparable, Contact Listor. Right into the heart of the Old West end. 4 square Victorian is in good condition and has good rental history. Long term tenants. Possible 5th apt in 3rd floor attic with minor update. Updated utilities & mechanicals. Very nice units
-
2025-04-21historical $950
-
2025-03-21$950
-
2023-11-02historical $785
-
2023-10-27$785
-
2023-06-02soldstatus $165,000 Closed
-
2023-05-23status Pending
-
2023-04-05historical Contingent
-
2023-03-27$165,000 Active
-
2023-01-30soldstatus $143,500
-
2023-01-05$143,500
-
2019-09-04historical
-
2019-03-21$140,000
-
2015-08-11soldstatus $25,000 296-char remark
Show marketing remark (296 chars)
If this property is used for a comparable, Contact Listor. Right into the heart of the Old West end. 4 square Victorian is in good condition and has good rental history. Long term tenants. Possible 5th apt in 3rd floor attic with minor update. Updated utilities & mechanicals. Very nice units
-
2015-05-20$75,000 296-char remark
Show marketing remark (296 chars)
If this property is used for a comparable, Contact Listor. Right into the heart of the Old West end. 4 square Victorian is in good condition and has good rental history. Long term tenants. Possible 5th apt in 3rd floor attic with minor update. Updated utilities & mechanicals. Very nice units
-
2010-12-03historical
-
2010-06-01$139,900
-
1988-03-29soldstatus $65,000
ⓘ Source: listings_history table (triggers on properties + properties_extension) + one-shot
backfill from property_details.listing_events for pre-trigger history.
Tax reassessment forecast OH · Partial reset (capped growth)
- Current annual tax
- $4,003 · $334/mo
- Projected year-2 tax
- $4,318 · $360/mo
- Expected delta
- +$315/yr (+$26/mo · 7.9%)
ⓘ Screening estimate from a state-policy table — verify with the county assessor before closing.
Climate risk First Street
- Flood 1/10 Low FEMA zone X (unshaded) · 0% chance over 30 yrs
- Wildfire 1/10 Low
- Heat 3/10 Moderate 7 d/yr ≥101°F today · 16 d/yr by 30 yrs out
- Wind 2/10 Low
- Air quality 2/10 Low 1 unhealthy d/yr today · 3 by 30 yrs out
Nearby sold comps map
Loading sold comps map…
Walkable amenities ~0.75 mi
Loading nearby amenities…
Taxation est. · year 1
- Rental income
- $32,736
- − Mortgage interest
- −$16,637
- − Property taxes
- −$4,003
- − Insurance
- −$1,485
- − Repairs & maintenance
- −$2,619
- − Management
- −$2,619
- − Depreciation
- −$8,640
- Taxable loss
- −$3,267
- Est. tax savings @ 24.0%
- +$784
- After-tax cash flow
- $2,467/yr
For passive investors: Depreciation is non-cash, so a rental often shows a tax loss while cash-flowing — sheltering income. Rental losses are passive: they offset passive income freely, and up to $25,000/yr can offset ordinary (W-2) income if you actively participate and your MAGI is under $100k (phasing out to $0 by $150k); unused losses carry forward. On sale, claimed depreciation is recaptured at up to 25%, and gains may owe capital-gains tax (a 1031 exchange can defer both). Figures are a year-1 estimate at your 24.0% rate — not tax advice; consult a CPA.
Schools (NCES district)
- District
- Toledo City
- NCES district ID
- 3904490
- Math proficiency
- 15% ▼ -16.00%
- Reading proficiency
- 24% ▼ -13.00%
- Median HH income
- $32,137
- Composite
- 15.76/100
- National rank
- #9276
- State rank
- #634 of 656 in OH
Livability — Toledo
- Score
- 66/100
- State rank
- #645
- US rank
- #11442
Category grades
Schools grade is shown separately in the Schools card above.
Census & demographics
- Census place
- Toledo, OH
- County
- Lucas · 437,818 people
- City population
- 280,811
- Metro
- Toledo, OH
- Population (ZIP)
- 5,039
- Household income
- $21,405
- Rent vs Own
- Severe rent burden
- 2.1
Population outlook (Lucas County) Hauer SSP2
- Today (2025)
- 420,751 people
- By 2030
- 410,187 · -2.5%
- By 2040
- 384,019 · -8.7%
- By 2050
- 355,125 · -15.6%
- By 2075
- 291,683 · -30.7%
- By 2100
- 233,670 · -44.5%
Race, ethnicity, and origin ACS 2023
- Neighborhood character
- Diverse neighborhood (Simpson 0.60)
- Race & ethnicity
- Black 51% White 36% Hispanic / Latino 9% Two or more races 7%
- Hispanic origin (detail)
- Mexican 8% Puerto Rican 1%
- Common ancestry
- Romanian 4% Lithuanian 2% Italian 2%
- Foreign-born
- 2% · Canada
- Languages at home
- 98% English-only · Other Indo-European 1% Tagalog/Filipino 1%
Political lean MEDSL · Lucas
- 2024 margin
- D (+12.6) · D 55.8% · R 43.2%
- 2008→2024 swing
- -18.9pp toward R · 2008: 31.4pp · 2024: 12.6pp
- All cycles
- 2024: D+12.6 2020: D+16.8 2016: D+17.4 2012: D+30.4 2008: D+31.4
Not yet ingested
- Civics
- —
Market trends
- HPI YoY
- ▼ -63.87%
- Current HPI
- 129.7922
- Rent YoY
- —
- Metro
- —
- State GDP YoY
- ▲ 1.98%
- F500 in state
- 48
Industry mix (Fortune 500 HQ in OH)
| Industry | F500 HQs | Revenue |
|---|---|---|
| Insurance | 3 | $145B |
|
||
| Industrial Machinery | 3 | $49B |
|
||
| Financial Services | 3 | $24B |
|
||
| Consumer Goods | 2 | $93B |
|
||
| Aerospace / Defense | 2 | $47B |
|
||
| Utilities | 2 | $33B |
|
||
Price history
+436.9% since first listed20 events — show timeline
- 2026-04-29 Price Changed $349,000 NORIS
- 2026-04-15 Listed $380,000 NORIS
- 2025-10-13 Price Changed $25,000 NORIS
- 2025-04-21 Rental Removed $950 RENTALBEAST
- 2025-03-21 Listed for Rent $950 RENTALBEAST
- 2023-11-02 Rental Removed $785 APPFOLIO
- 2023-10-27 Listed for Rent $785 APPFOLIO
- 2023-06-02 Sold (MLS) $165,000 NORIS
- 2023-05-23 Pending — NORIS
- 2023-04-05 Contingent — NORIS
- 2023-03-27 Listed $165,000 NORIS
- 2023-01-30 Sold (Public Records) $143,500 Public Records
- 2023-01-05 Listed $143,500 NORIS
- 2019-09-04 Listing Removed — NORIS
- 2019-03-21 Listed $140,000 NORIS
- 2015-08-11 Sold (MLS) $25,000 NORIS
- 2015-05-20 Listed $75,000 NORIS
- 2010-12-03 Listing Removed — NORIS
- 2010-06-01 Listed $139,900 NORIS
- 1988-03-29 Sold (Public Records) $65,000 Public Records
Property tax history
+3.6%/yrLatest (2025): $4,003 · +2.3% YoY. Source: county tax records.
Cash-flow waterfall
monthlySold comps — $/sqft
last 12 mo · ≤1 miLoading sold comps…