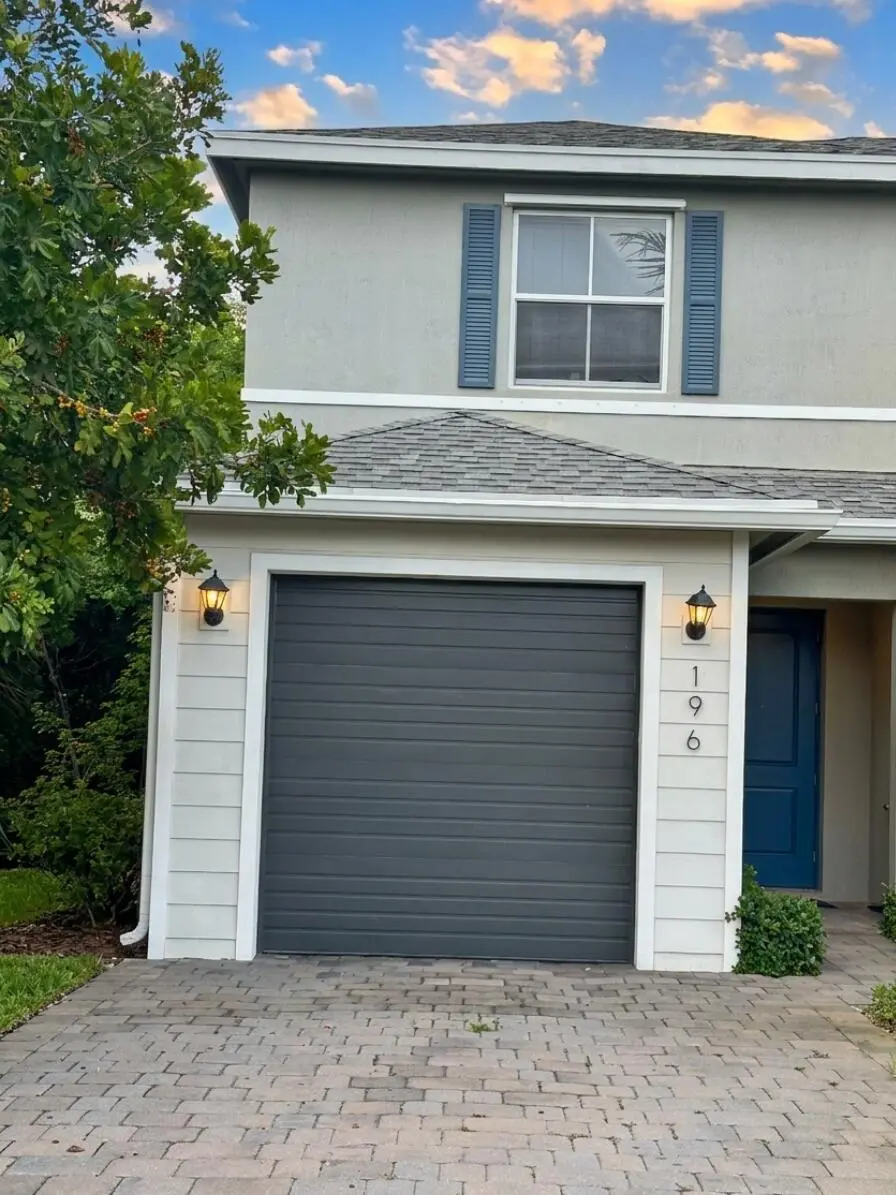
196 Bandol St · Riviera Beach, FL
Flood risk 4/10 · Minor
- FEMA flood zone
- X (unshaded)
- Chance of flooding over 30 yrs
- 0.22%
- Est. flood insurance / yr
- $507 – $1,088
Fire risk 1/10 · Minimal
- Est. fire insurance / yr
- $947 – $1,759
Heat risk 10/10 · Severe
- Hot days now (above 105°F)
- 7 days/yr
- Hot days in 30 yrs
- 23 days/yr
Wind risk 10/10 · Severe
- Chance of severe wind over 30 yrs
- 99.0%
Air-quality risk 2/10 · Minimal
- Unhealthy air days now
- 0 days/yr
- Unhealthy air days in 30 yrs
- 1 days/yr
Risk factors via First Street. Map © Google.
Why this score? — see what drove the C grade
The composite is a weighted blend of 9 inputs, each scored 0–100. Each bar is that input's sub-score; the figure is the points it added to the 100-point composite (weight × sub-score).
- Cash flow +21.9/30.0
- ARV discount +7.5/15.0
- DSCR +7.0/10.0
- 1% rule +6.3/10.0
- Schools +4.3/10.0
- Condition / age +3.8/5.0
- Livability +3.4/5.0
- Rent growth +2.3/5.0
- Appreciation +0.0/10.0
$345,000
🖨 Deal sheet 📄 Offer letter ✓ Due diligence
Listing remarks
Discover incredible value in the sought-after Riviera Cove community with this stylish 2020-built townhome priced to sell! Featuring 3 spacious bedrooms, 2.5 bathrooms, and a thoughtfully designed layout, this home offers the perfect blend of comfort, convenience, and modern charm. The bright open-concept living space is ideal for entertaining, while the contemporary kitchen showcases stainless steel appliances, generous cabinet space, and seamless flow into the dining and family areas. Step outside to your own private patio and backyard — perfect for weekend BBQs, morning coffee, or relaxing evenings at home. Upstairs, you'll find roomy bedrooms, full-size bathrooms, a convenient lau
Key facts
- Contemporary kitchen
- Laundry area
- Backyard
Tags
Property features AI
Finance
- Other: Directions available to property
- Financial info: Pets allowed (breed restrictions and possible pet restrictions)
- HOA & community: Monthly HOA fee of $125; HOA includes trash; Community amenities: Playground, sidewalks
Exterior
- Parking: Attached garage (1 space); Driveway; 1 covered space
- Utilities: Public water; Public sewer; Utilities: None
- Home design: Townhouse; Two levels; Faces south; Resale property; Single-story listed for parking/building info (stories total: 1)
- Construction: CBS construction; Composition roof; Building area reported as 1,680 (source: public records); Living area reported as 1,314
- Exterior features: Not waterfront
Interior
- Kitchen: Dishwasher; Disposal; Refrigerator
- Bedrooms: No main-level bedrooms
- Flooring: Carpet; Ceramic tile
- Bathrooms: 2 full bathrooms and 1 half bathroom (3 total)
- Heating & cooling: Central heating; Central air conditioning
- Interior features: Walk-in closets
- Laundry & utility: Electric water heater
Neighborhood map
What this means for you Summary
Snapshot
- This is a 3-bed/2.5-bath townhouse listed at $345k. Condition is rated good.
Deal economics
- At list price, monthly cash flow is $541 ($6k/yr) — positive.
- The deal already cash-flows at list — no discount required.
- Meets the 1% rule at list price ($4k rent vs $345k).
- Recommended offer: $340k (1.5% below list) — sets the bar for market timing.
Location & tenants
- Location reads 67/100 on livability (#581 in FL) — a middle-class / working-renter tenant base. Strengths: housing A+, health & safety A+, cost of living A-; Watch: employment D, crime F, amenities F.
- Palm Beach (suburban): math 46% / reading 53% proficiency, ranked #34 of 73 in FL (top 47%) — families likely to look elsewhere, expect single-tenant / working-renter base with shorter leases.
- Zoned schools: Lincoln Elementary School (math 31% / reading 29%, grade F, #1,882 of 2,144 statewide, top 88%, 358 students, 84% FRL); John F. Kennedy Middle School (math 28% / reading 29%, grade F, #482 of 571 statewide, top 85%, 826 students, 78% FRL); Palm Beach Gardens High School (math 19% / reading 40%, grade F, #447 of 667 statewide, top 68%, 2,570 students, 61% FRL) — zoned schools average 74% FRL vs 52% district-wide (22 pts higher); higher-poverty schools than district average — tighter screening recommended.
- Zoned-school proficiency averages 29% at this address vs 50% district-wide (-20 pts) — the specific schools serving this property underperform the Palm Beach average; the district grade overstates school quality for this exact location.
- Market conditions: Rents soft (-0.7%/yr); 506 active listings in the ZIP; 40 comparable units currently listed for rent nearby; rentals at typical pace (median 25d on market — plan ~3-4 weeks tenant-placement turnaround); 3,974 units permitted in Palm Beach County in 2024 (1,012 in 5+ unit buildings).
- At $3,883/mo this rent would consume 72% of the median local household income ($65k/yr) (locally 1838% of renters already pay >50% of income on rent) — very limited rent-growth headroom before tenants either downsize or default.
Forward outlook
- Local home prices are declining (-3.0%/yr); year-one equity from $2k of loan paydown is wiped out by about $10k of value loss. Plan a longer hold.
- Palm Beach County population projected at +30% by 2050 — long-run rental-demand tailwind backs the buy-and-hold thesis.
Negotiation context
- It's been on market 20 days — a 2% lower offer ($340k) is reasonable based on typical stale-listing flexibility.
Risks & watch-outs
- Climate carrying-cost: severe wind risk, 99% chance of damaging wind over 30y; extreme-heat days projected 7→23/yr by 2055 (HVAC capex compounding) — expect insurance premiums to compound above CPI over the hold.
Questions for the listing agent
- What does the HOA fee cover, when was the last increase, and are there any pending special assessments or reserve-fund shortfalls?
- Is there a deadline driving the sale (1031 exchange, divorce, estate, relocation)? That informs how much negotiation room exists.
- Crime grade is F in this area — have there been break-ins, vandalism, or insurance claims at this property in the last 3 years? What carrier currently insures it and at what premium?
- What's the average days-on-market for RENTAL listings here right now (not sales)? A rising rental-DOM trend means longer vacancies and softer asking-rent achievability than the comps imply.
- What's the recent tenant-quality profile in this submarket — average credit score on applications, eviction rate, late-payment / NSF rate, and stable-employment percentage? A property-management company in the area should have these aggregated.
- How much new for-sale + rental construction is in the pipeline within 1–3 miles? Heavy new supply typically softens prices + rents 12–24 months out; constrained supply supports both.
Investment metrics
- 1% rule
- 1.13% ✓
- Cap rate
- 8.17%
- Cash-on-cash
- 6.72%
- DSCR
- 1.30
- GRM
- 7.4
CMA / ARV
No comps found within radius.
Projected returns pro-forma
-3.0% appreciation · 0.0% rent growth · sell at horizon
- IRR
- -9.6%
- Equity multiple
- 0.66×
- Total profit
- $-32,693
- Equity at exit
- $51,441
- IRR
- -5.1%
- Equity multiple
- 0.72×
- Total profit
- $-27,495
- Equity at exit
- $29,829
Cash invested: $96,600 (down + closing). Projections, not guarantees.
Landlord ↔ Tenant lean methodology
- Overall (STATE)
- 87 Strongly Landlord-Friendly
- State Florida
- 87 Strongly Landlord-Friendly · R+3
- County
- — inherits STATE
- City
- — inherits STATE
ZIP-level market 33404
- Home prices YoY
- -31.1%
- Rents YoY
- -0.7%
- Active inventory
- 506
- Price-to-rent
- 7.4×
Monthly cashflow live
- Estimated rent
- $3,883 high interval (Pro) →
- Mortgage (P&I)
- −$1,809
- Tax from tax record
- −$448 /mo · $5,381/yr
- Insurance
- −$144
- HOA
- −$125
- Vacancy / Maint / Mgmt
- −$815
- Net cashflow
- $541
Break-even live
UW: 25.0% down · 7.5% · 30yr · 1.5% tax · 5.0% vac · 8.0% maint · 8.0% mgmt
Financing live
Cash to close
- Down payment
- $86,250
- Closing costs
- $10,350
- Reserves months
- —
- Total cash needed
- —
Loan-product check · same deal, 3 products live
Conventional
25% down · 7.5% · 30yr
- Down + closing
- —
- Monthly P&I
- —
- Monthly cashflow
- —
- DSCR
- —
- Eligible?
- —
Personal DTI + credit; lowest rate.
DSCR
20% down · 8.5% · 30yr
- Down + closing
- —
- Monthly P&I
- —
- Monthly cashflow
- —
- DSCR
- —
- Eligible?
- —
No personal income docs; deal must DSCR.
Hard money
10% down · 12.0% · 12mo
- Down + closing
- —
- Monthly P&I
- —
- Monthly cashflow
- —
- DSCR
- —
- Eligible?
- —
Short-term bridge; refi at stabilization.
Rent comps 40 comps
| Address | Beds | Baths | Sqft | Rent | $/sqft | DOM | Units | Dist |
|---|---|---|---|---|---|---|---|---|
| 111 W 35th St Riviera Beach, FL | 4.0 | 2.0 | 1600 | $3,000 | $1.88 | 12d | 1 | 0.09mi |
| 220 Lake Shore Dr Lake Park, FL | 1.0–3.0 | 1.5–3.5 | 1575 | $25,000 | $15.87 | 5d | 18 | 0.41mi |
| 520 W 28th St Riviera Beach, FL | 3.0 | 1.0 | 1296 | $6,000 | $4.63 | 3d | 1 | 0.42mi |
| 135 E 28th St Riviera Beach, FL | 4.0 | 2.0 | 1711 | $3,200 | $1.87 | 24d | 1 | 0.50mi |
| 301 Lake Shore Dr #802 West Palm Beach, FL | 2.0 | 2.0 | 1316 | $3,000 | $2.28 | 24d | 1 | 0.51mi |
| 410 Wilma Cir #103 Riviera Beach, FL | 2.0 | 2.0 | 1056 | $4,000 | $3.79 | 15d | 1 | 0.51mi |
| 901 W 37th St Riviera Beach, FL | 3.0 | 1.0 | 900 | $2,895 | $3.22 | 24d | 1 | 0.61mi |
| 360 Wilma Cir #7 Riviera Beach, FL | 3.0 | 2.0 | 1590 | $4,500 | $2.83 | 24d | 1 | 0.63mi |
| 158 E 23rd St Riviera Beach, FL | 2.0 | 2.0 | 1110 | $2,900 | $2.61 | 22d | 1 | 0.68mi |
| 158 E 23rd St Riviera Beach, FL | 2.0 | 2.0 | 1110 | $2,900 | $2.61 | 24d | 1 | 0.68mi |
| 2650 Lake Shore Dr #804 Riviera Beach, FL | 3.0 | 3.5 | 1704 | $4,500 | $2.64 | 24d | 1 | 0.70mi |
| 2650 Lake Shore Dr #1001 Riviera Beach, FL | 2.0 | 2.0 | 1742 | $3,800 | $2.18 | 24d | 1 | 0.70mi |
| 2650 Lake Shore Dr #803 Riviera Beach, FL | 3.0 | 3.0 | 1800 | $5,000 | $2.78 | 24d | 1 | 0.70mi |
| 2650 Lake Shore Dr #2303 Riviera Beach, FL | 3.0 | 3.0 | 1537 | $4,950 | $3.22 | 24d | 1 | 0.70mi |
| 2650 Lake Shore Dr #1003 Riviera Beach, FL | 3.0 | 3.0 | 1788 | $4,200 | $2.35 | 24d | 1 | 0.70mi |
| 2650 Lake Shore Dr #1203 Riviera Beach, FL | 3.0 | 3.0 | 1803 | $4,250 | $2.36 | 24d | 1 | 0.70mi |
| 2650 Lake Shore Dr #2403 Riviera Beach, FL | 3.0 | 3.0 | 1788 | $6,000 | $3.36 | 24d | 1 | 0.70mi |
| 2640 Lake Shore Dr #2312 Riviera Beach, FL | 2.0 | 2.0 | 1818 | $6,500 | $3.58 | 24d | 1 | 0.71mi |
| 2640 Lake Shore Dr #1716 Riviera Beach, FL | 3.0 | 3.0 | 1538 | $9,500 | $6.18 | 24d | 1 | 0.71mi |
| 2640 Lake Shore Dr #711 Riviera Beach, FL | 3.0 | 3.0 | 1848 | $5,500 | $2.98 | 24d | 1 | 0.71mi |
| 301 Hawthorne Dr West Palm Beach, FL | 3.0 | 2.0 | 1402 | $3,200 | $2.28 | 24d | 1 | 0.72mi |
| 2640 Lake Shore Dr Riviera Beach, FL | 3.0 | 3.0 | 1715 | $5,500 | $3.21 | 24d | 1 | 0.72mi |
| 815 Silver Beach Rd Lake Park, FL | 4.0 | 3.0 | 1480 | $3,000 | $2.03 | 24d | 1 | 0.72mi |
| 913 Lake Shore Dr Lake Park, FL | 1.0–2.0 | 1.0–2.0 | 1066 | $3,731 | $3.50 | 2d | 9 | 0.82mi |
| 855 Date Palm Dr West Palm Beach, FL | 3.0 | 3.0 | 1216 | $3,150 | $2.59 | 24d | 1 | 0.88mi |
| 1060 Lake Shore Dr #201 West Palm Beach, FL | 2.0 | 2.0 | 1206 | $3,850 | $3.19 | 19d | 1 | 0.95mi |
| 1030 Sugar Sands Blvd #171 Riviera Beach, FL | 2.0 | 2.0 | 1143 | $5,000 | $4.37 | 24d | 1 | 0.96mi |
| 65 W 16th St Apt 1 Riviera Beach, FL | 4.0 | 2.0 | 1232 | $3,500 | $2.84 | 17d | 1 | 0.97mi |
| 65 W 16th St Apt 1 Riviera Beach, FL | 4.0 | 2.0 | 1200 | $3,500 | $2.92 | 8d | 1 | 0.97mi |
| 1155 Lake Shore Dr #202 West Palm Beach, FL | 2.0 | 2.0 | 1206 | $4,750 | $3.94 | 24d | 1 | 1.01mi |
| 1050 Sugar Sands Blvd #174 Riviera Beach, FL | 3.0 | 2.0 | 1490 | $5,500 | $3.69 | 24d | 1 | 1.01mi |
| 1389 W 33rd St Riviera Beach, FL | 4.0 | 3.0 | 1737 | $3,000 | $1.73 | 24d | 1 | 1.13mi |
| 1120 Morse Blvd Riviera Beach, FL | 2.0 | 2.0 | 1765 | $10,000 | $5.67 | 24d | 1 | 1.14mi |
| 1140 Morse Blvd Riviera Beach, FL | 2.0 | 2.0 | 1640 | $7,000 | $4.27 | 20d | 1 | 1.17mi |
| 1400 W 28th St Unit 1 Riviera Beach, FL | 4.0 | 2.0 | 1100 | $3,200 | $2.91 | 24d | 1 | 1.19mi |
| 220 Lake Dr #206 Palm Beach Shores, FL | 2.0 | 2.0 | 1241 | $4,000 | $3.22 | 13d | 1 | 1.28mi |
| 1221 Singer Dr Riviera Beach, FL | 3.0 | 2.5 | 1676 | $11,000 | $6.56 | 19d | 1 | 1.30mi |
| 1216 Surf Rd Riviera Beach, FL | 3.0 | 2.5 | 1444 | $3,900 | $2.70 | 24d | 1 | 1.32mi |
| 1260 Manor Dr Riviera Beach, FL | 2.0 | 2.0 | 1230 | $4,500 | $3.66 | 21d | 1 | 1.36mi |
| 308 Southwind Ct Unit 8 North Palm Beach, FL | 2.0 | 2.0 | 1100 | $2,900 | $2.64 | 24d | 1 | 1.36mi |
HOA detail
- Monthly dues
- $125 · $1,500/yr
Listing history 7 events
-
2026-06-07days on market $345,000 Active 20 DOM
-
2026-06-04days on market $345,000 Active 17 DOM
-
2026-06-03days on market $345,000 Active 16 DOM
-
2026-06-02days on market $345,000 Active 15 DOM
-
2026-06-01days on market $345,000 Active 14 DOM
-
2026-05-31days on market $345,000 Active 13 DOM
-
2026-05-18$345,000 Active
ⓘ Source: listings_history table (triggers on properties + properties_extension) + one-shot
backfill from property_details.listing_events for pre-trigger history.
Tax reassessment forecast FL · Resets to sale price
- Current annual tax
- $5,381 · $448/mo
- Projected year-2 tax
- $5,381 · $448/mo
- Expected delta
- $0/yr ($0/mo · 0.0%)
ⓘ Screening estimate from a state-policy table — verify with the county assessor before closing.
Climate risk First Street
- Flood 4/10 Moderate FEMA zone X (unshaded) · 22% chance over 30 yrs
- Wildfire 1/10 Low
- Heat 10/10 Extreme 7 d/yr ≥105°F today · 23 d/yr by 30 yrs out
- Wind 10/10 Extreme 99% chance of damaging wind over 30 yrs
- Air quality 2/10 Low 0 unhealthy d/yr today · 1 by 30 yrs out
Nearby sold comps map
Loading sold comps map…
Walkable amenities ~0.75 mi
Loading nearby amenities…
Taxation est. · year 1
- Rental income
- $46,590
- − Mortgage interest
- −$19,325
- − Property taxes
- −$5,381
- − Insurance
- −$1,725
- − Repairs & maintenance
- −$3,727
- − Management
- −$3,727
- − HOA
- −$1,500
- − Depreciation
- −$10,036
- Taxable income
- $1,168
- Est. tax owed @ 24.0%
- −$280
- After-tax cash flow
- $6,209/yr
For passive investors: Depreciation is non-cash, so a rental often shows a tax loss while cash-flowing — sheltering income. Rental losses are passive: they offset passive income freely, and up to $25,000/yr can offset ordinary (W-2) income if you actively participate and your MAGI is under $100k (phasing out to $0 by $150k); unused losses carry forward. On sale, claimed depreciation is recaptured at up to 25%, and gains may owe capital-gains tax (a 1031 exchange can defer both). Figures are a year-1 estimate at your 24.0% rate — not tax advice; consult a CPA.
Condition & rehab AI · 1 photo
This 2020-built townhome in Riviera Cove is in good condition with minimal repairs needed. A fresh coat of paint and some minor maintenance would significantly enhance its curb appeal and value.
Value-add opportunities
- Both Paint exterior — Enhances curb appeal and value
- Both Replace any damaged shingles — Improves safety and appearance
- Both Deep clean interior — Enhances cleanliness and appeal
Renovation cost estimate screening
Value-add ROI direction
- Both Paint exterior — Enhances curb appeal and value ↑
- Both Replace any damaged shingles — Improves safety and appearance ↑
- Both Deep clean interior — Enhances cleanliness and appeal ↑
ⓘ Cost ranges are severity-bucket heuristics (US national rule-of-thumb). Get contractor quotes + a written scope before underwriting a rehab budget.
Schools (NCES district)
- District
- Palm Beach
- NCES district ID
- 1201500
- Math proficiency
- 46% ▼ -16.00%
- Reading proficiency
- 53% ▼ -4.00%
- Median HH income
- $53,943
- Composite
- 42.72/100
- National rank
- #3160
- State rank
- #34 of 73 in FL
Livability — Riviera Beach
- Score
- 67/100
- State rank
- #581
- US rank
- #11060
Category grades
Schools grade is shown separately in the Schools card above.
Census & demographics
- Census place
- Riviera Beach, FL
- County
- Palm Beach County · 1,438,312 people
- City population
- 30,912
- Metro
- Miami-Fort Lauderdale-Pompano Beach, FL
- Population (ZIP)
- 30,912
- Household income
- $65,063
- Rent vs Own
- Severe rent burden
- 1838.0
Population outlook (Palm Beach County) Hauer SSP2
- Today (2025)
- 1,637,487 people
- By 2030
- 1,743,255 · +6.5%
- By 2040
- 1,948,712 · +19.0%
- By 2050
- 2,132,979 · +30.3%
- By 2075
- 2,530,027 · +54.5%
- By 2100
- 2,706,979 · +65.3%
Race, ethnicity, and origin ACS 2023
- Neighborhood character
- Majority Black (64%)
- Race & ethnicity
- Black 64% White 22% Hispanic / Latino 9% Two or more races 8%
- Hispanic origin (detail)
- Mexican 1% Puerto Rican 1%
- Common ancestry
- Hispanic 8% Romanian 1% Italian 1%
- Foreign-born
- 21% · Canada, Jamaica
- Languages at home
- 82% English-only · Spanish 8% French/Haitian/Cajun 7% Other Indo-European 1%
Political lean MEDSL · Palm Beach
- 2024 margin
- Toss-up / Even · D 50.0% · R 49.2%
- 2008→2024 swing
- -22.1pp toward R · 2008: 22.9pp · 2024: 0.8pp
- All cycles
- 2024: D+0.8 2020: D+12.8 2016: D+15.3 2012: D+17.0 2008: D+22.9
Not yet ingested
- Civics
- —
Market trends
- HPI YoY
- ▼ -153.74%
- Current HPI
- 341.1761
- Rent YoY
- ▼ -0.72%
- Metro
- Miami-Fort Lauderdale-Pompano Beach, FL
- State GDP YoY
- ▲ 3.28%
- F500 in state
- 36
Industry mix (Fortune 500 HQ in FL)
| Industry | F500 HQs | Revenue |
|---|---|---|
| Industrial Technology | 2 | $29B |
|
||
| Insurance | 2 | $17B |
|
||
| Retail | 1 | $60B |
|
||
| Technology Distribution | 1 | $58B |
|
||
| Homebuilding | 1 | $35B |
|
||
| Technology Manufacturing | 1 | $35B |
|
||
Price history
1 event — show timeline
- 2026-05-18 Listed $345,000 Beaches MLS
Property tax history
+70.5%/yrLatest (2025): $5,381 · +3.3% YoY. Source: county tax records.
Cash-flow waterfall
monthlySold comps — $/sqft
last 12 mo · ≤1 miLoading sold comps…