1095 W Acorn Ln · Midway, UT
Flood risk 9/10 · Severe
- FEMA flood zone
- X (unshaded)
- Chance of flooding over 30 yrs
- 0.99%
- Est. flood insurance / yr
- $507 – $1,088
Fire risk 6/10 · Moderate
- Est. fire insurance / yr
- $453 – $841
Heat risk 2/10 · Minimal
- Hot days now (above 90°F)
- 7 days/yr
- Hot days in 30 yrs
- 20 days/yr
Wind risk 1/10 · Minimal
- Chance of severe wind over 30 yrs
- —
Air-quality risk 3/10 · Minor
- Unhealthy air days now
- 2 days/yr
- Unhealthy air days in 30 yrs
- 3 days/yr
Risk factors via First Street. Map © Google.
Why this score? — see what drove the D grade
The composite is a weighted blend of 9 inputs, each scored 0–100. Each bar is that input's sub-score; the figure is the points it added to the 100-point composite (weight × sub-score).
- Cash flow +14.7/30.0
- ARV discount +7.5/15.0
- DSCR +4.5/10.0
- Schools +4.3/10.0
- 1% rule +3.9/10.0
- Livability +3.4/5.0
- Rent growth +2.5/5.0
- Condition / age +2.5/5.0
- Appreciation +0.0/10.0
$483,500
🖨 Deal sheet (PDF) 📄 Offer letter ✓ Due diligence
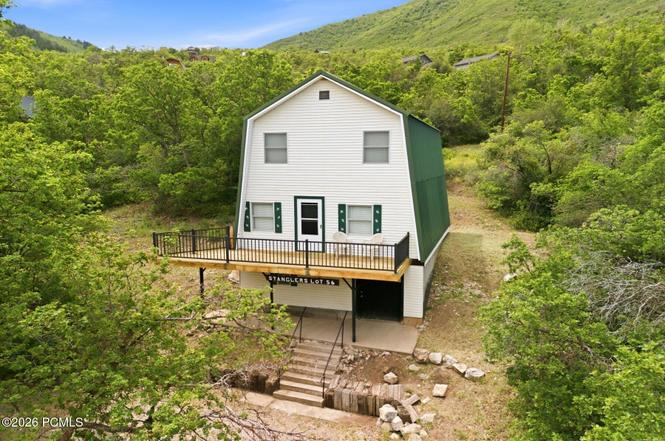
Listing remarks
Amazing views from the main living area deck and a private . 58-acre lot make 56 Acorn a standout furnished retreat. This 4-bedroom, 1.5-bath home offers 1,280 sq. ft. with a surprisingly inviting interior. The open main living area includes an expandable custom-built dining table and access to the recently improved deck, creating comfortable indoor-outdoor living. The layout features a main-level bedroom and full bath, plus three spacious upper-level bedrooms and a half bath. Entry is through the basement, where a large, efficient wood stove serves as the home's heat source. Recent updates include replaced deck wood and a newer electric 50-gallon water heater.
Key facts
- Private lot
- Efficient wood stove
- 2 parking spots
Tags
Property features AI
Finance
- Other: Approximate lot size: 0.58 acres; Approximate finished area reported (public records); Road surface may require 4WD; gravel and dirt roads
- HOA & community: Annual HOA dues of $500; Association fees include: see remarks; Pets allowed with restrictions
Exterior
- Parking: Two off-street unassigned parking spaces
- Utilities: Private water; Septic tank; Electricity connected; Phone available
- Home design: Frame wood construction; Vinyl siding; Metal roof; Private road frontage; Property faces a private/seasonal-access setting
- Construction: Concrete perimeter foundation; Frame (wood) construction; Metal roof; Vinyl siding
- Exterior features: Deck(s); Gradual slope and natural vegetation; Access is seasonal
Interior
- Kitchen: Microwave; Refrigerator; Electric range
- Bedrooms: One main-level master bedroom; Three additional bedrooms on the upper level
- Flooring: Vinyl flooring; Carpet
- Bathrooms: One three-quarter bathroom on the main level; One half bathroom on the upper level
- Heating & cooling: Other heating (see remarks)
- Interior features: Main-level primary bedroom; Interior storage; Fully furnished; Ceiling fans; Walk-out basement access; Wood-burning stove
- Laundry & utility: Electric water heater; Appliances included
Neighborhood map
What this means for you Summary
Snapshot
- This is a 4-bed/1.5-bath single-family listed at $484k.
Deal economics
- At list price, monthly cash flow is $59 ($707/yr) — positive.
- The deal already cash-flows at list — no discount required.
- To meet the 1% rule (rent ≥ 1% of price), the offer needs to be $430k (11.2% below list).
- Recommended offer: $430k (11.2% below list) — sets the bar for 1% rule.
- Cap rate 6.6% vs local median 2.4% in Midway — top-decile yield for the area; either an underpriced asset or a hidden risk that comps aren't pricing in. Stress-test before assuming the spread holds.
Location & tenants
- Location reads 67/100 on livability (#124 in UT) — a middle-class / working-renter tenant base. Strengths: crime A+, employment A+, housing A; Watch: amenities F, commute F, cost of living F.
- Wasatch District (town): math 45% / reading 51% proficiency, ranked #23 of 80 in UT (top 29%) — families likely to look elsewhere, expect single-tenant / working-renter base with shorter leases.
- Zoned schools: Wasatch High (math 34% / reading 50%, grade F, #55 of 171 statewide, top 32%, 2,531 students, 16% FRL).
- Market conditions: 228 active listings in the ZIP; 1 comparable units currently listed for rent nearby; high-income renter base; 835 units permitted in Wasatch County in 2024 (22 in 5+ unit buildings).
- This rent runs 34% of the median local income ($151k/yr) — at the standard rent-burdened threshold; future hikes will face affordability resistance.
Forward outlook
- Local home prices are declining (-3.0%/yr); year-one equity from $3k of loan paydown is wiped out by about $15k of value loss. Plan a longer hold.
- Wasatch County population projected at +87% by 2050 — long-run rental-demand tailwind backs the buy-and-hold thesis.
Negotiation context
- Only 3 days on market — expect competitive offers; lowballing is unlikely to land.
Risks & watch-outs
- Watch-outs: flood insurance adds $66/mo.
- Climate carrying-cost: severe flood risk; major wildfire risk — expect insurance premiums to compound above CPI over the hold.
Questions for the listing agent
- What's the actual annual flood-insurance premium (NFIP or private), and is the property in a SFHA with mandatory coverage?
- What does the HOA fee cover, when was the last increase, and are there any pending special assessments or reserve-fund shortfalls?
- Is there a deadline driving the sale (1031 exchange, divorce, estate, relocation)? That informs how much negotiation room exists.
- Schools are A-rated — typically a magnet for longer-tenancy family renters. What's the average tenant stay here, and is there a school-zone premium baked into asking?
- The area grade is low — what's the realistic commute time and amenity access for the typical tenant pool here? Any planned neighborhood developments (good or bad) we should know about?
- What's the average days-on-market for RENTAL listings here right now (not sales)? A rising rental-DOM trend means longer vacancies and softer asking-rent achievability than the comps imply.
- What's the recent tenant-quality profile in this submarket — average credit score on applications, eviction rate, late-payment / NSF rate, and stable-employment percentage? A property-management company in the area should have these aggregated.
- How much new for-sale + rental construction is in the pipeline within 1–3 miles? Heavy new supply typically softens prices + rents 12–24 months out; constrained supply supports both.
Investment metrics
- 1% rule
- 0.89% ✗
- Cap rate
- 6.60%
- Cash-on-cash
- 1.11%
- DSCR
- 1.05
- GRM
- 9.4
CMA / ARV
No comps found within radius.
Projected returns pro-forma
-3.0% appreciation · 3.0% rent growth · sell at horizon
- IRR
- -15.5%
- Equity multiple
- 0.45×
- Total profit
- $-74,534
- Equity at exit
- $72,091
- IRR
- -6.9%
- Equity multiple
- 0.56×
- Total profit
- $-59,823
- Equity at exit
- $41,804
Cash invested: $135,380 (down + closing). Projections, not guarantees.
Landlord ↔ Tenant lean methodology
- Overall (STATE)
- 86 Strongly Landlord-Friendly
- State Utah
- 86 Strongly Landlord-Friendly · R+15
- County
- — inherits STATE
- City
- — inherits STATE
ZIP-level market 84049
- Home prices YoY
- -32.9%
- Active inventory
- 228
- Price-to-rent
- 9.4×
Monthly cashflow live
- Estimated rent
- $4,296 medium interval (Pro) →
- Mortgage (P&I)
- −$2,536
- Tax from tax record
- −$489 /mo · $5,869/yr
- Insurance
- −$201
- Flood insurance flood zone
- −$66 /mo · $798/yr
- HOA
- −$42
- Vacancy / Maint / Mgmt
- −$902
- Net cashflow
- $59
Break-even live
Sensitivity live
| Price | -10% $333 | -5% $196 | +0% $59 | +5% $-78 | +10% $-215 |
|---|---|---|---|---|---|
| Rent | -10% $-280 | -5% $-111 | +0% $59 | +5% $229 | +10% $398 |
| Rate | -1.0pp $302 | -0.5pp $182 | base $59 | +0.5pp $-66 | +1.0pp $-194 |
UW: 25.0% down · 7.5% · 30yr · 1.5% tax · 5.0% vac · 8.0% maint · 8.0% mgmt
Financing live
Cash to close
- Down payment
- $120,875
- Closing costs
- $14,505
- Reserves months
- —
- Total cash needed
- —
Loan-product check · same deal, 3 products live
Conventional
25% down · 7.5% · 30yr
- Down + closing
- —
- Monthly P&I
- —
- Monthly cashflow
- —
- DSCR
- —
- Eligible?
- —
Personal DTI + credit; lowest rate.
DSCR
20% down · 8.5% · 30yr
- Down + closing
- —
- Monthly P&I
- —
- Monthly cashflow
- —
- DSCR
- —
- Eligible?
- —
No personal income docs; deal must DSCR.
Hard money
10% down · 12.0% · 12mo
- Down + closing
- —
- Monthly P&I
- —
- Monthly cashflow
- —
- DSCR
- —
- Eligible?
- —
Short-term bridge; refi at stabilization.
Rent comps 1 comps
| Address | Beds | Baths | Sqft | Rent | $/sqft | DOM | Units | Dist |
|---|---|---|---|---|---|---|---|---|
| 325 W Burgi Ln Midway, UT | 3.0 | 2.0 | 1665 | $3,850 | $2.31 | 4d | 1 | 1.39mi |
HOA detail
- Monthly dues
- $42 · $504/yr
- Likely covers
- waterelectric
Listing history 3 events
-
2026-06-22days on market $483,500 Active 3 DOM
-
2026-06-19remarks 669-char remark
-
2026-06-19$483,500 Active 1 DOM
ⓘ Source: listings_history table (triggers on properties + properties_extension) + one-shot
backfill from property_details.listing_events for pre-trigger history.
Tax reassessment forecast UT · Resets to sale price
- Current annual tax
- $5,869 · $489/mo
- Projected year-2 tax
- $5,869 · $489/mo
- Expected delta
- $0/yr ($0/mo · 0.0%)
ⓘ Screening estimate from a state-policy table — verify with the county assessor before closing.
Climate risk First Street
- Flood 9/10 Extreme FEMA zone X (unshaded) · 99% chance over 30 yrs
- Wildfire 6/10 Major
- Heat 2/10 Low 7 d/yr ≥90°F today · 20 d/yr by 30 yrs out
- Wind 1/10 Low
- Air quality 3/10 Moderate 2 unhealthy d/yr today · 3 by 30 yrs out
Nearby sold comps map
Loading sold comps map…
Walkable amenities ~0.75 mi
Loading nearby amenities…
Taxation est. · year 1
- Rental income
- $51,547
- − Mortgage interest
- −$27,084
- − Property taxes
- −$5,869
- − Insurance
- −$3,215
- − Repairs & maintenance
- −$4,124
- − Management
- −$4,124
- − HOA
- −$504
- − Depreciation
- −$14,065
- Taxable loss
- −$7,438
- Est. tax savings @ 24.0%
- +$1,785
- After-tax cash flow
- $2,492/yr
For passive investors: Depreciation is non-cash, so a rental often shows a tax loss while cash-flowing — sheltering income. Rental losses are passive: they offset passive income freely, and up to $25,000/yr can offset ordinary (W-2) income if you actively participate and your MAGI is under $100k (phasing out to $0 by $150k); unused losses carry forward. On sale, claimed depreciation is recaptured at up to 25%, and gains may owe capital-gains tax (a 1031 exchange can defer both). Figures are a year-1 estimate at your 24.0% rate — not tax advice; consult a CPA.
Schools (NCES district)
- District
- Wasatch District
- NCES district ID
- 4901110
- Math proficiency
- 45% ▼ -2.00%
- Reading proficiency
- 51% ▼ -1.00%
- Median HH income
- $67,315
- Composite
- 42.77/100
- National rank
- #3154
- State rank
- #23 of 80 in UT
Livability — Midway
- Score
- 67/100
- State rank
- #124
- US rank
- #10123
Category grades
Schools grade is shown separately in the Schools card above.
Census & demographics
- County
- Wasatch County · 42,185 people
- City population
- 6,833
- Metro
- Heber, UT
- Population (ZIP)
- 6,833
- Household income
- $151,343
- Rent vs Own
- Severe rent burden
- 11.0
Population outlook (Wasatch County) Hauer SSP2
- Today (2025)
- 42,214 people
- By 2030
- 49,113 · +16.3%
- By 2040
- 63,675 · +50.8%
- By 2050
- 78,879 · +86.9%
- By 2075
- 116,912 · +177.0%
- By 2100
- 147,290 · +248.9%
Race, ethnicity, and origin ACS 2023
- Neighborhood character
- Predominantly White (97%)
- Race & ethnicity
- White 97% Two or more races 2% Hispanic / Latino 1%
- Common ancestry
- Italian 7% Slovak 4% Iranian 3%
- Foreign-born
- 3% · Canada
- Languages at home
- 92% English-only · Spanish 5% German/W. Germanic 1% Other Indo-European 1%
Political lean MEDSL · Wasatch
- 2024 margin
- Strong R (+27.4) · D 35.2% · R 62.6% · Other 2.2%
- 2008→2024 swing
- +2.3pp toward D · 2008: -29.8pp · 2024: -27.4pp
- All cycles
- 2024: R+27.4 2020: R+26.2 2016: R+25.2 2012: R+52.2 2008: R+29.8
Not yet ingested
- Civics
- —
Market trends
- HPI YoY
- ▼ -154.44%
- Current HPI
- 314.7511
- Rent YoY
- —
- Metro
- Heber, UT
- State GDP YoY
- ▲ 3.54%
- F500 in state
- 2
Industry mix (Fortune 500 HQ in UT)
| Industry | F500 HQs | Revenue |
|---|---|---|
| Financial Services | 1 | $3B |
|
||
Price history
1 event — show timeline
- 2026-06-18 Listed $483,500 PCMLS
Property tax history
+8.7%/yrLatest (2025): $5,869 · +0.8% YoY. Source: county tax records.
Cash-flow waterfall
monthlySold comps — $/sqft
last 12 mo · ≤1 miLoading sold comps…