49397 E County Road 1604 · Stratford, OK
Flood risk 1/10 · Minimal
- FEMA flood zone
- X (unshaded)
- Chance of flooding over 30 yrs
- 0.0%
- Est. flood insurance / yr
- $507 – $1,088
Fire risk 7/10 · Major
- Est. fire insurance / yr
- $2,463 – $4,575
Heat risk 5/10 · Moderate
- Hot days now (above 108°F)
- 7 days/yr
- Hot days in 30 yrs
- 18 days/yr
Wind risk 4/10 · Minor
- Chance of severe wind over 30 yrs
- 9.0%
Air-quality risk 2/10 · Minimal
- Unhealthy air days now
- 1 days/yr
- Unhealthy air days in 30 yrs
- 1 days/yr
Risk factors via First Street. Map © Google.
Why this score? — see what drove the D+ grade
The composite is a weighted blend of 9 inputs, each scored 0–100. Each bar is that input's sub-score; the figure is the points it added to the 100-point composite (weight × sub-score).
- Cash flow +16.3/30.0
- Appreciation +7.8/10.0
- ARV discount +7.5/15.0
- DSCR +5.0/10.0
- 1% rule +4.4/10.0
- Livability +3.1/5.0
- Rent growth +2.5/5.0
- Schools +2.0/10.0
- Condition / age +1.0/5.0
$89,900
🖨 Deal sheet 📄 Offer letter ✓ Due diligence
Listing remarks
Opportunity awaits on this 10-acre property featuring a 2-bed, 1-bath home ready for renovation or replacement—ideal for investors or anyone looking to build value from the ground up. The acreage is the true highlight, offering open space, mature trees, and shared ownership of a scenic pond. Property improvements include a full RV hookup, two carports, two storage buildings, and a convenient circle driveway for easy access. With utilities already in place and multiple structures on site, this is a strong foundation for your next project. Located just 13 miles from Chickasaw National Recreation Area (formerly Platt National Park), this setting offers peaceful country living with quick
Key facts
- 10 acre lot
- Built 1983
- Listed 63 days
Property features AI
Finance
- Other: Homestead exempt; Property is existing (not new construction); Occupied
- HOA & community: No mandatory association dues
Exterior
- Home design: Single-family manufactured/mobile home; One-level property; Composition roof
- Construction: Slab foundation
- Exterior features: Covered porch; Open patio; Interior lot
Interior
- Bedrooms: 2 bedrooms
- Bathrooms: 1 full bathroom
- Heating & cooling: Window unit(s) for cooling
- Interior features: One living area; No fireplace
Neighborhood map
What this means for you Summary
Snapshot
- This is a 2-bed/1.0-bath single-family listed at $90k. Condition is rated poor.
Deal economics
- At list price, monthly cash flow is $49 ($584/yr) — positive.
- The deal already cash-flows at list — no discount required.
- To meet the 1% rule (rent ≥ 1% of price), the offer needs to be $85k (5.7% below list).
- Recommended offer: $85k (6.0% below list) — sets the bar for market timing.
Location & tenants
- Location reads 61/100 on livability (#291 in OK) — a middle-class / working-renter tenant base. Strengths: cost of living A+, housing A+; Watch: amenities F, commute F, employment F.
- Stratford (rural): math 27% / reading 22% proficiency, ranked #130 of 270 in OK (top 48%) — low school quality limits family demand, transient renter base, plan for 1-2y turnover.
- Zoned schools: Stratford Es (math 22% / reading 17%, grade F, #479 of 845 statewide, top 63%, 307 students, 0% FRL); Stratford Hs (math 34% / reading 44%, grade F, #37 of 447 statewide, top 9%, 186 students, 0% FRL) — zoned schools average 0% FRL vs 54% district-wide (54 pts lower); this property's tenant base skews higher-income than the district average.
- Market conditions: 41 active listings in the ZIP; 1 units permitted in Garvin County in 2024 (0 in 5+ unit buildings).
Forward outlook
- In year one you build about $6k of equity ($622 loan paydown + $5k appreciation (5.5% local appreciation)).
- Garvin County population projected at +8% by 2050 — modest demand growth; plan on rents tracking national, not racing it.
- At projected returns (5.5% appreciation + 3.0% rent growth), your $25k cash investment doubles in ~4 years — after that, you're playing with house money.
- By year 6, paydown + projected appreciation supports a ~$30k cash-out refi (75% LTV) — recoverable capital for the next deal without selling this one.
Negotiation context
- It's been on market 64 days — a 6% lower offer ($85k) is reasonable based on typical stale-listing flexibility.
Risks & watch-outs
- Climate carrying-cost: major wildfire risk; extreme-heat days projected 7→18/yr by 2055 (HVAC capex compounding) — expect insurance premiums to compound above CPI over the hold.
Questions for the listing agent
- It's been on market 64 days. Have you received any prior offers? Is the seller open to a 6% concession, seller financing, or rate buy-down credit?
- Have any recent inspections been done? Can we get a copy of the seller's disclosures and any deferred-maintenance estimates?
- Why hasn't it sold? Are there any deal-killer items the seller is aware of (foundation, flood, title, zoning, code violations)?
- Is there a deadline driving the sale (1031 exchange, divorce, estate, relocation)? That informs how much negotiation room exists.
- Schools are D-rated, which usually means shorter tenancies and higher turnover. Who's the typical renter profile here, and what's been the actual vacancy rate?
- The area grade is low — what's the realistic commute time and amenity access for the typical tenant pool here? Any planned neighborhood developments (good or bad) we should know about?
- What's the average days-on-market for RENTAL listings here right now (not sales)? A rising rental-DOM trend means longer vacancies and softer asking-rent achievability than the comps imply.
- What's the recent tenant-quality profile in this submarket — average credit score on applications, eviction rate, late-payment / NSF rate, and stable-employment percentage? A property-management company in the area should have these aggregated.
- How much new for-sale + rental construction is in the pipeline within 1–3 miles? Heavy new supply typically softens prices + rents 12–24 months out; constrained supply supports both.
Investment metrics
- 1% rule
- 0.94% ✗
- Cap rate
- 6.94%
- Cash-on-cash
- 2.32%
- DSCR
- 1.10
- GRM
- 8.8
CMA / ARV
No comps found within radius.
Projected returns pro-forma
5.54% appreciation · 3.0% rent growth · sell at horizon
- IRR
- 16.2%
- Equity multiple
- 2.06×
- Total profit
- $26,650
- Equity at exit
- $53,942
- IRR
- 16.3%
- Equity multiple
- 4.05×
- Total profit
- $76,695
- Equity at exit
- $95,674
Cash invested: $25,172 (down + closing). Projections, not guarantees.
Landlord ↔ Tenant lean methodology
- Overall (STATE)
- 83 Strongly Landlord-Friendly
- State Oklahoma
- 83 Strongly Landlord-Friendly · R+20
- County
- — inherits STATE
- City
- — inherits STATE
ZIP-level market 74872
- Home prices YoY
- 1.9%
- Active inventory
- 41
- Price-to-rent
- 8.8×
Monthly cashflow live
- Estimated rent
- $848 medium interval (Pro) →
- Mortgage (P&I)
- −$471
- Tax est. 1.5%
- −$112 /mo · $1,348/yr
- Insurance
- −$37
- HOA
- −$0
- Vacancy / Maint / Mgmt
- −$178
- Net cashflow
- $49
Break-even live
UW: 25.0% down · 7.5% · 30yr · 1.5% tax · 5.0% vac · 8.0% maint · 8.0% mgmt
Financing live
Cash to close
- Down payment
- $22,475
- Closing costs
- $2,697
- Reserves months
- —
- Total cash needed
- —
Loan-product check · same deal, 3 products live
Conventional
25% down · 7.5% · 30yr
- Down + closing
- —
- Monthly P&I
- —
- Monthly cashflow
- —
- DSCR
- —
- Eligible?
- —
Personal DTI + credit; lowest rate.
DSCR
20% down · 8.5% · 30yr
- Down + closing
- —
- Monthly P&I
- —
- Monthly cashflow
- —
- DSCR
- —
- Eligible?
- —
No personal income docs; deal must DSCR.
Hard money
10% down · 12.0% · 12mo
- Down + closing
- —
- Monthly P&I
- —
- Monthly cashflow
- —
- DSCR
- —
- Eligible?
- —
Short-term bridge; refi at stabilization.
Listing history 17 events
-
2026-06-19days on market $89,900 Active 64 DOM
-
2026-06-18days on market $89,900 Active 63 DOM
-
2026-06-17days on market $89,900 Active 62 DOM
-
2026-06-16days on market $89,900 Active 61 DOM
-
2026-06-15days on market $89,900 Active 60 DOM
-
2026-06-14days on market $89,900 Active 58 DOM
-
2026-06-12days on market $89,900 Active 57 DOM
-
2026-06-09days on market $89,900 Active 54 DOM
-
2026-06-08days on market $89,900 Active 53 DOM
-
2026-06-07days on market $89,900 Active 52 DOM
-
2026-06-05days on market $89,900 Active 49 DOM
-
2026-06-03days on market $89,900 Active 48 DOM
-
2026-06-02days on market $89,900 Active 47 DOM
-
2026-06-01days on market $89,900 Active 46 DOM
-
2026-05-31days on market $89,900 Active 45 DOM
-
2026-05-30days on market $89,900 Active 44 DOM
-
2026-04-16$89,900 Active
ⓘ Source: listings_history table (triggers on properties + properties_extension) + one-shot
backfill from property_details.listing_events for pre-trigger history.
Climate risk First Street
- Flood 1/10 Low FEMA zone X (unshaded) · 0% chance over 30 yrs
- Wildfire 7/10 Severe
- Heat 5/10 Major 7 d/yr ≥108°F today · 18 d/yr by 30 yrs out
- Wind 4/10 Moderate 9% chance of damaging wind over 30 yrs
- Air quality 2/10 Low 1 unhealthy d/yr today · 1 by 30 yrs out
Nearby sold comps map
Loading sold comps map…
Walkable amenities ~0.75 mi
Loading nearby amenities…
Taxation est. · year 1
- Rental income
- $10,176
- − Mortgage interest
- −$5,036
- − Property taxes
- −$1,348
- − Insurance
- −$450
- − Repairs & maintenance
- −$814
- − Management
- −$814
- − Depreciation
- −$2,615
- Taxable loss
- −$901
- Est. tax savings @ 24.0%
- +$216
- After-tax cash flow
- $800/yr
For passive investors: Depreciation is non-cash, so a rental often shows a tax loss while cash-flowing — sheltering income. Rental losses are passive: they offset passive income freely, and up to $25,000/yr can offset ordinary (W-2) income if you actively participate and your MAGI is under $100k (phasing out to $0 by $150k); unused losses carry forward. On sale, claimed depreciation is recaptured at up to 25%, and gains may owe capital-gains tax (a 1031 exchange can defer both). Figures are a year-1 estimate at your 24.0% rate — not tax advice; consult a CPA.
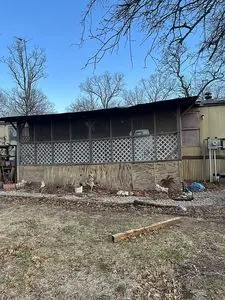
Condition & rehab AI · 2 photos
This property requires extensive repairs and improvements, including major work on the roof, exterior siding, and landscaping. Significant structural and functional issues are evident, making it a high-potential project for investors looking to build value from the ground up.
Repairs flagged
- Major roof — Significant damage and potential leaks.
- Major exterior siding — Weathered and peeling, indicating structural issues.
- Major landscaping — Overgrown and unkempt, requiring significant maintenance and landscaping improvements.
- Major exterior walls — Peeling paint and siding damage, indicating structural issues and potential water damage.
- Major HVAC — No specific systems are visible, but the overall condition suggests potential issues with HVAC and utilities.
- Major foundation — No specific foundation issues are visible, but the exterior condition suggests potential structural issues and water damage.
Value-add opportunities
- Both landscaping and exterior improvements — Enhances curb appeal and property value.
- Both roof and exterior siding repairs — Fixes structural issues and improves property value.
- Both HVAC and utilities inspection — Ensures functionality and energy efficiency, improving both resale and rental value.
- Both interior repairs and updates — Improves living conditions and enhances property value for both resale and rental.
Renovation cost estimate screening
| Repair item | Severity | Est. cost |
|---|---|---|
| roof · Significant damage and potential leaks. | Major | $15,000–50,000 |
| exterior siding · Weathered and peeling, indicating structural issues. | Major | $15,000–50,000 |
| landscaping · Overgrown and unkempt, requiring significant maintenance and landscaping improvements. | Major | $15,000–50,000 |
| exterior walls · Peeling paint and siding damage, indicating structural issues and potential water damage. | Major | $15,000–50,000 |
| HVAC · No specific systems are visible, but the overall condition suggests potential issues with HVAC and utilities. | Major | $15,000–50,000 |
| foundation · No specific foundation issues are visible, but the exterior condition suggests potential structural issues and water damage. | Major | $15,000–50,000 |
| Total estimated repair cost · 6 items | $90,000–300,000 |
Value-add ROI direction
- Both landscaping and exterior improvements — Enhances curb appeal and property value. ↑
- Both roof and exterior siding repairs — Fixes structural issues and improves property value. ↑
- Both HVAC and utilities inspection — Ensures functionality and energy efficiency, improving both resale and rental value. ↑
- Both interior repairs and updates — Improves living conditions and enhances property value for both resale and rental. ↑
ⓘ Cost ranges are severity-bucket heuristics (US national rule-of-thumb). Get contractor quotes + a written scope before underwriting a rehab budget.
Schools (NCES district)
- District
- Stratford
- NCES district ID
- 4028980
- Math proficiency
- 27% ▼ -11.00%
- Reading proficiency
- 22% ▼ -11.00%
- Median HH income
- $35,090
- Composite
- 20.25/100
- National rank
- #8622
- State rank
- #130 of 270 in OK
Livability — Stratford
- Score
- 61/100
- State rank
- #291
- US rank
- #17642
Category grades
Schools grade is shown separately in the Schools card above.
Census & demographics
- Population (ZIP)
- 3,102
Population outlook (Garvin County) Hauer SSP2
- Today (2025)
- 28,277 people
- By 2030
- 28,619 · +1.2%
- By 2040
- 29,478 · +4.2%
- By 2050
- 30,384 · +7.5%
- By 2075
- 34,074 · +20.5%
- By 2100
- 36,099 · +27.7%
Race, ethnicity, and origin ACS 2023
- Neighborhood character
- Predominantly White (70%)
- Race & ethnicity
- White 70% Two or more races 18% Native American 8% Hispanic / Latino 5%
- Hispanic origin (detail)
- Mexican 5%
- Common ancestry
- Slovak 4% Italian 3% European 3%
- Foreign-born
- 1% · Canada
- Languages at home
- 97% English-only · Spanish 2%
Political lean MEDSL · Garvin
- 2024 margin
- Solid R (+66.1) · D 16.4% · R 82.5% · Other 1.1%
- 2008→2024 swing
- -22.5pp toward R · 2008: -43.6pp · 2024: -66.1pp
- All cycles
- 2024: R+66.1 2020: R+64.2 2016: R+60.7 2012: R+46.1 2008: R+43.6
Not yet ingested
- Civics
- —
Market trends
- HPI YoY
- ▲ 5.54%
- Current HPI
- 291.1099
- Rent YoY
- —
- Metro
- —
- State GDP YoY
- ▲ 1.55%
- F500 in state
- 6
Industry mix (Fortune 500 HQ in OK)
| Industry | F500 HQs | Revenue |
|---|---|---|
| Energy | 3 | $48B |
|
||
Price history
1 event — show timeline
- 2026-04-16 Listed $89,900 MLSOK
Cash-flow waterfall
monthlySold comps — $/sqft
last 12 mo · ≤1 miLoading sold comps…