2215 Gwin Ln · Benton, AR
Flood risk 1/10 · Minimal
- FEMA flood zone
- X (unshaded)
- Chance of flooding over 30 yrs
- 0.0%
- Est. flood insurance / yr
- $473 – $860
Fire risk 4/10 · Minor
- Est. fire insurance / yr
- $1,499 – $2,785
Heat risk 6/10 · Moderate
- Hot days now (above 110°F)
- 7 days/yr
- Hot days in 30 yrs
- 19 days/yr
Wind risk 4/10 · Minor
- Chance of severe wind over 30 yrs
- 9.0%
Air-quality risk 2/10 · Minimal
- Unhealthy air days now
- 0 days/yr
- Unhealthy air days in 30 yrs
- 1 days/yr
Risk factors via First Street. Map © Google.
Why this score? — see what drove the C- grade
The composite is a weighted blend of 9 inputs, each scored 0–100. Each bar is that input's sub-score; the figure is the points it added to the 100-point composite (weight × sub-score).
- Cash flow +15.4/30.0
- ARV discount +15.0/15.0
- DSCR +4.7/10.0
- Schools +4.1/10.0
- Rent growth +3.6/5.0
- Livability +3.3/5.0
- 1% rule +3.0/10.0
- Condition / age +2.5/5.0
- Appreciation +0.0/10.0
$230,000
🖨 Deal sheet 📄 Offer letter ✓ Due diligence
Listing remarks
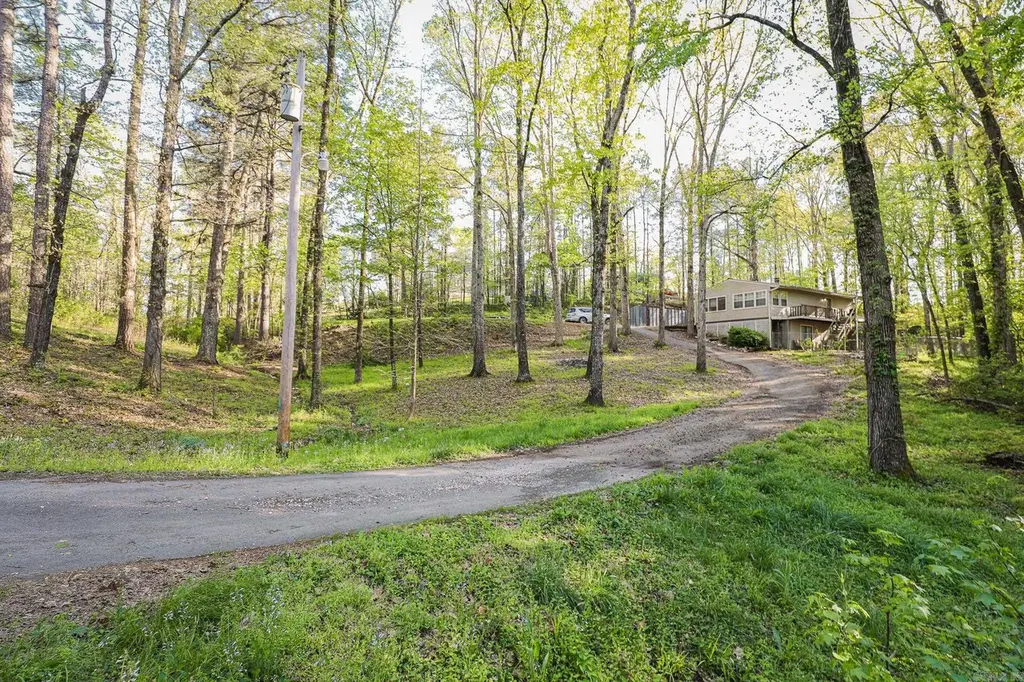
Country setting yet conveniently close to town, this charming home offers the best of both worlds. Situated on a little over an acre of land, this property has four bedrooms and two baths, providing ample space for comfortable living. There is a versatile flex space, perfect for accommodating your unique needs and preferences. Whether you envision it as a home office, a playroom for the kids, or a large walk in closet, the possibilities are endless. Additionally, you'll find a screened-in front porch, where you can relax and soak in the peaceful surroundings while enjoying the fresh air. The fenced-in front yard provides a safe and secure space for your pets to play freely. For added conven
Key facts
- Flex space
- Storage building
- Fenced in front yard
Tags
Property features AI
Finance
- Financial info: Financing available: VA, FHA, Conventional, or Cash
Exterior
- Parking: Parking for 4+ cars
- Utilities: Public water; Septic system; Electric service via cooperative; Insulated windows
- Home design: Metal/vinyl siding; Sloped, wooded lot; Not in a subdivision; Paved road access
- Construction: Metal roof; Slab foundation
- Exterior features: Deck; Screened porch; Porch; Partially fenced yard; Guttering; Shop
Interior
- Kitchen: Free-standing stove; Electric range; Dishwasher; Disposal
- Bedrooms: Bonus room
- Flooring: Carpet; Vinyl; Luxury vinyl
- Bathrooms: 2 full bathrooms
- Heating & cooling: Central electric heat; Central electric cooling; Heat pump
- Interior features: Wood-burning stove fireplace; Carpet, vinyl and luxury vinyl flooring
Neighborhood map
What this means for you Summary
Snapshot
- This is a 4-bed/1.5-bath single-family listed at $230k.
Deal economics
- At list price, monthly cash flow is $87 ($1k/yr) — positive.
- The deal already cash-flows at list — no discount required.
- To meet the 1% rule (rent ≥ 1% of price), the offer needs to be $185k (19.7% below list).
- Recommended offer: $185k (19.7% below list) — sets the bar for 1% rule.
- Cap rate 6.7% vs local median 4.5% in Benton — top-decile yield for the area; either an underpriced asset or a hidden risk that comps aren't pricing in. Stress-test before assuming the spread holds.
Location & tenants
- Location reads 66/100 on livability (#119 in AR) — a middle-class / working-renter tenant base. Strengths: cost of living A+, housing A+; Watch: crime D, amenities F, commute F.
- Benton School District (suburban): math 51% / reading 43% proficiency, ranked #25 of 238 in AR (top 10%) — families likely to look elsewhere, expect single-tenant / working-renter base with shorter leases.
- Zoned schools: Benton High School (math 41% / reading 50%, grade D-, #24 of 292 statewide, top 9%, 1,319 students, 30% FRL) — zoned schools at 30% FRL track the district average.
- Market conditions: Rents rising fast (+4.5%/yr); 244 active listings in the ZIP; solid renter incomes; 446 units permitted in Saline County in 2024 (0 in 5+ unit buildings).
Forward outlook
- Local home prices are declining (-3.0%/yr); year-one equity from $2k of loan paydown is wiped out by about $7k of value loss. Plan a longer hold.
- Saline County population projected at +39% by 2050 — long-run rental-demand tailwind backs the buy-and-hold thesis.
Negotiation context
- It's been on market 48 days — a 3% lower offer ($223k) is reasonable based on typical stale-listing flexibility.
- 7 sale attempts since 9y ago with the ask held roughly flat each time — persistent listings suggest the price (not the market) is what's stuck; bring a comps-based counter.
- Current owner paid $200k; 15% above their basis — modest negotiation headroom, anchor on the comps not their cost.
Risks & watch-outs
- Climate carrying-cost: extreme-heat days projected 7→19/yr by 2055 (HVAC capex compounding) — expect insurance premiums to compound above CPI over the hold.
Questions for the listing agent
- It's been on market 48 days. Have you received any prior offers? Is the seller open to a 20% concession, seller financing, or rate buy-down credit?
- Built in 1976 — when were the roof, HVAC, electrical panel, plumbing, and water heater last replaced?
- Is there a deadline driving the sale (1031 exchange, divorce, estate, relocation)? That informs how much negotiation room exists.
- Crime grade is D in this area — have there been break-ins, vandalism, or insurance claims at this property in the last 3 years? What carrier currently insures it and at what premium?
- What's the average days-on-market for RENTAL listings here right now (not sales)? A rising rental-DOM trend means longer vacancies and softer asking-rent achievability than the comps imply.
- What's the recent tenant-quality profile in this submarket — average credit score on applications, eviction rate, late-payment / NSF rate, and stable-employment percentage? A property-management company in the area should have these aggregated.
- How much new for-sale + rental construction is in the pipeline within 1–3 miles? Heavy new supply typically softens prices + rents 12–24 months out; constrained supply supports both.
Investment metrics
- 1% rule
- 0.80% ✗
- Cap rate
- 6.75%
- Cash-on-cash
- 1.62%
- DSCR
- 1.07
- GRM
- 10.4
CMA / ARV
- ARV (median comp)
- $287,317
- List price
- $230,000
- Delta
- -19.95%
- Verdict
- UNDERPRICED
- Comps
- 5 within 1.0 mi
Show comp detail 1 sale within ~0.75 mi
| Address | Dist | Beds/Ba | Sqft | Sold | Price | $/sf | Match |
|---|---|---|---|---|---|---|---|
| 1117 Peeler Bend Rd | 0.66mi | 3/2.5 (-1) | 1,787 (-11%) | 12mo | $258,000 | $144 | 31 |
Match score weights: distance 35% · size 25% · config 20% · recency 20%. Top-matched comps best support the ARV.
Projected returns pro-forma
-3.0% appreciation · 4.53% rent growth · sell at horizon
- IRR
- -12.3%
- Equity multiple
- 0.55×
- Total profit
- $-28,945
- Equity at exit
- $34,294
- IRR
- -1.3%
- Equity multiple
- 0.90×
- Total profit
- $-6,281
- Equity at exit
- $19,886
Cash invested: $64,400 (down + closing). Projections, not guarantees.
Landlord ↔ Tenant lean methodology
- Overall (STATE)
- 92 Strongly Landlord-Friendly
- State Arkansas
- 92 Strongly Landlord-Friendly · R+14
- County
- — inherits STATE
- City
- — inherits STATE
ZIP-level market 72019
- Home prices YoY
- -12.2%
- Rents YoY
- 4.5%
- Active inventory
- 244
- Price-to-rent
- 10.4×
Monthly cashflow live
- Estimated rent
- $1,846 medium interval (Pro) →
- Mortgage (P&I)
- −$1,206
- Tax from tax record
- −$69 /mo · $832/yr
- Insurance
- −$96
- HOA
- −$0
- Vacancy / Maint / Mgmt
- −$388
- Net cashflow
- $87
Break-even live
UW: 25.0% down · 7.5% · 30yr · 1.5% tax · 5.0% vac · 8.0% maint · 8.0% mgmt
Financing live
Cash to close
- Down payment
- $57,500
- Closing costs
- $6,900
- Reserves months
- —
- Total cash needed
- —
Loan-product check · same deal, 3 products live
Conventional
25% down · 7.5% · 30yr
- Down + closing
- —
- Monthly P&I
- —
- Monthly cashflow
- —
- DSCR
- —
- Eligible?
- —
Personal DTI + credit; lowest rate.
DSCR
20% down · 8.5% · 30yr
- Down + closing
- —
- Monthly P&I
- —
- Monthly cashflow
- —
- DSCR
- —
- Eligible?
- —
No personal income docs; deal must DSCR.
Hard money
10% down · 12.0% · 12mo
- Down + closing
- —
- Monthly P&I
- —
- Monthly cashflow
- —
- DSCR
- —
- Eligible?
- —
Short-term bridge; refi at stabilization.
Listing history 39 events
-
2026-06-18days on market $230,000 Active 48 DOM
-
2026-06-17days on market $230,000 Active 47 DOM
-
2026-06-16days on market $230,000 Active 46 DOM
-
2026-06-15days on market $230,000 Active 45 DOM
-
2026-06-14days on market $230,000 Active 43 DOM
-
2026-06-13days on market $230,000 Active 42 DOM
-
2026-06-10days on market $230,000 Active 40 DOM
-
2026-06-09days on market $230,000 Active 39 DOM
-
2026-06-08days on market $230,000 Active 38 DOM
-
2026-06-07days on market $230,000 Active 37 DOM
-
2026-06-03days on market $230,000 Active 33 DOM
-
2026-06-02days on market $230,000 Active 32 DOM
-
2026-06-01days on market $230,000 Active 31 DOM
-
2026-05-31days on market $230,000 Active 30 DOM
-
2026-05-31days on market $230,000 Active 29 DOM
-
2026-05-17price $230,000 950-char remark
-
2026-05-01$240,000 New Listing 950-char remark
-
2024-05-31historical
-
2024-05-23price $220,000
-
2024-05-03$225,000 New Listing
-
2024-05-03historical
-
2024-04-26price $230,000
-
2024-04-12$235,000 New Listing
-
2022-06-09soldstatus $200,000
-
2022-06-02soldstatus $200,000 Sold
-
2022-05-05status Under Contract
-
2022-05-03price $199,900
-
2022-04-24price $224,900
-
2022-04-22$229,900 New Listing
-
2021-02-22soldstatus $123,000
-
2021-02-12soldstatus $123,000
-
2020-12-21$123,000
-
2017-03-21soldstatus $95,000
-
2017-03-14soldstatus $95,000 Sold
-
2017-02-10status Under Contract
-
2017-01-20status Back on Market
-
2017-01-14status Under Contract
-
2017-01-09$99,500 New Listing
-
1990-09-01soldstatus $53,000
ⓘ Source: listings_history table (triggers on properties + properties_extension) + one-shot
backfill from property_details.listing_events for pre-trigger history.
Tax reassessment forecast AR · Resets to sale price
- Current annual tax
- $832 · $69/mo
- Projected year-2 tax
- $1,472 · $123/mo
- Expected delta
- +$640/yr (+$53/mo · 76.9%)
ⓘ Screening estimate from a state-policy table — verify with the county assessor before closing.
Climate risk First Street
- Flood 1/10 Low FEMA zone X (unshaded) · 0% chance over 30 yrs
- Wildfire 4/10 Moderate
- Heat 6/10 Major 7 d/yr ≥110°F today · 19 d/yr by 30 yrs out
- Wind 4/10 Moderate 9% chance of damaging wind over 30 yrs
- Air quality 2/10 Low 0 unhealthy d/yr today · 1 by 30 yrs out
Nearby sold comps map
Loading sold comps map…
Walkable amenities ~0.75 mi
Loading nearby amenities…
Taxation est. · year 1
- Rental income
- $22,153
- − Mortgage interest
- −$12,884
- − Property taxes
- −$832
- − Insurance
- −$1,150
- − Repairs & maintenance
- −$1,772
- − Management
- −$1,772
- − Depreciation
- −$6,691
- Taxable loss
- −$2,948
- Est. tax savings @ 24.0%
- +$708
- After-tax cash flow
- $1,752/yr
For passive investors: Depreciation is non-cash, so a rental often shows a tax loss while cash-flowing — sheltering income. Rental losses are passive: they offset passive income freely, and up to $25,000/yr can offset ordinary (W-2) income if you actively participate and your MAGI is under $100k (phasing out to $0 by $150k); unused losses carry forward. On sale, claimed depreciation is recaptured at up to 25%, and gains may owe capital-gains tax (a 1031 exchange can defer both). Figures are a year-1 estimate at your 24.0% rate — not tax advice; consult a CPA.
Schools (NCES district)
- District
- Benton School District
- NCES district ID
- 0502960
- Math proficiency
- 51% ▼ -10.00%
- Reading proficiency
- 43% ▼ -10.00%
- Median HH income
- $51,870
- Composite
- 40.52/100
- National rank
- #3707
- State rank
- #25 of 238 in AR
Livability — Benton
- Score
- 66/100
- State rank
- #119
- US rank
- #11460
Category grades
Schools grade is shown separately in the Schools card above.
Census & demographics
- County
- Saline County · 77,216 people
- City population
- 58,767
- Metro
- Little Rock-North Little Rock-Conway, AR
- Population (ZIP)
- 30,055
- Household income
- $87,869
- Rent vs Own
- Severe rent burden
- 331.0
Population outlook (Saline County) Hauer SSP2
- Today (2025)
- 140,141 people
- By 2030
- 151,233 · +7.9%
- By 2040
- 173,100 · +23.5%
- By 2050
- 194,368 · +38.7%
- By 2075
- 245,295 · +75.0%
- By 2100
- 279,117 · +99.2%
Race, ethnicity, and origin ACS 2023
- Neighborhood character
- Predominantly White (83%)
- Race & ethnicity
- White 83% Hispanic / Latino 8% Two or more races 5% Black 3% Asian 2%
- Hispanic origin (detail)
- Mexican 6%
- Common ancestry
- Italian 3% Slovak 2% Lithuanian 2%
- Foreign-born
- 3% · Canada, China, Vietnam
- Languages at home
- 92% English-only · Spanish 6% Vietnamese 1%
Political lean MEDSL · Saline
- 2024 margin
- Solid R (+40.1) · D 28.8% · R 69.0% · Other 2.2%
- 2008→2024 swing
- +0.8pp no change · 2008: -41.0pp · 2024: -40.1pp
- All cycles
- 2024: R+40.1 2020: R+41.2 2016: R+43.5 2012: R+42.7 2008: R+41.0
Not yet ingested
- Civics
- —
Market trends
- HPI YoY
- ▼ -29.95%
- Current HPI
- 215.1912
- Rent YoY
- ▲ 4.53%
- Metro
- Little Rock-North Little Rock-Conway, AR
- State GDP YoY
- ▲ 3.80%
- F500 in state
- 10
Industry mix (Fortune 500 HQ in AR)
| Industry | F500 HQs | Revenue |
|---|---|---|
| Retail | 1 | $681B |
|
||
| Food / Agriculture | 1 | $53B |
|
||
| Retail / Energy | 1 | $22B |
|
||
| Transportation / Logistics | 1 | $12B |
|
||
| Energy | 1 | $4B |
|
||
Price history
+334.0% since first listed24 events — show timeline
- 2026-05-17 Price Changed $230,000 CARMLS
- 2026-05-01 Listed $240,000 CARMLS
- 2024-05-31 Listing Removed — CARMLS
- 2024-05-23 Price Changed $220,000 CARMLS
- 2024-05-03 Listing Removed — CARMLS
- 2024-05-03 Listed $225,000 CARMLS
- 2024-04-26 Price Changed $230,000 CARMLS
- 2024-04-12 Listed $235,000 CARMLS
- 2022-06-09 Sold (Public Records) $200,000 Public Records
- 2022-06-02 Sold (MLS) $200,000 CARMLS
- 2022-05-05 Pending — CARMLS
- 2022-05-03 Price Changed $199,900 CARMLS
- 2022-04-24 Price Changed $224,900 CARMLS
- 2022-04-22 Listed $229,900 CARMLS
- 2021-02-22 Sold (Public Records) $123,000 Public Records
- 2021-02-12 Sold (MLS) $123,000 CARMLS
- 2020-12-21 Listed $123,000 CARMLS
- 2017-03-21 Sold (Public Records) $95,000 Public Records
- 2017-03-14 Sold (MLS) $95,000 CARMLS
- 2017-02-10 Pending — CARMLS
- 2017-01-20 Relisted — CARMLS
- 2017-01-14 Pending — CARMLS
- 2017-01-09 Listed $99,500 CARMLS
- 1990-09-01 Sold (Public Records) $53,000 Public Records
Property tax history
+2.8%/yrLatest (2025): $832 · -10.7% YoY. Source: county tax records.
Cash-flow waterfall
monthlySold comps — $/sqft
last 12 mo · ≤1 miLoading sold comps…