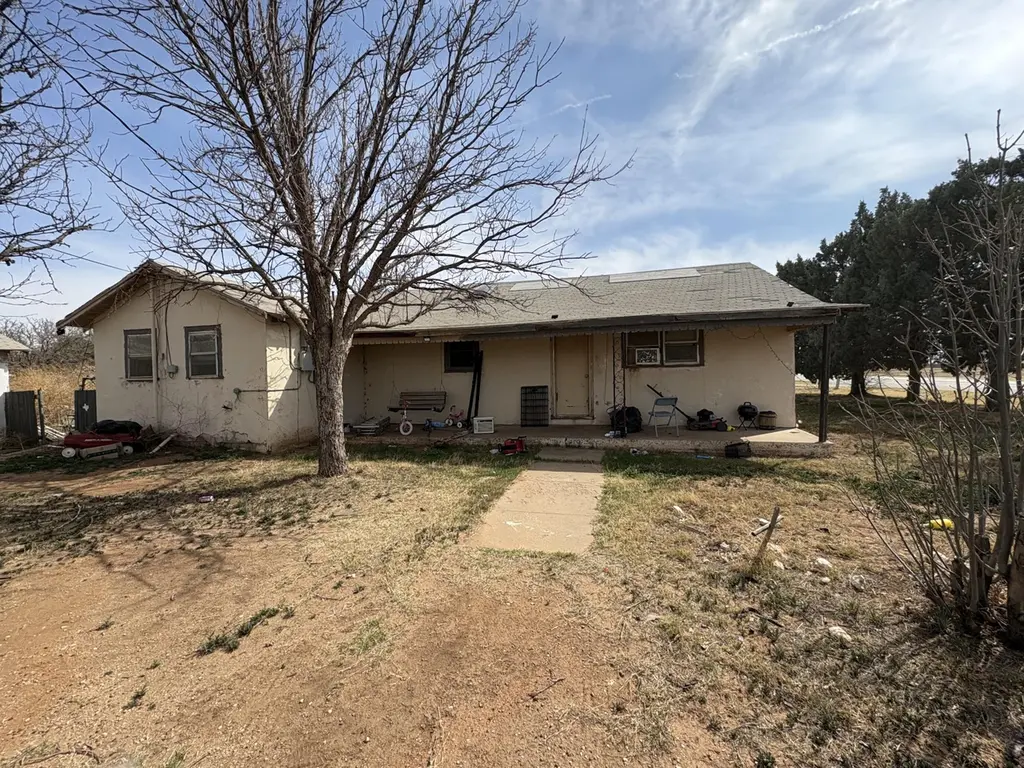
102 4th St · Whitharral, TX
Flood risk No data
- FEMA flood zone
- —
- Chance of flooding over 30 yrs
- —
- Est. flood insurance / yr
- —
Fire risk No data
- Est. fire insurance / yr
- —
Heat risk No data
- Hot days now (above threshold)
- —
- Hot days in 30 yrs
- —
Wind risk No data
- Chance of severe wind over 30 yrs
- —
Air-quality risk No data
- Unhealthy air days now
- —
- Unhealthy air days in 30 yrs
- —
Risk factors via First Street. Map © Google.
Why this score? — see what drove the D+ grade
The composite is a weighted blend of 9 inputs, each scored 0–100. Each bar is that input's sub-score; the figure is the points it added to the 100-point composite (weight × sub-score).
- Cash flow +15.0/30.0
- ARV discount +7.5/15.0
- 1% rule +5.0/10.0
- DSCR +5.0/10.0
- Appreciation +5.0/10.0
- Schools +4.5/10.0
- Rent growth +2.5/5.0
- Livability +2.5/5.0
- Condition / age +2.2/5.0
$28,000
🖨 Deal sheet (PDF) 📄 Offer letter ✓ Due diligence
Listing remarks MLS
Investor Special in the small town of Whitharral!! House is being sold as is!!
Key facts
- 0.48 acre lot
- Garage
- Built 1950
Neighborhood map
What this means for you Summary
Snapshot
- This is a 3-bed/2.0-bath single-family listed at $28k. Condition is rated fair.
Deal economics
- At list price, monthly cash flow is $753 ($9k/yr) — positive.
- The deal already cash-flows at list — no discount required.
- Meets the 1% rule at list price ($1k rent vs $28k).
- Recommended offer: $26k (6.0% below list) — sets the bar for market timing.
Location & tenants
- Location reads: area grade D — affects rentability + tenant quality, not the cash-flow math above.
- Whitharral ISD (rural): math 55% / reading 45% proficiency, ranked #355 of 1,141 in TX (top 31%) — acceptable for families but not a draw, mixed tenant base, ~2y average lease.
- Market conditions: 4 active listings in the ZIP; 7 units permitted in Hockley County in 2024 (0 in 5+ unit buildings).
Forward outlook
- In year one you build about $1k of equity ($194 loan paydown + $840 appreciation (3.0% local appreciation)).
- Hockley County population projected at +21% by 2050 — long-run rental-demand tailwind backs the buy-and-hold thesis.
- At projected returns (3.0% appreciation + 3.0% rent growth), your $8k cash investment doubles in ~1 year — after that, you're playing with house money.
Negotiation context
- It's been on market 66 days — a 6% lower offer ($26k) is reasonable based on typical stale-listing flexibility.
- 2 sale attempts with the ask held roughly flat each time — persistent listings suggest the price (not the market) is what's stuck; bring a comps-based counter.
Risks & watch-outs
- Watch-outs: built in 1950 — expect roof / HVAC / electrical / plumbing capex.
Questions for the listing agent
- It's been on market 66 days. Have you received any prior offers? Is the seller open to a 6% concession, seller financing, or rate buy-down credit?
- Have any recent inspections been done? Can we get a copy of the seller's disclosures and any deferred-maintenance estimates?
- Built in 1950 — when were the roof, HVAC, electrical panel, plumbing, and water heater last replaced?
- Why hasn't it sold? Are there any deal-killer items the seller is aware of (foundation, flood, title, zoning, code violations)?
- Is there a deadline driving the sale (1031 exchange, divorce, estate, relocation)? That informs how much negotiation room exists.
- The area grade is low — what's the realistic commute time and amenity access for the typical tenant pool here? Any planned neighborhood developments (good or bad) we should know about?
- What's the average days-on-market for RENTAL listings here right now (not sales)? A rising rental-DOM trend means longer vacancies and softer asking-rent achievability than the comps imply.
- What's the recent tenant-quality profile in this submarket — average credit score on applications, eviction rate, late-payment / NSF rate, and stable-employment percentage? A property-management company in the area should have these aggregated.
- How much new for-sale + rental construction is in the pipeline within 1–3 miles? Heavy new supply typically softens prices + rents 12–24 months out; constrained supply supports both.
Investment metrics
- 1% rule
- 4.28% ✓
- Cap rate
- 38.57%
- Cash-on-cash
- 115.29%
- DSCR
- 6.13
- GRM
- 1.9
CMA / ARV
No comps found within radius.
Projected returns pro-forma
3.0% appreciation · 3.0% rent growth · sell at horizon
- IRR
- —
- Equity multiple
- 7.55×
- Total profit
- $51,363
- Equity at exit
- $12,590
- IRR
- —
- Equity multiple
- 15.75×
- Total profit
- $115,646
- Equity at exit
- $19,403
Cash invested: $7,840 (down + closing). Projections, not guarantees.
Landlord ↔ Tenant lean methodology
- Overall (STATE)
- 87 Strongly Landlord-Friendly
- State Texas
- 87 Strongly Landlord-Friendly · R+5
- County
- — inherits STATE
- City
- — inherits STATE
ZIP-level market 79380
- Active inventory
- 4
- Price-to-rent
- 1.9×
Monthly cashflow live
- Estimated rent
- $1,198 medium interval (Pro) →
- Mortgage (P&I)
- −$147
- Tax est. 1.5%
- −$35 /mo · $420/yr
- Insurance
- −$12
- HOA
- −$0
- Vacancy / Maint / Mgmt
- −$252
- Net cashflow
- $753
Break-even live
Sensitivity live
| Price | -10% $773 | -5% $763 | +0% $753 | +5% $744 | +10% $734 |
|---|---|---|---|---|---|
| Rent | -10% $659 | -5% $706 | +0% $753 | +5% $801 | +10% $848 |
| Rate | -1.0pp $767 | -0.5pp $760 | base $753 | +0.5pp $746 | +1.0pp $739 |
UW: 25.0% down · 7.5% · 30yr · 1.5% tax · 5.0% vac · 8.0% maint · 8.0% mgmt
Financing live
Cash to close
- Down payment
- $7,000
- Closing costs
- $840
- Reserves months
- —
- Total cash needed
- —
Loan-product check · same deal, 3 products live
Conventional
25% down · 7.5% · 30yr
- Down + closing
- —
- Monthly P&I
- —
- Monthly cashflow
- —
- DSCR
- —
- Eligible?
- —
Personal DTI + credit; lowest rate.
DSCR
20% down · 8.5% · 30yr
- Down + closing
- —
- Monthly P&I
- —
- Monthly cashflow
- —
- DSCR
- —
- Eligible?
- —
No personal income docs; deal must DSCR.
Hard money
10% down · 12.0% · 12mo
- Down + closing
- —
- Monthly P&I
- —
- Monthly cashflow
- —
- DSCR
- —
- Eligible?
- —
Short-term bridge; refi at stabilization.
Listing history 5 events
-
2026-05-31status $28,000 Pending 66 DOM
-
2026-05-31days on market $28,000 Active 66 DOM
-
2026-04-16status Active 78-char remark
Show marketing remark (78 chars)
Investor Special in the small town of Whitharral!! House is being sold as is!!
-
2026-04-07status Pending 78-char remark
Show marketing remark (78 chars)
Investor Special in the small town of Whitharral!! House is being sold as is!!
-
2026-03-17$28,000 Active 78-char remark
Show marketing remark (78 chars)
Investor Special in the small town of Whitharral!! House is being sold as is!!
ⓘ Source: listings_history table (triggers on properties + properties_extension) + one-shot
backfill from property_details.listing_events for pre-trigger history.
Nearby sold comps map
Loading sold comps map…
Walkable amenities ~0.75 mi
Loading nearby amenities…
Taxation est. · year 1
- Rental income
- $14,380
- − Mortgage interest
- −$1,568
- − Property taxes
- −$420
- − Insurance
- −$140
- − Repairs & maintenance
- −$1,150
- − Management
- −$1,150
- − Depreciation
- −$815
- Taxable income
- $9,136
- Est. tax owed @ 24.0%
- −$2,193
- After-tax cash flow
- $6,846/yr
For passive investors: Depreciation is non-cash, so a rental often shows a tax loss while cash-flowing — sheltering income. Rental losses are passive: they offset passive income freely, and up to $25,000/yr can offset ordinary (W-2) income if you actively participate and your MAGI is under $100k (phasing out to $0 by $150k); unused losses carry forward. On sale, claimed depreciation is recaptured at up to 25%, and gains may owe capital-gains tax (a 1031 exchange can defer both). Figures are a year-1 estimate at your 24.0% rate — not tax advice; consult a CPA.
Condition & rehab AI · 2 photos
This home requires significant repairs and maintenance, including roof replacement, exterior painting, and landscaping. Upgrading the HVAC and mechanical systems, as well as painting the interior and exterior, would significantly increase its value.
Repairs flagged
- Major roof — The satellite image suggests significant damage to the roof.
- Major exterior walls — The exterior walls show signs of wear and discoloration.
- Major landscaping — The landscaping appears sparse and overgrown, which may require significant work to improve curb appeal.
- Major HVAC/mechanicals — No photos of the HVAC or mechanical systems are available to assess their condition, but they likely need significant work to function properly.
- Major interior walls/paint — No interior photos are available to assess the condition of the walls and paint, but they likely need significant work to be in good condition.
- Major foundation/structure — No photos of the foundation or structure are available to assess its condition, but it likely needs significant work to be in good condition.
- Major windows — No photos of the windows are available to assess their condition, but they likely need significant work to be in good condition.
Value-add opportunities
- Both roof replacement — Replacing the roof would significantly improve the home's appearance and functionality.
- Both exterior painting — Painting the exterior walls would improve the home's curb appeal and potentially increase its value.
- Both landscaping — Landscaping the property would improve its curb appeal and potentially increase its value.
- Both HVAC/mechanical upgrades — Upgrading the HVAC and mechanical systems would improve the home's functionality and potentially increase its value.
- Both interior painting — Painting the interior walls would improve the home's appearance and potentially increase its value.
- Both foundation repair — Repairing the foundation would improve the home's structural integrity and potentially increase its value.
- Both window replacement — Replacing the windows would improve the home's functionality and potentially increase its value.
Renovation cost estimate screening
| Repair item | Severity | Est. cost |
|---|---|---|
| roof · The satellite image suggests significant damage to the roof. | Major | $15,000–50,000 |
| exterior walls · The exterior walls show signs of wear and discoloration. | Major | $15,000–50,000 |
| landscaping · The landscaping appears sparse and overgrown, which may require significant work to improve curb appeal. | Major | $15,000–50,000 |
| HVAC/mechanicals · No photos of the HVAC or mechanical systems are available to assess their condition, but they likely need significant work to function properly. | Major | $15,000–50,000 |
| interior walls/paint · No interior photos are available to assess the condition of the walls and paint, but they likely need significant work to be in good condition. | Major | $15,000–50,000 |
| foundation/structure · No photos of the foundation or structure are available to assess its condition, but it likely needs significant work to be in good condition. | Major | $15,000–50,000 |
| windows · No photos of the windows are available to assess their condition, but they likely need significant work to be in good condition. | Major | $15,000–50,000 |
| Total estimated repair cost · 7 items | $105,000–350,000 |
Value-add ROI direction
- Both roof replacement — Replacing the roof would significantly improve the home's appearance and functionality. ↑
- Both exterior painting — Painting the exterior walls would improve the home's curb appeal and potentially increase its value. ↑
- Both landscaping — Landscaping the property would improve its curb appeal and potentially increase its value. ↑
- Both HVAC/mechanical upgrades — Upgrading the HVAC and mechanical systems would improve the home's functionality and potentially increase its value. ↑
- Both interior painting — Painting the interior walls would improve the home's appearance and potentially increase its value. ↑
- Both foundation repair — Repairing the foundation would improve the home's structural integrity and potentially increase its value. ↑
- Both window replacement — Replacing the windows would improve the home's functionality and potentially increase its value. ↑
ⓘ Cost ranges are severity-bucket heuristics (US national rule-of-thumb). Get contractor quotes + a written scope before underwriting a rehab budget.
Schools (NCES district)
- District
- Whitharral ISD
- NCES district ID
- 4845690
- Math proficiency
- 55% ▲ 5.00%
- Reading proficiency
- 45% ▼ -5.00%
- Median HH income
- $48,914
- Composite
- 44.72/100
- National rank
- #5972
- State rank
- #355 of 1141 in TX
Livability — Whitharral
No livability data for this city. (Only ~50 U.S. cities are tracked.)
Census & demographics
- Census place
- Whitharral, TX
- City population
- 89
- Population (ZIP)
- 89
Population outlook (Hockley County) Hauer SSP2
- Today (2025)
- 25,295 people
- By 2030
- 26,230 · +3.7%
- By 2040
- 28,268 · +11.8%
- By 2050
- 30,536 · +20.7%
- By 2075
- 36,867 · +45.7%
- By 2100
- 40,662 · +60.8%
Race, ethnicity, and origin ACS 2023
- Neighborhood character
- Majority Hispanic (64%)
- Race & ethnicity
- Hispanic / Latino 64% White 36% Two or more races 35%
- Hispanic origin (detail)
- Mexican 64%
- Common ancestry
- Portuguese 6%
- Foreign-born
- 1% · Canada
- Languages at home
- 60% English-only · Spanish 40%
Political lean MEDSL · Hockley
- 2024 margin
- Solid R (+66.3) · D 16.6% · R 82.8%
- 2008→2024 swing
- -14.0pp toward R · 2008: -52.3pp · 2024: -66.3pp
- All cycles
- 2024: R+66.3 2020: R+62.4 2016: R+62.3 2012: R+57.0 2008: R+52.3
Not yet ingested
- Civics
- —
Market trends
- HPI YoY
- —
- Current HPI
- —
- Rent YoY
- —
- Metro
- —
- State GDP YoY
- ▲ 3.95%
- F500 in state
- 110
Industry mix (Fortune 500 HQ in TX)
| Industry | F500 HQs | Revenue |
|---|---|---|
| Energy | 16 | $1,198B |
|
||
| Technology | 5 | $198B |
|
||
| Engineering / Construction | 4 | $72B |
|
||
| Energy Services | 3 | $60B |
|
||
| Utilities | 3 | $41B |
|
||
| Healthcare | 2 | $330B |
|
||
Price history
3 events — show timeline
- 2026-04-16 Relisted — LARMLS
- 2026-04-07 Pending — LARMLS
- 2026-03-17 Listed $28,000 LARMLS
Cash-flow waterfall
monthlySold comps — $/sqft
last 12 mo · ≤1 miLoading sold comps…