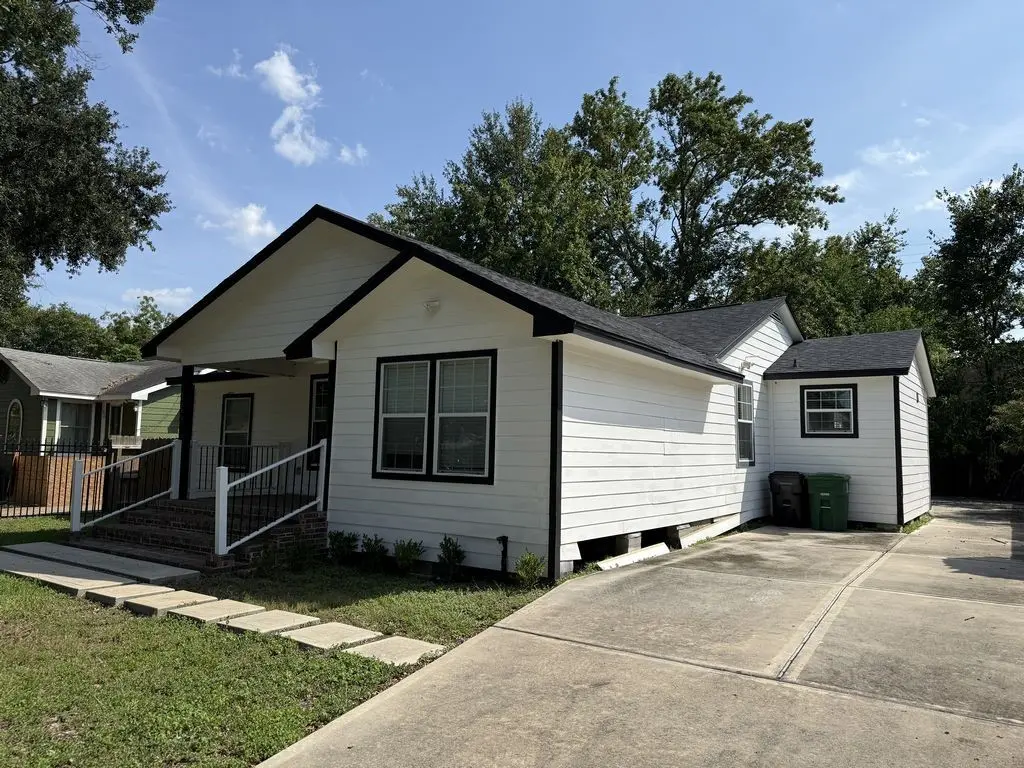
4522 Dewberry St · Houston, TX
Flood risk 7/10 · Major
- FEMA flood zone
- X (unshaded)
- Chance of flooding over 30 yrs
- 0.95%
- Est. flood insurance / yr
- $507 – $1,088
Fire risk 1/10 · Minimal
- Est. fire insurance / yr
- $1,222 – $2,270
Heat risk 9/10 · Severe
- Hot days now (above 109°F)
- 7 days/yr
- Hot days in 30 yrs
- 24 days/yr
Wind risk 9/10 · Severe
- Chance of severe wind over 30 yrs
- 99.0%
Air-quality risk 2/10 · Minimal
- Unhealthy air days now
- 2 days/yr
- Unhealthy air days in 30 yrs
- 2 days/yr
Risk factors via First Street. Map © Google.
Why this score? — see what drove the C- grade
The composite is a weighted blend of 9 inputs, each scored 0–100. Each bar is that input's sub-score; the figure is the points it added to the 100-point composite (weight × sub-score).
- ARV discount +15.0/15.0
- Cash flow +14.9/30.0
- 1% rule +5.2/10.0
- DSCR +4.6/10.0
- Livability +3.7/5.0
- Rent growth +3.0/5.0
- Schools +2.7/10.0
- Condition / age +2.5/5.0
- Appreciation +0.0/10.0
$195,000
🖨 Deal sheet 📄 Offer letter ✓ Due diligence
Listing remarks MLS
Great opportunity to own this gem. Featuring open floor-plan, engineered hardwood floors. quartz counter tops, recessed lightingand , updated fixtures and much more! This property has lots of upgrades through out! Long driveway with ample parking. Amazing front porch to sit and relax during those summer afternoon. HUGE back yard, great for entertainment. Location is close to downtown and medical center. Hurry, will not last.
Key facts
- Open floor-plan
- Recessed lighting
- Long driveway
Tags
Neighborhood map
What this means for you Summary
Snapshot
- This is a 3-bed/2.0-bath single-family listed at $195k.
Deal economics
- At list price, monthly cash flow is $-9 ($-104/yr) — negative.
- To cash-flow at today's rent, offer at most $193k (0.8% below list).
- Meets the 1% rule at list price ($2k rent vs $195k).
- Recommended offer: $172k (12.0% below list) — sets the bar for market timing.
- Cap rate 6.6% vs local median 3.2% in Houston — top-decile yield for the area; either an underpriced asset or a hidden risk that comps aren't pricing in. Stress-test before assuming the spread holds.
Location & tenants
- Location reads 74/100 on livability (#184 in TX, #4,771 nationally) — a middle-class / working-renter tenant base. Strengths: amenities A+, cost of living A+, housing A+; Watch: schools D, crime F.
- Houston ISD (urban): math 27% / reading 35% proficiency, ranked #593 of 826 in TX (top 72%) — families likely to look elsewhere, expect single-tenant / working-renter base with shorter leases; 71% free/reduced lunch — lower-income household profile, screen leases tightly.
- Market conditions: Rents rising (+2.2%/yr); 467 active listings in the ZIP; 40 comparable units currently listed for rent nearby; rentals at typical pace (median 18d on market — plan ~3-4 weeks tenant-placement turnaround); 29,883 units permitted in Harris County in 2024 (8,621 in 5+ unit buildings).
- At $1,998/mo this rent would consume 53% of the median local household income ($46k/yr) (locally 2532% of renters already pay >50% of income on rent) — very limited rent-growth headroom before tenants either downsize or default.
Forward outlook
- Local home prices are declining (-3.0%/yr); year-one equity from $1k of loan paydown is wiped out by about $6k of value loss. Plan a longer hold.
- Harris County population projected at +47% by 2050 — long-run rental-demand tailwind backs the buy-and-hold thesis.
Negotiation context
- It's been on market 274 days — a 12% lower offer ($172k) is reasonable based on typical stale-listing flexibility.
- 10 sale attempts since 4y ago; this cycle's ask has dropped $40k (17%) from the opening price — seller is motivated, your offer sets the floor, not the list.
Risks & watch-outs
- Watch-outs: property tax is 2.6% of price; flood insurance adds $66/mo; built in 1945 — expect roof / HVAC / electrical / plumbing capex.
- Climate carrying-cost: major flood risk; severe wind risk, 99% chance of damaging wind over 30y; extreme-heat days projected 7→24/yr by 2055 (HVAC capex compounding) — expect insurance premiums to compound above CPI over the hold.
Questions for the listing agent
- What do current leases actually rent for vs. the listed asking? Can we see a recent rent roll and the last 12 months of T-12 income?
- It's been on market 274 days. Have you received any prior offers? Is the seller open to a 12% concession, seller financing, or rate buy-down credit?
- Built in 1945 — when were the roof, HVAC, electrical panel, plumbing, and water heater last replaced?
- Property tax is high relative to price — has the assessment been appealed recently, and will the sale trigger a re-assessment?
- What's the actual annual flood-insurance premium (NFIP or private), and is the property in a SFHA with mandatory coverage?
- Why hasn't it sold? Are there any deal-killer items the seller is aware of (foundation, flood, title, zoning, code violations)?
- Is there a deadline driving the sale (1031 exchange, divorce, estate, relocation)? That informs how much negotiation room exists.
- Schools are D-rated, which usually means shorter tenancies and higher turnover. Who's the typical renter profile here, and what's been the actual vacancy rate?
- Crime grade is F in this area — have there been break-ins, vandalism, or insurance claims at this property in the last 3 years? What carrier currently insures it and at what premium?
- What's the average days-on-market for RENTAL listings here right now (not sales)? A rising rental-DOM trend means longer vacancies and softer asking-rent achievability than the comps imply.
- What's the recent tenant-quality profile in this submarket — average credit score on applications, eviction rate, late-payment / NSF rate, and stable-employment percentage? A property-management company in the area should have these aggregated.
- How much new for-sale + rental construction is in the pipeline within 1–3 miles? Heavy new supply typically softens prices + rents 12–24 months out; constrained supply supports both.
Investment metrics
- 1% rule
- 1.02% ✓
- Cap rate
- 6.65%
- Cash-on-cash
- 1.27%
- DSCR
- 1.06
- GRM
- 8.1
CMA / ARV
- ARV (median comp)
- $255,478
- List price
- $195,000
- Delta
- -23.67%
- Verdict
- UNDERPRICED
- Comps
- 20 within 1.0 mi
Show comp detail 12 sales within ~0.75 mi
| Address | Dist | Beds/Ba | Sqft | Sold | Price | $/sf | Match |
|---|---|---|---|---|---|---|---|
| 6419 Madrid St | 0.28mi | 3/2.5 | 1,693 (+1%) | 3mo | $329,900 | $195 | 81 |
| 6401 Goforth St | 0.31mi | 3/2.5 | 1,767 (+5%) | 4mo | $339,000 | $192 | 71 |
| 4336 Cosby St | 0.24mi | 3/3.5 | 1,871 (+12%) | 2mo | $342,999 | $183 | 62 |
| 4611 Idaho St | 0.61mi | 4/2.0 (+1) | 1,640 (-2%) | 4mo | $257,000 | $157 | 59 |
| 4755 Marietta Ln | 0.67mi | 3/1.0 | 1,628 (-3%) | 3mo | $150,000 | $92 | 58 |
| 4902 Winfree Dr | 0.56mi | 3/2.0 | 1,511 (-10%) | 2mo | $169,500 | $112 | 56 |
| 4826 Culmore Dr | 0.57mi | 3/2.0 | 1,501 (-10%) | 3mo | $279,000 | $186 | 53 |
| 6625 Goforth St | 0.46mi | 3/1.0 | 1,489 (-11%) | 4mo | $142,000 | $95 | 52 |
| 4013 Griggs Rd Unit J | 0.67mi | 3/3.5 | 1,795 (+7%) | 0mo | $334,900 | $187 | 51 |
| 4013 Griggs Rd Unit B | 0.67mi | 3/3.5 | 1,795 (+7%) | 1mo | $334,900 | $187 | 50 |
| 4013 Griggs Rd Unit K | 0.67mi | 3/3.5 | 1,795 (+7%) | 1mo | $334,900 | $187 | 50 |
| 4013 Griggs Rd Unit L | 0.67mi | 3/3.5 | 1,795 (+7%) | 2mo | $334,500 | $186 | 49 |
Match score weights: distance 35% · size 25% · config 20% · recency 20%. Top-matched comps best support the ARV.
Projected returns pro-forma
-3.0% appreciation · 2.17% rent growth · sell at horizon
- IRR
- -17.6%
- Equity multiple
- 0.38×
- Total profit
- $-33,626
- Equity at exit
- $29,075
- IRR
- -11.4%
- Equity multiple
- 0.34×
- Total profit
- $-35,946
- Equity at exit
- $16,860
Cash invested: $54,600 (down + closing). Projections, not guarantees.
Landlord ↔ Tenant lean methodology
- Overall (STATE)
- 87 Strongly Landlord-Friendly
- State Texas
- 87 Strongly Landlord-Friendly · R+5
- County
- — inherits STATE
- City
- — inherits STATE
ZIP-level market 77021
- Home prices YoY
- -23.6%
- Rents YoY
- 2.2%
- Active inventory
- 467
- Price-to-rent
- 8.1×
Monthly cashflow live
- Estimated rent
- $1,998 high interval (Pro) →
- Mortgage (P&I)
- −$1,023
- Tax from tax record
- −$417 /mo · $5,002/yr
- Insurance
- −$81
- Flood insurance flood zone
- −$66 /mo · $798/yr
- HOA
- −$0
- Vacancy / Maint / Mgmt
- −$420
- Net cashflow
- $-9
Break-even live
UW: 25.0% down · 7.5% · 30yr · 1.5% tax · 5.0% vac · 8.0% maint · 8.0% mgmt
Financing live
Cash to close
- Down payment
- $48,750
- Closing costs
- $5,850
- Reserves months
- —
- Total cash needed
- —
Loan-product check · same deal, 3 products live
Conventional
25% down · 7.5% · 30yr
- Down + closing
- —
- Monthly P&I
- —
- Monthly cashflow
- —
- DSCR
- —
- Eligible?
- —
Personal DTI + credit; lowest rate.
DSCR
20% down · 8.5% · 30yr
- Down + closing
- —
- Monthly P&I
- —
- Monthly cashflow
- —
- DSCR
- —
- Eligible?
- —
No personal income docs; deal must DSCR.
Hard money
10% down · 12.0% · 12mo
- Down + closing
- —
- Monthly P&I
- —
- Monthly cashflow
- —
- DSCR
- —
- Eligible?
- —
Short-term bridge; refi at stabilization.
Rent comps 40 comps
| Address | Beds | Baths | Sqft | Rent | $/sqft | DOM | Units | Dist |
|---|---|---|---|---|---|---|---|---|
| 6528 Weston St Unit A Houston, TX | 3.0 | 3.0 | 1484 | $2,200 | $1.48 | 43d | 1 | 0.36mi |
| 6532 Weston St Unit A Houston, TX | 3.0 | 3.0 | 1484 | $2,200 | $1.48 | 17d | 1 | 0.36mi |
| 6731 New York St Houston, TX | 3.0 | 3.0 | 2211 | $2,100 | $0.95 | 43d | 1 | 0.47mi |
| 5813 England St Unit A Houston, TX | 3.0 | 2.5 | 1473 | $2,195 | $1.49 | 3d | 1 | 0.47mi |
| 4705 Idaho St Houston, TX | 3.0 | 2.5 | 1664 | $2,500 | $1.50 | 16d | 1 | 0.61mi |
| 5123 Dewberry St Houston, TX | 4.0 | 2.0 | 1391 | $2,400 | $1.73 | 43d | 1 | 0.61mi |
| 4907 Culmore Dr Houston, TX | 4.0 | 2.0 | 1800 | $2,700 | $1.50 | 16d | 1 | 0.68mi |
| 6809 Conley St Houston, TX | 3.0 | 4.0 | 1921 | $2,600 | $1.35 | 43d | 1 | 0.69mi |
| 5116 Griggs Rd Houston, TX | 3.0 | 2.0 | 1131 | $1,316 | $1.16 | 43d | 1 | 0.71mi |
| 5154 Griggs Rd Unit CAVE Houston, TX | 2.0 | 2.0 | 1322 | $1,420 | $1.07 | 2d | 1 | 0.75mi |
| 3731 Alsace St Unit 1560804P Houston, TX | 3.0 | 2.0 | 2002 | $3,387 | $1.69 | 2d | 1 | 0.83mi |
| 7032 Conley St Houston, TX | 3.0 | 2.0 | 1220 | $2,850 | $2.34 | 43d | 1 | 0.87mi |
| 4907 Marietta Ln Unit 1494902P Houston, TX | 3.0 | 2.0 | 1593 | $3,278 | $2.06 | 13d | 1 | 0.87mi |
| 4942 Bataan Rd Unit 77033 Houston, TX | 4.0 | 2.0 | 1350 | $1,800 | $1.33 | 43d | 1 | 0.97mi |
| 3644 Griggs Rd Unit 1047940P Houston, TX | 3.0 | 2.5 | 1399 | $2,161 | $1.54 | 1d | 1 | 1.01mi |
| 5514 Griggs Rd Unit 2162 Houston, TX | 2.0 | 2.0 | 1322 | $1,190 | $0.90 | 5d | 1 | 1.06mi |
| 5514 Griggs Rd Unit 5571 Houston, TX | 2.0 | 2.0 | 1322 | $1,214 | $0.92 | 10d | 1 | 1.06mi |
| 5514 Griggs Rd Unit 422 Houston, TX | 2.0 | 2.0 | 1322 | $1,190 | $0.90 | 7d | 1 | 1.06mi |
| 5514 Griggs Rd Unit 2187 Houston, TX | 2.0 | 2.0 | 1322 | $1,182 | $0.89 | 2d | 1 | 1.06mi |
| 5514 Griggs Rd Houston, TX | 2.0 | 2.0 | 1322 | $1,210 | $0.92 | 43d | 1 | 1.07mi |
| 5514 Griggs Rd Unit 2047 Houston, TX | 2.0 | 2.0 | 1322 | $1,214 | $0.92 | 2d | 1 | 1.07mi |
| 5514 Griggs Rd Unit 2047 Houston, TX | 2.0 | 2.0 | 1322 | $1,225 | $0.93 | 10d | 1 | 1.07mi |
| 5317 Chennault Rd Unit A Houston, TX | 3.0 | 2.5 | 1608 | $1,999 | $1.24 | 43d | 1 | 1.07mi |
| 5101 Martin Luther King Blvd Unit MO54 Houston, TX | 2.0 | 2.0 | 1322 | $1,210 | $0.92 | 11d | 1 | 1.08mi |
| 3560 Dixie Dr Unit 3597 Houston, TX | 2.0 | 2.0 | 1322 | $1,434 | $1.08 | 10d | 1 | 1.12mi |
| 3560 Dixie Dr Unit 3617 Houston, TX | 2.0 | 2.0 | 1322 | $1,435 | $1.09 | 43d | 1 | 1.12mi |
| 3560 Dixie Dr Unit 2162 Houston, TX | 2.0 | 2.0 | 1322 | $1,410 | $1.07 | 5d | 1 | 1.12mi |
| 3560 Dixie Dr Apt 422 Houston, TX | 2.0 | 2.0 | 1322 | $1,410 | $1.07 | 7d | 1 | 1.12mi |
| 3560 Dixie Dr Unit 2165 Houston, TX | 2.0 | 2.0 | 1322 | $1,402 | $1.06 | 2d | 1 | 1.12mi |
| 4977 Martin Luther King Blvd Houston, TX | 4.0 | 4.0 | 1396 | $870 | $0.62 | 24d | 1 | 1.12mi |
| 5520 Griggs Rd Houston, TX | 2.0 | 2.0 | 1322 | $1,241 | $0.94 | 21d | 1 | 1.13mi |
| 5520 Griggs Rd Houston, TX | 2.0 | 2.0 | 1322 | $1,241 | $0.94 | 43d | 1 | 1.13mi |
| 7321 Conley St Unit B Houston, TX | 3.0 | 2.0 | 1501 | $2,025 | $1.35 | 20d | 1 | 1.15mi |
| 7321 Conley St Unit A Houston, TX | 3.0 | 2.5 | 1869 | $2,025 | $1.08 | 20d | 1 | 1.15mi |
| 6336 Culberson St Houston, TX | 3.0 | 3.5 | 1822 | $2,361 | $1.30 | 5d | 1 | 1.22mi |
| 6334 Culberson St Houston, TX | 3.0 | 3.5 | 1822 | $2,311 | $1.27 | 1d | 1 | 1.22mi |
| 7358 Guadalcanal Rd Houston, TX | 3.0 | 3.0 | 1768 | $2,195 | $1.24 | 43d | 1 | 1.22mi |
| 5835 Southmont St Houston, TX | 3.0 | 2.0 | 1200 | $1,700 | $1.42 | 43d | 1 | 1.24mi |
| 4465 N MacGregor Way Houston, TX | 4.0 | 4.0 | 1366 | $940 | $0.69 | 24d | 1 | 1.26mi |
| 3846 Seabrook St Houston, TX | 3.0 | 3.5 | 1833 | $2,300 | $1.25 | 43d | 1 | 1.29mi |
Listing history 37 events
-
2026-06-13days on market $195,000 Pending 274 DOM
-
2026-06-10days on market $195,000 Pending 271 DOM
-
2026-06-08days on market $195,000 Pending 270 DOM
-
2026-06-07statusdays on market $195,000 Pending 269 DOM
-
2026-06-04days on market $195,000 Active 266 DOM
-
2026-06-01days on market $195,000 Active 263 DOM
-
2026-05-31days on market $195,000 Active 262 DOM
-
2026-03-11status Active 432-char remark
Show marketing remark (432 chars)
Great opportunity to own this gem. Featuring open floor-plan, engineered hardwood floors. quartz counter tops, recessed lightingand , updated fixtures and much more! This property has lots of upgrades through out! Long driveway with ample parking. Amazing front porch to sit and relax during those summer afternoon. HUGE back yard, great for entertainment. Location is close to downtown and medical center. Hurry, will not last.
-
2026-03-10status Active 432-char remark
Show marketing remark (432 chars)
Great opportunity to own this gem. Featuring open floor-plan, engineered hardwood floors. quartz counter tops, recessed lightingand , updated fixtures and much more! This property has lots of upgrades through out! Long driveway with ample parking. Amazing front porch to sit and relax during those summer afternoon. HUGE back yard, great for entertainment. Location is close to downtown and medical center. Hurry, will not last.
-
2026-03-08historical 432-char remark
Show marketing remark (432 chars)
Great opportunity to own this gem. Featuring open floor-plan, engineered hardwood floors. quartz counter tops, recessed lightingand , updated fixtures and much more! This property has lots of upgrades through out! Long driveway with ample parking. Amazing front porch to sit and relax during those summer afternoon. HUGE back yard, great for entertainment. Location is close to downtown and medical center. Hurry, will not last.
-
2025-10-03price $195,000 432-char remark
Show marketing remark (432 chars)
Great opportunity to own this gem. Featuring open floor-plan, engineered hardwood floors. quartz counter tops, recessed lightingand , updated fixtures and much more! This property has lots of upgrades through out! Long driveway with ample parking. Amazing front porch to sit and relax during those summer afternoon. HUGE back yard, great for entertainment. Location is close to downtown and medical center. Hurry, will not last.
-
2025-09-08$235,000 Active 432-char remark
Show marketing remark (432 chars)
Great opportunity to own this gem. Featuring open floor-plan, engineered hardwood floors. quartz counter tops, recessed lightingand , updated fixtures and much more! This property has lots of upgrades through out! Long driveway with ample parking. Amazing front porch to sit and relax during those summer afternoon. HUGE back yard, great for entertainment. Location is close to downtown and medical center. Hurry, will not last.
-
2023-12-31historical
-
2023-09-30$295,000 Active
-
2023-09-23historical
-
2023-06-23$329,000 Active
-
2023-05-31historical
-
2023-05-05price $329,900
-
2023-03-29$339,000 Active
-
2023-03-29historical
-
2023-03-16$339,999 Active
-
2023-03-01historical
-
2022-12-05$339,999 Active
-
2022-11-04historical
-
2022-10-11$345,000 Active
-
2022-09-30historical
-
2022-09-21price $349,999
-
2022-07-05price $350,000
-
2022-06-09$359,900 Active
-
2021-04-22soldstatus
-
2018-01-23soldstatus
-
2014-12-24soldstatus
-
2014-11-24soldstatus
-
2013-04-22soldstatus
-
2004-10-20soldstatus
-
1988-01-02soldstatus
ⓘ Source: listings_history table (triggers on properties + properties_extension) + one-shot
backfill from property_details.listing_events for pre-trigger history.
Tax reassessment forecast TX · Resets to sale price
- Current annual tax
- $5,002 · $417/mo
- Projected year-2 tax
- $5,002 · $417/mo
- Expected delta
- $0/yr ($0/mo · 0.0%)
ⓘ Screening estimate from a state-policy table — verify with the county assessor before closing.
Climate risk First Street
- Flood 7/10 Severe FEMA zone X (unshaded) · 95% chance over 30 yrs
- Wildfire 1/10 Low
- Heat 9/10 Extreme 7 d/yr ≥109°F today · 24 d/yr by 30 yrs out
- Wind 9/10 Extreme 99% chance of damaging wind over 30 yrs
- Air quality 2/10 Low 2 unhealthy d/yr today · 2 by 30 yrs out
Nearby sold comps map
Loading sold comps map…
Walkable amenities ~0.75 mi
Loading nearby amenities…
Taxation est. · year 1
- Rental income
- $23,977
- − Mortgage interest
- −$10,923
- − Property taxes
- −$5,002
- − Insurance
- −$1,772
- − Repairs & maintenance
- −$1,918
- − Management
- −$1,918
- − Depreciation
- −$5,673
- Taxable loss
- −$3,229
- Est. tax savings @ 24.0%
- +$775
- After-tax cash flow
- $671/yr
For passive investors: Depreciation is non-cash, so a rental often shows a tax loss while cash-flowing — sheltering income. Rental losses are passive: they offset passive income freely, and up to $25,000/yr can offset ordinary (W-2) income if you actively participate and your MAGI is under $100k (phasing out to $0 by $150k); unused losses carry forward. On sale, claimed depreciation is recaptured at up to 25%, and gains may owe capital-gains tax (a 1031 exchange can defer both). Figures are a year-1 estimate at your 24.0% rate — not tax advice; consult a CPA.
Schools (NCES district)
- District
- Houston ISD
- NCES district ID
- 4823640
- Math proficiency
- 27% ▼ -18.00%
- Reading proficiency
- 35% ▼ -6.00%
- Median HH income
- $46,054
- Composite
- 26.63/100
- National rank
- #7173
- State rank
- #593 of 826 in TX
Livability — Houston
- Score
- 74/100
- State rank
- #184
- US rank
- #4771
Category grades
Schools grade is shown separately in the Schools card above.
Census & demographics
- Census place
- Houston, TX
- County
- Harris County · 4,702,590 people
- City population
- 3,226,434
- Metro
- Houston-The Woodlands-Sugar Land, TX
- Population (ZIP)
- 26,153
- Household income
- $45,574
- Rent vs Own
- Severe rent burden
- 2532.0
Population outlook (Harris County) Hauer SSP2
- Today (2025)
- 5,571,493 people
- By 2030
- 6,089,821 · +9.3%
- By 2040
- 7,142,806 · +28.2%
- By 2050
- 8,185,864 · +46.9%
- By 2075
- 10,574,329 · +89.8%
- By 2100
- 12,109,958 · +117.4%
Race, ethnicity, and origin ACS 2023
- Neighborhood character
- Diverse neighborhood (Simpson 0.55)
- Race & ethnicity
- Black 62% Hispanic / Latino 22% Two or more races 12% White 10% Asian 2%
- Hispanic origin (detail)
- Mexican 15%
- Common ancestry
- Italian 1% Romanian 1% Lithuanian 1%
- Foreign-born
- 11% · Canada
- Languages at home
- 77% English-only · Spanish 19% French/Haitian/Cajun 1% Other Indo-European 1%
Political lean MEDSL · Harris
- 2024 margin
- Lean D (+5.5) · D 52.0% · R 46.4% · Other 1.6%
- 2008→2024 swing
- +3.9pp toward D · 2008: 1.6pp · 2024: 5.5pp
- All cycles
- 2024: D+5.5 2020: D+13.3 2016: D+12.4 2012: D+0.1 2008: D+1.6
Not yet ingested
- Civics
- —
Market trends
- HPI YoY
- ▼ -71.22%
- Current HPI
- 230.2869
- Rent YoY
- ▲ 2.17%
- Metro
- Houston-The Woodlands-Sugar Land, TX
- State GDP YoY
- ▲ 3.95%
- F500 in state
- 110
Industry mix (Fortune 500 HQ in TX)
| Industry | F500 HQs | Revenue |
|---|---|---|
| Energy | 16 | $1,198B |
|
||
| Technology | 5 | $198B |
|
||
| Engineering / Construction | 4 | $72B |
|
||
| Energy Services | 3 | $60B |
|
||
| Utilities | 3 | $41B |
|
||
| Healthcare | 2 | $330B |
|
||
Price history
-45.8% since first listed30 events — show timeline
- 2026-03-11 Relisted — HARMLS
- 2026-03-10 Relisted — HARMLS
- 2026-03-08 Listing Removed — HARMLS
- 2026-03-08 Listing Removed — HARMLS
- 2025-10-03 Price Changed $195,000 HARMLS
- 2025-09-08 Listed $235,000 HARMLS
- 2023-12-31 Listing Removed — HARMLS
- 2023-09-30 Listed $295,000 HARMLS
- 2023-09-23 Listing Removed — HARMLS
- 2023-06-23 Listed $329,000 HARMLS
- 2023-05-31 Listing Removed — HARMLS
- 2023-05-05 Price Changed $329,900 HARMLS
- 2023-03-29 Listing Removed — HARMLS
- 2023-03-29 Listed $339,000 HARMLS
- 2023-03-16 Listed $339,999 HARMLS
- 2023-03-01 Listing Removed — HARMLS
- 2022-12-05 Listed $339,999 HARMLS
- 2022-11-04 Listing Removed — HARMLS
- 2022-10-11 Listed $345,000 HARMLS
- 2022-09-30 Listing Removed — HARMLS
- 2022-09-21 Price Changed $349,999 HARMLS
- 2022-07-05 Price Changed $350,000 HARMLS
- 2022-06-09 Listed $359,900 HARMLS
- 2021-04-22 Sold (Public Records) — Public Records
- 2018-01-23 Sold (Public Records) — Public Records
- 2014-12-24 Sold (Public Records) — Public Records
- 2014-11-24 Sold (Public Records) — Public Records
- 2013-04-22 Sold (Public Records) — Public Records
- 2004-10-20 Sold (Public Records) — Public Records
- 1988-01-02 Sold (Public Records) — Public Records
Property tax history
+7.7%/yrLatest (2025): $5,002 · +1.6% YoY. Source: county tax records.
Cash-flow waterfall
monthlySold comps — $/sqft
last 12 mo · ≤1 miLoading sold comps…