 Duplex
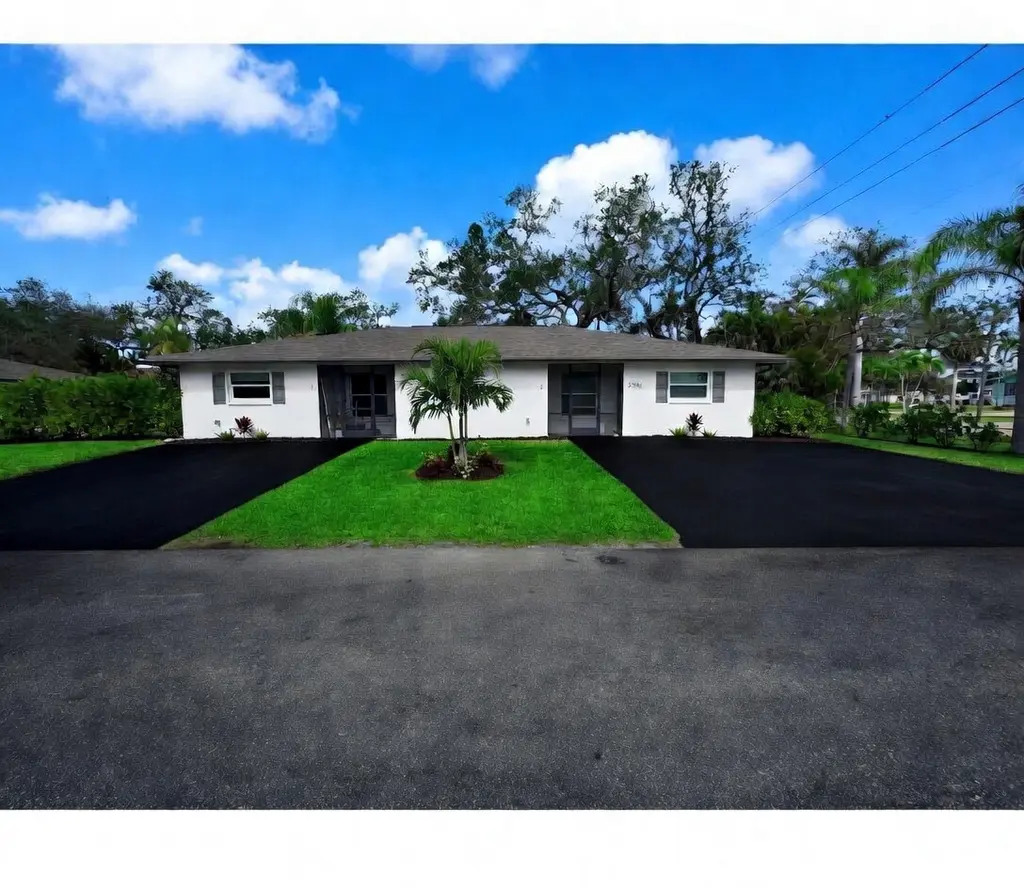
27581 Imperial Shores Blvd · Bonita Springs, FL
Flood risk 10/10 · Severe
- FEMA flood zone
- AE
- Chance of flooding over 30 yrs
- 0.99%
- Est. flood insurance / yr
- $1,737 – $8,500
Fire risk 1/10 · Minimal
- Est. fire insurance / yr
- $947 – $1,759
Heat risk 10/10 · Severe
- Hot days now (above 107°F)
- 7 days/yr
- Hot days in 30 yrs
- 31 days/yr
Wind risk 10/10 · Severe
- Chance of severe wind over 30 yrs
- 99.0%
Air-quality risk 2/10 · Minimal
- Unhealthy air days now
- 1 days/yr
- Unhealthy air days in 30 yrs
- 1 days/yr
Risk factors via First Street. Map © Google.
Why this score? — see what drove the C grade
The composite is a weighted blend of 9 inputs, each scored 0–100. Each bar is that input's sub-score; the figure is the points it added to the 100-point composite (weight × sub-score).
- Cash flow +24.6/30.0
- DSCR +7.9/10.0
- ARV discount +7.6/15.0
- 1% rule +5.3/10.0
- Schools +4.1/10.0
- Livability +3.5/5.0
- Rent growth +3.2/5.0
- Condition / age +2.5/5.0
- Appreciation +0.0/10.0
$499,000
🖨 Deal sheet 📄 Offer letter ✓ Due diligence
Multi-family units
County records classify this as Multi-Family (2-4 Unit). Listing-text estimate: 2 units. confirmed
Listing remarks MLS
Fantastic duplex investment opportunity in Bonita Springs. Highly desired location with a healthy walk to beach, shops and restaurants. (1 mile) Renovated interior, new roof and new hvacs. Private cul-de sac street. Excellent Airbnb opportunities, Verbo etc. Add a pool and create a vacation retreat! No trespassing by appointment only. Active rental property.
Key facts
- New hvacs
- Renovated interior
- New roof
Tags
Property features AI
Finance
- Other:
- Financial info: Gross scheduled income: $22,800; Operating expenses: $3,600; One unit shows actual/pro forma rent of $1,900; Pets allowed; Tenant pays electricity
- HOA & community: No association fee; Non-gated community
Exterior
- Parking:
- Security:
- Utilities: Public water; Public sewer; Cable available
- Home design: Multi-family property with 2 total units; Resale condition; Zoned TFC-2
- Construction: Block, concrete and stucco construction; Shingle roof; Measured lot dimensions: 100 x 97 x 97 x 97
- Exterior features: Sprinkler/irrigation system (municipal irrigation); Privacy wall; Room for pool; Sprinklers automatic; Rectangular lot on a cul-de-sac; Private road frontage
Interior
- Kitchen:
- Bedrooms: Two 2-bedroom units (each unit has 2 bedrooms); Laundry in residence (at least one unit); Screened lanai/porch (one unit)
- Flooring: Concrete
- Bathrooms: Total of 4 full bathrooms (2 full bathrooms per unit)
- Heating & cooling: Central electric heating; Central electric cooling
- Interior features: Impact glass, single hung and sliding windows; Concrete flooring
- Laundry & utility: In-unit laundry
Neighborhood map
What this means for you Summary
Snapshot
- This is a 2 × 2-bed/2.0-bath units multifamily listed at $499k.
Deal economics
- At list price, monthly cash flow is $602 ($7k/yr) — positive. Per door: $301/mo.
- The deal already cash-flows at list — no discount required.
- Meets the 1% rule at list price ($5k rent vs $499k).
- Cap rate 8.8% vs local median 1.7% in Bonita Springs — top-decile yield for the area; either an underpriced asset or a hidden risk that comps aren't pricing in. Stress-test before assuming the spread holds.
Location & tenants
- Location reads 70/100 on livability (#428 in FL) — a middle-class / working-renter tenant base. Strengths: crime A+, housing A+, employment A; Watch: schools C-, cost of living C-, health & safety D.
- Lee (suburban): math 47% / reading 50% proficiency, ranked #42 of 73 in FL (top 58%) — families likely to look elsewhere, expect single-tenant / working-renter base with shorter leases.
- Market conditions: Rents rising (+2.9%/yr); 699 active listings in the ZIP; 37 comparable units currently listed for rent nearby; rentals at typical pace (median 24d on market — plan ~3-4 weeks tenant-placement turnaround); high-income renter base; 15,411 units permitted in Lee County in 2024 (4,686 in 5+ unit buildings).
- At $5,160/mo this rent would consume 47% of the median local household income ($131k/yr) (locally 554% of renters already pay >50% of income on rent) — very limited rent-growth headroom before tenants either downsize or default.
Forward outlook
- Local home prices are declining (-3.0%/yr); year-one equity from $3k of loan paydown is wiped out by about $15k of value loss. Plan a longer hold.
- Lee County population projected at +44% by 2050 — long-run rental-demand tailwind backs the buy-and-hold thesis.
Negotiation context
- Only 3 days on market — expect competitive offers; lowballing is unlikely to land.
- 6 sale attempts since 16y ago with the ask held roughly flat each time — persistent listings suggest the price (not the market) is what's stuck; bring a comps-based counter.
Risks & watch-outs
- Watch-outs: flood insurance adds $427/mo.
- Climate carrying-cost: in FEMA flood zone AE (mandatory federal flood insurance); severe wind risk, 99% chance of damaging wind over 30y; extreme-heat days projected 7→31/yr by 2055 (HVAC capex compounding) — expect insurance premiums to compound above CPI over the hold.
Questions for the listing agent
- Can we see the unit-by-unit rent roll, current vacancy, and any below-market leases? What's the average tenancy length?
- What capital expenditures (roof, boiler, parking lot, exteriors) have been made in the last 5 years, and what's planned in the next 2?
- Built in 1979 — when were the roof, HVAC, electrical panel, plumbing, and water heater last replaced?
- What's the actual annual flood-insurance premium (NFIP or private), and is the property in a SFHA with mandatory coverage?
- Is there a deadline driving the sale (1031 exchange, divorce, estate, relocation)? That informs how much negotiation room exists.
- What's the average days-on-market for RENTAL listings here right now (not sales)? A rising rental-DOM trend means longer vacancies and softer asking-rent achievability than the comps imply.
- What's the recent tenant-quality profile in this submarket — average credit score on applications, eviction rate, late-payment / NSF rate, and stable-employment percentage? A property-management company in the area should have these aggregated.
- How much new apartment / multifamily construction is in the pipeline within 1–3 miles? Heavy new supply (>2% of stock underway) typically softens rents 12–24 months out; light construction supports rent growth.
Investment metrics
- 1% rule
- 1.03% ✓
- Cap rate
- 8.77%
- Cash-on-cash
- 8.83%
- DSCR
- 1.39
- GRM
- 8.1
CMA / ARV
- ARV (on-the-fly)
- $500,612
- Comps found
- 1
Show comp detail 1 sale within ~0.75 mi
| Address | Dist | Beds/Ba | Sqft | Sold | Price | $/sf | Match |
|---|---|---|---|---|---|---|---|
| 27632 Imperial Shores Blvd #634 | 0.17mi | 4/4.0 | 2,160 (+15%) | 16mo | $575,000 | $266 | 54 |
Match score weights: distance 35% · size 25% · config 20% · recency 20%. Top-matched comps best support the ARV.
Projected returns pro-forma
-3.0% appreciation · 2.85% rent growth · sell at horizon
- IRR
- -8.4%
- Equity multiple
- 0.69×
- Total profit
- $-43,205
- Equity at exit
- $74,403
- IRR
- 0.9%
- Equity multiple
- 1.06×
- Total profit
- $8,945
- Equity at exit
- $43,144
Cash invested: $139,720 (down + closing). Projections, not guarantees.
Landlord ↔ Tenant lean methodology
- Overall (STATE)
- 87 Strongly Landlord-Friendly
- State Florida
- 87 Strongly Landlord-Friendly · R+3
- County
- — inherits STATE
- City
- — inherits STATE
ZIP-level market 34134
- Rents YoY
- 2.9%
- Active inventory
- 699
- Price-to-rent
- 16.1×
Monthly cashflow live
- Estimated rent
- $5,160 high interval (Pro) →
- Mortgage (P&I)
- −$2,617
- Tax from tax record
- −$223 /mo · $2,678/yr
- Insurance
- −$208
- Flood insurance flood zone
- −$427 /mo · $5,118/yr
- HOA
- −$0
- Vacancy / Maint / Mgmt
- −$1,084
- Net cashflow
- $602
Break-even live
2-unit breakdown (identical units grouped — click to expand)
| Units | Beds | Baths | Est. rent |
|---|---|---|---|
| 2× units | 2 | 2 | $5,160 |
| #1 | 2 | 2 | $2,580 |
| #2 | 2 | 2 | $2,580 |
| Total (2 units) | $5,160 | ||
UW: 25.0% down · 7.5% · 30yr · 1.5% tax · 5.0% vac · 8.0% maint · 8.0% mgmt
Financing live
Cash to close
- Down payment
- $124,750
- Closing costs
- $14,970
- Reserves months
- —
- Total cash needed
- —
Loan-product check · same deal, 3 products live
Conventional
25% down · 7.5% · 30yr
- Down + closing
- —
- Monthly P&I
- —
- Monthly cashflow
- —
- DSCR
- —
- Eligible?
- —
Personal DTI + credit; lowest rate.
DSCR
20% down · 8.5% · 30yr
- Down + closing
- —
- Monthly P&I
- —
- Monthly cashflow
- —
- DSCR
- —
- Eligible?
- —
No personal income docs; deal must DSCR.
Hard money
10% down · 12.0% · 12mo
- Down + closing
- —
- Monthly P&I
- —
- Monthly cashflow
- —
- DSCR
- —
- Eligible?
- —
Short-term bridge; refi at stabilization.
Rent comps 37 comps
| Address | Beds | Baths | Sqft | Rent | $/sqft | DOM | Units | Dist |
|---|---|---|---|---|---|---|---|---|
| 27585 Imperial Shores Blvd Bonita Springs, FL | 3.0 | 3.0 | 1576 | $8,000 | $5.08 | 23d | 1 | 0.02mi |
| 27579 Big Bend Rd Bonita Springs, FL | 3.0 | 2.0 | 1512 | $2,700 | $1.79 | 23d | 1 | 0.15mi |
| 4879 Esplanade St Bonita Springs, FL | 3.0 | 2.5 | 1888 | $16,000 | $8.47 | 11d | 1 | 0.27mi |
| 4860 Gary Rd Unit 4 Bonita Springs, FL | 3.0 | 2.0 | 1875 | $2,900 | $1.55 | 23d | 1 | 0.32mi |
| 4412 Vanda Dr Bonita Springs, FL | 3.0 | 2.0 | 1800 | $2,800 | $1.56 | 23d | 1 | 0.32mi |
| 27594 Shore Dr Bonita Springs, FL | 3.0 | 2.0 | 1426 | $5,500 | $3.86 | 23d | 1 | 0.52mi |
| 4895 Bonita Beach Rd #208 Bonita Springs, FL | 3.0 | 2.0 | 1288 | $3,250 | $2.52 | 23d | 1 | 0.54mi |
| 4975 Bonita Beach Rd #106 Bonita Springs, FL | 3.0 | 2.0 | 1875 | $11,000 | $5.87 | 23d | 1 | 0.61mi |
| 75 3rd St Bonita Springs, FL | 3.0 | 3.0 | 1630 | $8,900 | $5.46 | 23d | 1 | 0.63mi |
| 27921 Bonita Village Blvd Bonita Springs, FL | 2.0–3.0 | 2.0 | 1429 | $3,745 | $2.62 | 23d | 3 | 0.65mi |
| 11 2nd St Bonita Springs, FL | 3.0 | 2.0 | 1595 | $9,500 | $5.96 | 23d | 1 | 0.71mi |
| 27080 Lake Harbor Ct #201 Bonita Springs, FL | 3.0 | 2.0 | 1764 | $7,500 | $4.25 | 23d | 1 | 0.72mi |
| 27080 Lake Harbor Ct #202 Bonita Springs, FL | 3.0 | 2.0 | 1654 | $7,200 | $4.35 | 23d | 1 | 0.72mi |
| 211 6th St Bonita Springs, FL | 3.0 | 2.0 | 2000 | $11,900 | $5.95 | 23d | 1 | 0.74mi |
| 60 4th St Bonita Springs, FL | 3.0 | 2.0 | 1860 | $11,400 | $6.13 | 23d | 1 | 0.75mi |
| 4140 Bayhead Dr #106 Bonita Springs, FL | 3.0 | 2.0 | 1583 | $8,200 | $5.18 | 23d | 1 | 0.88mi |
| 26968 Montego Pointe Ct #201 Bonita Springs, FL | 3.0 | 2.0 | 2008 | $4,100 | $2.04 | 23d | 1 | 0.89mi |
| 26926 Montego Pointe Ct #201 Bonita Springs, FL | 3.0 | 2.0 | 2008 | $9,500 | $4.73 | 23d | 1 | 0.90mi |
| 27190 Oakwood Lake Dr #102 Bonita Springs, FL | 3.0 | 2.0 | 1603 | $7,500 | $4.68 | 23d | 1 | 0.93mi |
| 999 E Valley Dr Unit 1073522P Bonita Springs, FL | 3.0 | 2.5 | 1668 | $9,929 | $5.95 | 21d | 1 | 0.94mi |
| 27038 Oakwood Lake Dr Bonita Springs, FL | 3.0 | 3.0 | 1818 | $8,500 | $4.68 | 23d | 1 | 1.00mi |
| 26850 Wedgewood Dr #202 Bonita Springs, FL | 3.0 | 3.0 | 1781 | $8,500 | $4.77 | 23d | 1 | 1.03mi |
| 26881 Wedgewood Dr #201 Bonita Springs, FL | 3.0 | 2.0 | 1640 | $8,000 | $4.88 | 23d | 1 | 1.03mi |
| 27121 Oakwood Lake Dr Bonita Springs, FL | 3.0 | 2.5 | 1892 | $8,900 | $4.70 | 3d | 1 | 1.04mi |
| 27119 Oakwood Lake Dr Bonita Springs, FL | 3.0 | 2.5 | 1812 | $7,500 | $4.14 | 23d | 1 | 1.04mi |
| 27113 Oakwood Lake Dr Bonita Springs, FL | 3.0 | 2.5 | 1879 | $7,500 | $3.99 | 23d | 1 | 1.06mi |
| 3620 Bailes St Bonita Springs, FL | 3.0 | 3.0 | 1992 | $12,000 | $6.02 | 23d | 1 | 1.14mi |
| 5731 Marimin Dr Unit 1073514P Bonita Springs, FL | 3.0 | 2.0 | 2249 | $5,637 | $2.51 | 2d | 1 | 1.21mi |
| 28450 Winthrop Cir Unit 1546014P Bonita Springs, FL | 3.0 | 2.0 | 1894 | $7,804 | $4.12 | 13d | 1 | 1.23mi |
| 3561 Imperial Crossing Dr Bonita Springs, FL | 1.0–3.0 | 1.0–2.0 | 1122 | $3,650 | $3.25 | 2d | 19 | 1.27mi |
| 28712 Carmel Way Bonita Springs, FL | 3.0 | 2.5 | 1626 | $9,250 | $5.69 | 23d | 1 | 1.30mi |
| 28567 Clinton Ln Bonita Springs, FL | 3.0 | 3.5 | 2285 | $13,000 | $5.69 | 13d | 1 | 1.40mi |
| 28567 Clinton Ln Bonita Springs, FL | 3.0 | 3.5 | 2285 | $13,000 | $5.69 | 19d | 1 | 1.40mi |
| 28327 Hidden Lake Dr Bonita Springs, FL | 3.0 | 2.0 | 1567 | $8,950 | $5.71 | 23d | 1 | 1.42mi |
| 255 Barefoot Beach Blvd #4 Bonita Springs, FL | 3.0 | 3.5 | 2003 | $25,000 | $12.48 | 13d | 1 | 1.43mi |
| 255 Barefoot Beach Blvd Bonita Springs, FL | 2.0–3.0 | 2.0–3.5 | 1864 | $25,000 | $13.41 | 13d | 2 | 1.43mi |
| 28211 Winthrop Cir Bonita Springs, FL | 3.0 | 2.0 | 1918 | $10,500 | $5.47 | 23d | 1 | 1.45mi |
Listing history 6 events
-
2026-06-13statusdays on market $499,000 Pending 3 DOM
-
2026-06-10remarks 372-char remark
-
2026-06-10days on market $499,000 Active 2 DOM
-
2026-06-08days on market $499,000 Active 1 DOM
-
2026-06-07remarks 361-char remark
Show marketing remark (361 chars)
Fantastic duplex investment opportunity in Bonita Springs. Highly desired location with a healthy walk to beach, shops and restaurants. (1 mile) Renovated interior, new roof and new hvacs. Private cul-de sac street. Excellent Airbnb opportunities, Verbo etc. Add a pool and create a vacation retreat! No trespassing by appointment only. Active rental property.
-
2026-06-07$499,000 Active 30 DOM
Show marketing remark (361 chars)
Fantastic duplex investment opportunity in Bonita Springs. Highly desired location with a healthy walk to beach, shops and restaurants. (1 mile) Renovated interior, new roof and new hvacs. Private cul-de sac street. Excellent Airbnb opportunities, Verbo etc. Add a pool and create a vacation retreat! No trespassing by appointment only. Active rental property.
ⓘ Source: listings_history table (triggers on properties + properties_extension) + one-shot
backfill from property_details.listing_events for pre-trigger history.
Tax reassessment forecast FL · Resets to sale price
- Current annual tax
- $2,678 · $223/mo
- Projected year-2 tax
- $4,142 · $345/mo
- Expected delta
- +$1,463/yr (+$122/mo · 54.6%)
ⓘ Screening estimate from a state-policy table — verify with the county assessor before closing.
Climate risk First Street
- Flood 10/10 Extreme FEMA zone AE · 99% chance over 30 yrs
- Wildfire 1/10 Low
- Heat 10/10 Extreme 7 d/yr ≥107°F today · 31 d/yr by 30 yrs out
- Wind 10/10 Extreme 99% chance of damaging wind over 30 yrs
- Air quality 2/10 Low 1 unhealthy d/yr today · 1 by 30 yrs out
Nearby sold comps map
Loading sold comps map…
Walkable amenities ~0.75 mi
Loading nearby amenities…
Taxation est. · year 1
- Rental income
- $61,920
- − Mortgage interest
- −$27,952
- − Property taxes
- −$2,678
- − Insurance
- −$7,614
- − Repairs & maintenance
- −$4,954
- − Management
- −$4,954
- − Depreciation
- −$14,516
- Taxable loss
- −$747
- Est. tax savings @ 24.0%
- +$179
- After-tax cash flow
- $7,403/yr
For passive investors: Depreciation is non-cash, so a rental often shows a tax loss while cash-flowing — sheltering income. Rental losses are passive: they offset passive income freely, and up to $25,000/yr can offset ordinary (W-2) income if you actively participate and your MAGI is under $100k (phasing out to $0 by $150k); unused losses carry forward. On sale, claimed depreciation is recaptured at up to 25%, and gains may owe capital-gains tax (a 1031 exchange can defer both). Figures are a year-1 estimate at your 24.0% rate — not tax advice; consult a CPA.
Schools (NCES district)
- District
- Lee
- NCES district ID
- 1201080
- Math proficiency
- 47% ▼ -11.00%
- Reading proficiency
- 50% ▼ -4.00%
- Median HH income
- $49,518
- Composite
- 41.49/100
- National rank
- #3458
- State rank
- #42 of 73 in FL
Livability — Bonita Springs
- Score
- 70/100
- State rank
- #428
- US rank
- #7576
Category grades
Schools grade is shown separately in the Schools card above.
Census & demographics
- Census place
- Bonita Springs, FL
- County
- Lee County · 788,662 people
- City population
- 64,727
- Metro
- Cape Coral-Fort Myers, FL
- Population (ZIP)
- 16,475
- Household income
- $130,719
- Rent vs Own
- Severe rent burden
- 554.0
Population outlook (Lee County) Hauer SSP2
- Today (2025)
- 871,946 people
- By 2030
- 955,468 · +9.6%
- By 2040
- 1,113,587 · +27.7%
- By 2050
- 1,256,891 · +44.1%
- By 2075
- 1,560,270 · +78.9%
- By 2100
- 1,726,848 · +98.0%
Race, ethnicity, and origin ACS 2023
- Neighborhood character
- Predominantly White (91%)
- Race & ethnicity
- White 91% Hispanic / Latino 5% Two or more races 3% Asian 1%
- Common ancestry
- Slovak 5% Romanian 4% Serbian 2%
- Foreign-born
- 10% · Canada, Jamaica
- Languages at home
- 91% English-only · Spanish 4% German/W. Germanic 1% Other Indo-European 1%
Political lean MEDSL · Lee
- 2024 margin
- Strong R (+28.4) · D 35.5% · R 63.9%
- 2008→2024 swing
- -18.0pp toward R · 2008: -10.4pp · 2024: -28.4pp
- All cycles
- 2024: R+28.4 2020: R+19.2 2016: R+20.4 2012: R+16.6 2008: R+10.4
Not yet ingested
- Civics
- —
Market trends
- HPI YoY
- ▼ -236.48%
- Current HPI
- 237.4416
- Rent YoY
- ▲ 2.85%
- Metro
- Cape Coral-Fort Myers, FL
- State GDP YoY
- ▲ 3.28%
- F500 in state
- 36
Industry mix (Fortune 500 HQ in FL)
| Industry | F500 HQs | Revenue |
|---|---|---|
| Industrial Technology | 2 | $29B |
|
||
| Insurance | 2 | $17B |
|
||
| Retail | 1 | $60B |
|
||
| Technology Distribution | 1 | $58B |
|
||
| Homebuilding | 1 | $35B |
|
||
| Technology Manufacturing | 1 | $35B |
|
||
Price history
+454.4% since first listed14 events — show timeline
- 2026-06-08 Listed $499,000 FORTMLS
- 2026-06-07 Relisted — FSBO.com
- 2026-05-14 Delisted — FSBO.com
- 2026-04-14 Listed $499,000 FSBO.com
- 2021-10-15 Sold (MLS) $750,000 FORTMLS
- 2021-07-16 Pending — FORTMLS
- 2021-03-09 Relisted — FORTMLS
- 2021-03-08 Pending — FORTMLS
- 2021-02-01 Listed $799,000 FORTMLS
- 2012-11-05 Sold (Public Records) $180,000 Public Records
- 2011-03-31 Listing Removed — FORTMLS
- 2010-02-11 Listed $265,000 FORTMLS
- 2002-07-26 Sold (Public Records) $178,500 Public Records
- 1986-10-01 Sold (Public Records) $90,000 Public Records
Property tax history
+1.1%/yrLatest (2025): $2,678 · -51.2% YoY. Source: county tax records.
Cash-flow waterfall
monthlySold comps — $/sqft
last 12 mo · ≤1 miLoading sold comps…