 Multi-family
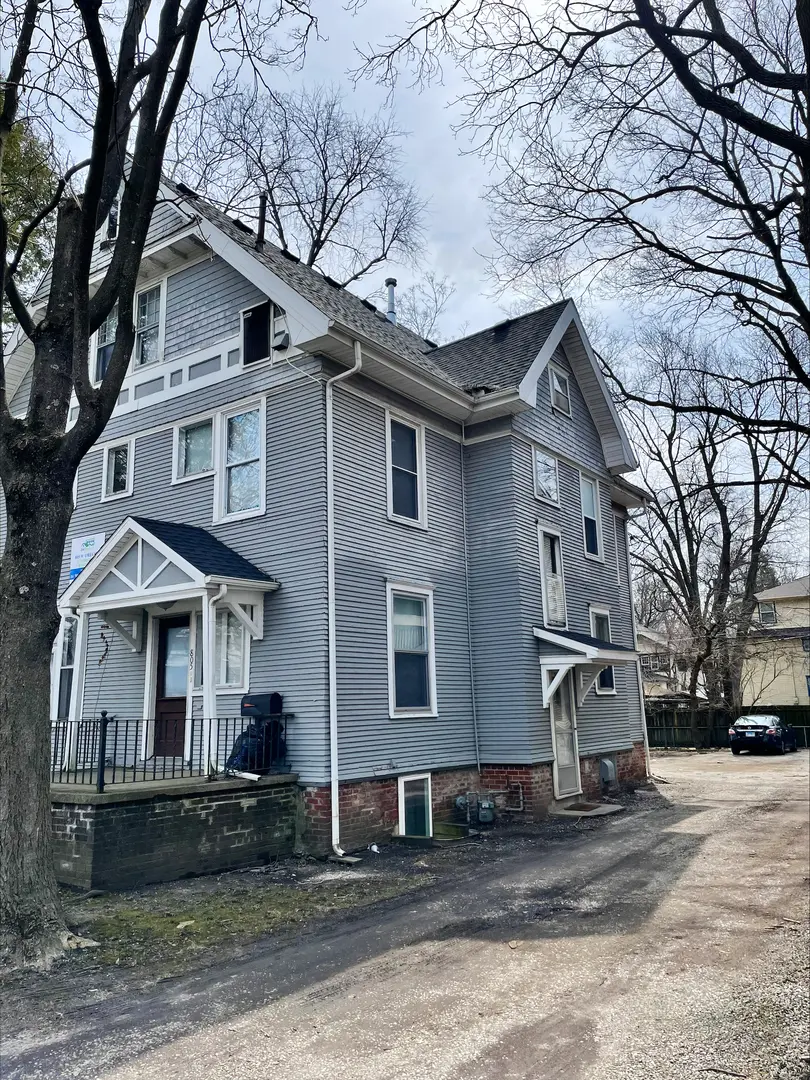
805 W Oregon St · Urbana, IL
Flood risk 1/10 · Minimal
- FEMA flood zone
- X (unshaded)
- Chance of flooding over 30 yrs
- 0.0%
- Est. flood insurance / yr
- $473 – $860
Fire risk 1/10 · Minimal
- Est. fire insurance / yr
- $804 – $1,492
Heat risk 3/10 · Minor
- Hot days now (above 103°F)
- 7 days/yr
- Hot days in 30 yrs
- 19 days/yr
Wind risk 2/10 · Minimal
- Chance of severe wind over 30 yrs
- 1.0%
Air-quality risk 2/10 · Minimal
- Unhealthy air days now
- 1 days/yr
- Unhealthy air days in 30 yrs
- 2 days/yr
Risk factors via First Street. Map © Google.
Why this score? — see what drove the B- grade
The composite is a weighted blend of 9 inputs, each scored 0–100. Each bar is that input's sub-score; the figure is the points it added to the 100-point composite (weight × sub-score).
- Cash flow +30.0/30.0
- 1% rule +10.0/10.0
- DSCR +10.0/10.0
- ARV discount +7.5/15.0
- Livability +4.0/5.0
- Rent growth +3.6/5.0
- Condition / age +2.5/5.0
- Schools +1.0/10.0
- Appreciation +0.0/10.0
$349,900
🖨 Deal sheet 📄 Offer letter ✓ Due diligence
Multi-family units
County records classify this as Multi-Family (5+ Unit). Listing-text estimate: 1 unit. estimate disagrees with records
5+ unit building — per-unit beds/baths from public records are typically unavailable; the breakdown below (if shown) is an estimate from the listing text.
Listing remarks MLS
BED,DESK,AND DRESSER IN EACH ROOM. LOCATED ONE BLOCK FROM U OF I CAMPUS;10 ROOMS, 4 FULL BATHS, 3 KITCHENS,AND COMMON ROOM;CENTRAL AIR THRU OUT; ZONED R-7;AN INVESTORS DREAM.
Key facts
- Outstanding location
- Near illini grove
- Heart of campus
Tags
Property features AI
Finance
- Other: Property located on 805 W Oregon St, Urbana, IL; Directions: Southside of West Oregon near South Lincoln and close to campus
- Financial info: Total monthly income approximately $3,685; Gross income approximately $43,260; Monthly income per 1-bedroom unit roughly $500–$550; Gross Rent Multiplier about 7.91
Exterior
- Home design: Multi-family building (5+ units)
- Construction: Built before 1978
- Exterior features: Lot dimensions: 9032
Interior
- Bedrooms: Ten 1-bedroom units
- Heating & cooling: Radiators
- Interior features: Radiator heating
Neighborhood map
What this means for you Summary
Snapshot
- This is a 10-bed/?-bath multifamily listed at $350k.
Deal economics
- At list price, monthly cash flow is $9k ($104k/yr) — positive.
- The deal already cash-flows at list — no discount required.
- Meets the 1% rule at list price ($14k rent vs $350k).
- Recommended offer: $345k (1.5% below list) — sets the bar for market timing.
- Cap rate 36.0% vs local median 3.6% in Urbana — top-decile yield for the area; either an underpriced asset or a hidden risk that comps aren't pricing in. Stress-test before assuming the spread holds.
Location & tenants
- Location reads 80/100 on livability (#110 in IL, #1,793 nationally) — a professional / high-income tenant draw. Strengths: amenities A+, commute A+, cost of living A+; Watch: employment D, schools D-, crime F.
- Urbana SD 116 (urban): math 11% / reading 13% proficiency, ranked #568 of 620 in IL (top 92%) — low school quality limits family demand, transient renter base, plan for 1-2y turnover; 64% free/reduced lunch — lower-income household profile, screen leases tightly.
- Market conditions: Rents rising fast (+4.4%/yr); 63 active listings in the ZIP; lower-income renter base — watch delinquency; 573 units permitted in Champaign County in 2024 (359 in 5+ unit buildings).
- At $14,033/mo this rent would consume 465% of the median local household income ($36k/yr) (locally 2719% of renters already pay >50% of income on rent) — very limited rent-growth headroom before tenants either downsize or default.
Forward outlook
- Local home prices are declining (-3.0%/yr); year-one equity from $2k of loan paydown is wiped out by about $10k of value loss. Plan a longer hold.
- Champaign County population projected at +15% by 2050 — modest demand growth; plan on rents tracking national, not racing it.
- At projected returns (-3.0% appreciation + 4.4% rent growth), your $98k cash investment doubles in ~2 years — after that, you're playing with house money.
Negotiation context
- It's been on market 22 days — a 2% lower offer ($345k) is reasonable based on typical stale-listing flexibility.
- 3 sale attempts since 24y ago with the ask held roughly flat each time — persistent listings suggest the price (not the market) is what's stuck; bring a comps-based counter.
Risks & watch-outs
- Watch-outs: built in 1920 — expect roof / HVAC / electrical / plumbing capex.
Questions for the listing agent
- Built in 1920 — when were the roof, HVAC, electrical panel, plumbing, and water heater last replaced?
- Is there a deadline driving the sale (1031 exchange, divorce, estate, relocation)? That informs how much negotiation room exists.
- Schools are D-rated, which usually means shorter tenancies and higher turnover. Who's the typical renter profile here, and what's been the actual vacancy rate?
- Crime grade is F in this area — have there been break-ins, vandalism, or insurance claims at this property in the last 3 years? What carrier currently insures it and at what premium?
- What's the average days-on-market for RENTAL listings here right now (not sales)? A rising rental-DOM trend means longer vacancies and softer asking-rent achievability than the comps imply.
- What's the recent tenant-quality profile in this submarket — average credit score on applications, eviction rate, late-payment / NSF rate, and stable-employment percentage? A property-management company in the area should have these aggregated.
- How much new apartment / multifamily construction is in the pipeline within 1–3 miles? Heavy new supply (>2% of stock underway) typically softens rents 12–24 months out; light construction supports rent growth.
Investment metrics
- 1% rule
- 4.01% ✓
- Cap rate
- 36.02%
- Cash-on-cash
- 106.17%
- DSCR
- 5.72
- GRM
- 2.1
CMA / ARV
No comps found within radius.
Show comp detail 2 sales within ~0.75 mi
| Address | Dist | Beds/Ba | Sqft | Sold | Price | $/sf | Match |
|---|---|---|---|---|---|---|---|
| 802 W Illinois St | 0.15mi | 11/10.0 (+1) | — | 6mo | $530,000 | — | 71 |
| 1008 S Busey Ave | 0.22mi | 11/6.0 (+1) | — | 11mo | $457,500 | — | 63 |
Match score weights: distance 35% · size 25% · config 20% · recency 20%. Top-matched comps best support the ARV.
Projected returns pro-forma
-3.0% appreciation · 4.4% rent growth · sell at horizon
- IRR
- —
- Equity multiple
- 6.26×
- Total profit
- $515,624
- Equity at exit
- $52,171
- IRR
- —
- Equity multiple
- 13.71×
- Total profit
- $1,245,358
- Equity at exit
- $30,253
Cash invested: $97,972 (down + closing). Projections, not guarantees.
Landlord ↔ Tenant lean methodology
- Overall (STATE)
- 43 Moderately Tenant-Leaning
- State Illinois
- 43 Moderately Tenant-Leaning · D+7
- County
- — inherits STATE
- City
- — inherits STATE
ZIP-level market 61801
- Home prices YoY
- -27.4%
- Rents YoY
- 4.4%
- Active inventory
- 63
- Price-to-rent
- 24.9×
Monthly cashflow live
- Estimated rent
- $14,033 high interval (Pro) →
- Mortgage (P&I)
- −$1,835
- Tax est. 1.5%
- −$437 /mo · $5,248/yr
- Insurance
- −$146
- HOA
- −$0
- Vacancy / Maint / Mgmt
- −$2,947
- Net cashflow
- $8,668
Break-even live
12-unit breakdown (identical units grouped — click to expand)
| Units | Beds | Baths | Est. rent |
|---|---|---|---|
| 12× units | 1 | 1 | $14,028 |
| #1 | 1 | 1 | $1,169 |
| #2 | 1 | 1 | $1,169 |
| #3 | 1 | 1 | $1,169 |
| #4 | 1 | 1 | $1,169 |
| #5 | 1 | 1 | $1,169 |
| #6 | 1 | 1 | $1,169 |
| #7 | 1 | 1 | $1,169 |
| #8 | 1 | 1 | $1,169 |
| #9 | 1 | 1 | $1,169 |
| #10 | 1 | 1 | $1,169 |
| #11 | 1 | 1 | $1,169 |
| #12 | 1 | 1 | $1,169 |
| Total (12 units) | $14,033 | ||
UW: 25.0% down · 7.5% · 30yr · 1.5% tax · 5.0% vac · 8.0% maint · 8.0% mgmt
Financing live
Cash to close
- Down payment
- $87,475
- Closing costs
- $10,497
- Reserves months
- —
- Total cash needed
- —
Loan-product check · same deal, 3 products live
Conventional
25% down · 7.5% · 30yr
- Down + closing
- —
- Monthly P&I
- —
- Monthly cashflow
- —
- DSCR
- —
- Eligible?
- —
Personal DTI + credit; lowest rate.
DSCR
20% down · 8.5% · 30yr
- Down + closing
- —
- Monthly P&I
- —
- Monthly cashflow
- —
- DSCR
- —
- Eligible?
- —
No personal income docs; deal must DSCR.
Hard money
10% down · 12.0% · 12mo
- Down + closing
- —
- Monthly P&I
- —
- Monthly cashflow
- —
- DSCR
- —
- Eligible?
- —
Short-term bridge; refi at stabilization.
Listing history 22 events
-
2026-06-18days on market $349,900 Active 22 DOM
-
2026-06-17days on market $349,900 Active 21 DOM
-
2026-06-16days on market $349,900 Active 20 DOM
-
2026-06-15days on market $349,900 Active 19 DOM
-
2026-06-14days on market $349,900 Active 17 DOM
-
2026-06-13days on market $349,900 Active 16 DOM
-
2026-06-10days on market $349,900 Active 14 DOM
-
2026-06-09days on market $349,900 Active 13 DOM
-
2026-06-08days on market $349,900 Active 12 DOM
-
2026-06-07days on market $349,900 Active 11 DOM
-
2026-06-03days on market $349,900 Active 7 DOM
-
2026-06-02days on market $349,900 Active 6 DOM
-
2026-06-01days on market $349,900 Active 5 DOM
-
2026-05-31days on market $349,900 Active 4 DOM
-
2026-05-30days on market $349,900 Active 3 DOM
-
2026-05-27$349,900 Active
-
2007-05-24soldstatus $320,000 174-char remark
Show marketing remark (174 chars)
BED,DESK,AND DRESSER IN EACH ROOM. LOCATED ONE BLOCK FROM U OF I CAMPUS;10 ROOMS, 4 FULL BATHS, 3 KITCHENS,AND COMMON ROOM;CENTRAL AIR THRU OUT; ZONED R-7;AN INVESTORS DREAM.
-
2006-12-13historical 174-char remark
Show marketing remark (174 chars)
BED,DESK,AND DRESSER IN EACH ROOM. LOCATED ONE BLOCK FROM U OF I CAMPUS;10 ROOMS, 4 FULL BATHS, 3 KITCHENS,AND COMMON ROOM;CENTRAL AIR THRU OUT; ZONED R-7;AN INVESTORS DREAM.
-
2006-10-12$349,900 174-char remark
Show marketing remark (174 chars)
BED,DESK,AND DRESSER IN EACH ROOM. LOCATED ONE BLOCK FROM U OF I CAMPUS;10 ROOMS, 4 FULL BATHS, 3 KITCHENS,AND COMMON ROOM;CENTRAL AIR THRU OUT; ZONED R-7;AN INVESTORS DREAM.
-
2002-07-31soldstatus $179,900 254-char remark
Show marketing remark (254 chars)
12 UNIT ROOMING HOSUE VERY CLOSE TO EVERYTHING. 12 FURNISHED ROOMS, 4 FULL BATHS AND 3 KITCHENS WITH COMMON AREA FOR GATHERINGS AND SOCIALIZING. WINDOW AC'S ON 3RD FLOOR, OTHERWISE CENTRAL AIR. MUST CALL 417-0565 (BOB) FOR APPOINTMENT AND 24-HOUR NOTICE.
-
2002-06-28historical 254-char remark
Show marketing remark (254 chars)
12 UNIT ROOMING HOSUE VERY CLOSE TO EVERYTHING. 12 FURNISHED ROOMS, 4 FULL BATHS AND 3 KITCHENS WITH COMMON AREA FOR GATHERINGS AND SOCIALIZING. WINDOW AC'S ON 3RD FLOOR, OTHERWISE CENTRAL AIR. MUST CALL 417-0565 (BOB) FOR APPOINTMENT AND 24-HOUR NOTICE.
-
2002-06-23$179,900 254-char remark
Show marketing remark (254 chars)
12 UNIT ROOMING HOSUE VERY CLOSE TO EVERYTHING. 12 FURNISHED ROOMS, 4 FULL BATHS AND 3 KITCHENS WITH COMMON AREA FOR GATHERINGS AND SOCIALIZING. WINDOW AC'S ON 3RD FLOOR, OTHERWISE CENTRAL AIR. MUST CALL 417-0565 (BOB) FOR APPOINTMENT AND 24-HOUR NOTICE.
ⓘ Source: listings_history table (triggers on properties + properties_extension) + one-shot
backfill from property_details.listing_events for pre-trigger history.
Climate risk First Street
- Flood 1/10 Low FEMA zone X (unshaded) · 0% chance over 30 yrs
- Wildfire 1/10 Low
- Heat 3/10 Moderate 7 d/yr ≥103°F today · 19 d/yr by 30 yrs out
- Wind 2/10 Low 100% chance of damaging wind over 30 yrs
- Air quality 2/10 Low 1 unhealthy d/yr today · 2 by 30 yrs out
Nearby sold comps map
Loading sold comps map…
Walkable amenities ~0.75 mi
Loading nearby amenities…
Taxation est. · year 1
- Rental income
- $168,396
- − Mortgage interest
- −$19,600
- − Property taxes
- −$5,248
- − Insurance
- −$1,750
- − Repairs & maintenance
- −$13,472
- − Management
- −$13,472
- − Depreciation
- −$10,179
- Taxable income
- $104,676
- Est. tax owed @ 24.0%
- −$25,122
- After-tax cash flow
- $78,894/yr
For passive investors: Depreciation is non-cash, so a rental often shows a tax loss while cash-flowing — sheltering income. Rental losses are passive: they offset passive income freely, and up to $25,000/yr can offset ordinary (W-2) income if you actively participate and your MAGI is under $100k (phasing out to $0 by $150k); unused losses carry forward. On sale, claimed depreciation is recaptured at up to 25%, and gains may owe capital-gains tax (a 1031 exchange can defer both). Figures are a year-1 estimate at your 24.0% rate — not tax advice; consult a CPA.
Schools (NCES district)
- District
- Urbana SD 116
- NCES district ID
- 1739960
- Math proficiency
- 11% ▼ -5.00%
- Reading proficiency
- 13% ▼ -7.00%
- Median HH income
- $33,678
- Composite
- 9.72/100
- National rank
- #9830
- State rank
- #568 of 620 in IL
Livability — Urbana
- Score
- 80/100
- State rank
- #110
- US rank
- #1793
Category grades
Schools grade is shown separately in the Schools card above.
Census & demographics
- Census place
- Urbana, IL
- County
- Champaign County · 182,148 people
- City population
- 48,184
- Metro
- Champaign-Urbana, IL
- Population (ZIP)
- 27,891
- Household income
- $36,180
- Rent vs Own
- Severe rent burden
- 2719.0
Population outlook (Champaign County) Hauer SSP2
- Today (2025)
- 223,848 people
- By 2030
- 231,416 · +3.4%
- By 2040
- 244,321 · +9.1%
- By 2050
- 256,432 · +14.6%
- By 2075
- 285,823 · +27.7%
- By 2100
- 296,406 · +32.4%
Race, ethnicity, and origin ACS 2023
- Neighborhood character
- Diverse neighborhood (Simpson 0.65)
- Race & ethnicity
- White 54% Asian 17% Black 16% Hispanic / Latino 9% Two or more races 8%
- Hispanic origin (detail)
- Mexican 4% Puerto Rican 2%
- Common ancestry
- Romanian 3% Lithuanian 2% Iranian 1%
- Foreign-born
- 20% · China, Canada, Jamaica
- Languages at home
- 74% English-only · Chinese 8% Spanish 6% Other Indo-European 4%
Political lean MEDSL · Champaign
- 2024 margin
- Strong D (+24.1) · D 61.3% · R 37.2% · Other 1.5%
- 2008→2024 swing
- +6.6pp toward D · 2008: 17.5pp · 2024: 24.1pp
- All cycles
- 2024: D+24.1 2020: D+22.8 2016: D+18.4 2012: D+6.8 2008: D+17.5
Not yet ingested
- Civics
- —
Market trends
- HPI YoY
- ▼ -83.21%
- Current HPI
- 220.7438
- Rent YoY
- ▲ 4.40%
- Metro
- Champaign-Urbana, IL
- State GDP YoY
- ▲ 1.59%
- F500 in state
- 60
Industry mix (Fortune 500 HQ in IL)
| Industry | F500 HQs | Revenue |
|---|---|---|
| Insurance | 4 | $201B |
|
||
| Consumer Goods | 4 | $87B |
|
||
| Industrial Machinery | 3 | $64B |
|
||
| Healthcare | 2 | $55B |
|
||
| Retail / Pharmacy | 1 | $148B |
|
||
| Agriculture / Food | 1 | $86B |
|
||
Price history
+94.5% since first listed7 events — show timeline
- 2026-05-27 Listed $349,900 MRED as Distributed by MLS Grid
- 2007-05-24 Sold (MLS) $320,000 MRED as Distributed by MLS Grid
- 2006-12-13 Listing Removed — MRED as Distributed by MLS Grid
- 2006-10-12 Listed $349,900 MRED as Distributed by MLS Grid
- 2002-07-31 Sold (MLS) $179,900 MRED as Distributed by MLS Grid
- 2002-06-28 Listing Removed — MRED as Distributed by MLS Grid
- 2002-06-23 Listed $179,900 MRED as Distributed by MLS Grid
Cash-flow waterfall
monthlySold comps — $/sqft
last 12 mo · ≤1 miLoading sold comps…