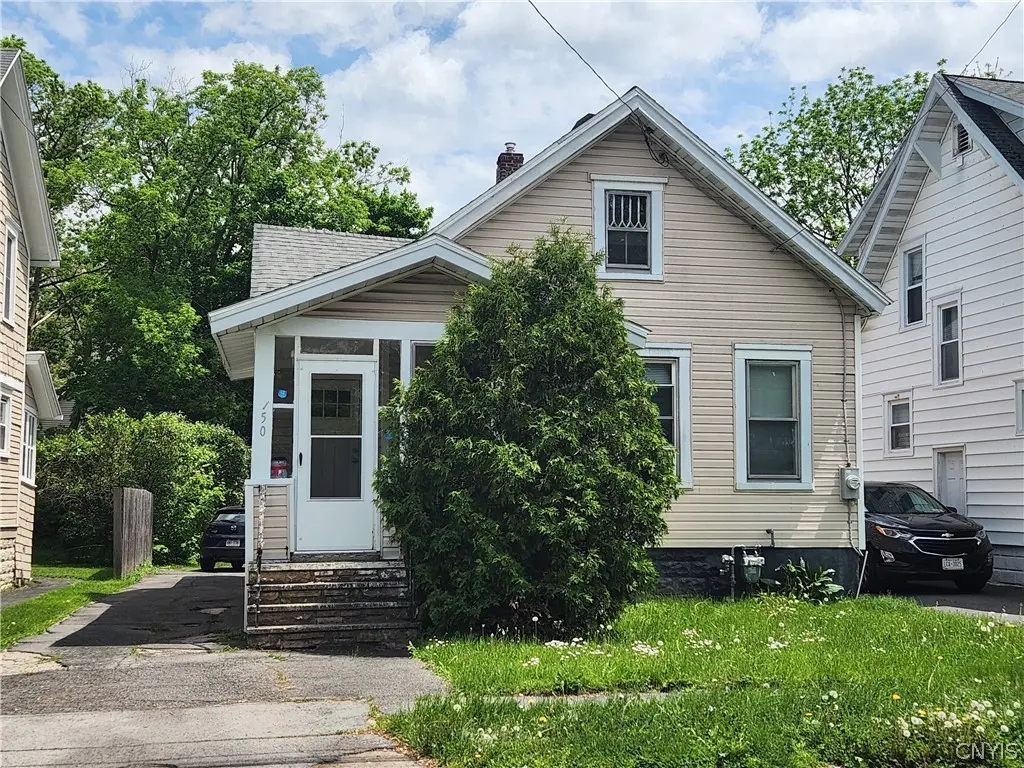
150 Wadsworth St · Syracuse, NY
Flood risk 4/10 · Minor
- FEMA flood zone
- X (unshaded)
- Chance of flooding over 30 yrs
- 0.22%
- Est. flood insurance / yr
- $473 – $860
Fire risk 1/10 · Minimal
- Est. fire insurance / yr
- $691 – $1,283
Heat risk 3/10 · Minor
- Hot days now (above 95°F)
- 7 days/yr
- Hot days in 30 yrs
- 16 days/yr
Wind risk 1/10 · Minimal
- Chance of severe wind over 30 yrs
- 0.0%
Air-quality risk 2/10 · Minimal
- Unhealthy air days now
- 0 days/yr
- Unhealthy air days in 30 yrs
- 1 days/yr
Risk factors via First Street. Map © Google.
Why this score? — see what drove the C grade
The composite is a weighted blend of 9 inputs, each scored 0–100. Each bar is that input's sub-score; the figure is the points it added to the 100-point composite (weight × sub-score).
- Cash flow +23.4/30.0
- DSCR +7.5/10.0
- ARV discount +7.5/15.0
- 1% rule +5.0/10.0
- Rent growth +4.6/5.0
- Livability +3.9/5.0
- Condition / age +2.5/5.0
- Schools +1.8/10.0
- Appreciation +0.0/10.0
$165,000
🖨 Deal sheet 📄 Offer letter ✓ Due diligence
Listing remarks
INVESTOR OPPORTUNITY ! FIRST FLOOR LIVING on the Northside. Cozy 3 bedroom, 1 bath Bungalow renovated in 2019. Roof completely replaced, bathroom 100% renovated. Plenty of kitchen updates. Hot water tank is only 6 months old. Nice hardwood floors, along with some original woodwork. Enjoy your morning coffee on the enclosed front porch. Relax or entertain in the good size partially fenced in yard. Plenty of off street parking. Tenant occupied.
Key facts
- Renovated bathroom
- Off street parking
- Kitchen updates
Tags
Property features AI
Exterior
- Parking: No garage
- Utilities: Electricity connected; Public water connected; Sewer connected
- Home design: Single-story home; Existing construction
- Construction: Vinyl siding; Asphalt roof; Block and poured foundation
- Exterior features: Blacktop driveway; Partial fencing; Fence; Near public transit; Rectangular residential lot; City street frontage; Lot dimensions approximately 36 x 125
Interior
- Kitchen: Free-standing range; Gas oven; Gas range; Oven; Refrigerator
- Bedrooms: Three bedrooms on the main level
- Flooring: Ceramic tile; Hardwood; Laminate; Varied flooring
- Bathrooms: One full bathroom on the main level
- Heating & cooling: Gas forced-air heating
- Interior features: Eat-in kitchen; Walk-in pantry; Natural woodwork; Main-level primary bedroom
- Laundry & utility: Gas water heater
Neighborhood map
What this means for you Summary
Snapshot
- This is a 3-bed/1.0-bath single-family listed at $165k.
Deal economics
- At list price, monthly cash flow is $304 ($4k/yr) — positive.
- The deal already cash-flows at list — no discount required.
- To meet the 1% rule (rent ≥ 1% of price), the offer needs to be $165k (0.1% below list).
- Recommended offer: $163k (1.5% below list) — sets the bar for market timing.
Location & tenants
- Location reads 77/100 on livability (#187 in NY, #2,869 nationally) — a middle-class / working-renter tenant base. Strengths: amenities A+, commute A+, cost of living A+; Watch: schools D+, crime F, employment D-.
- Syracuse City School District (urban): math 18% / reading 26% proficiency, ranked #590 of 590 in NY (top 100%) — low school quality limits family demand, transient renter base, plan for 1-2y turnover; 74% free/reduced lunch — lower-income household profile, screen leases tightly.
- Market conditions: Rents rising fast (+8.4%/yr); 55 active listings in the ZIP; 30 comparable units currently listed for rent nearby; rentals lingering (median 44d on market — plan ~5-8 weeks vacancy on turnover, expect pricing pressure); 63% of comp listings sitting > 30 days — soft ceiling on asking rent; 616 units permitted in Onondaga County in 2024 (256 in 5+ unit buildings).
- This rent runs 42% of the median local income ($47k/yr) — at the standard rent-burdened threshold; future hikes will face affordability resistance.
Forward outlook
- Local home prices are declining (-3.0%/yr); year-one equity from $1k of loan paydown is wiped out by about $5k of value loss. Plan a longer hold.
- Onondaga County population projected to shrink 9% by 2050 — rents likely to lag national; underwrite the cash flow, not the appreciation.
- At projected returns (-3.0% appreciation + 8.0% rent growth), your $46k cash investment doubles in ~9 years — after that, you're playing with house money.
Negotiation context
- It's been on market 19 days — a 2% lower offer ($163k) is reasonable based on typical stale-listing flexibility.
- 2 sale attempts since 10y ago with the ask held roughly flat each time — persistent listings suggest the price (not the market) is what's stuck; bring a comps-based counter.
- Current owner paid $45k; list at $165k implies a 267% gain — meaningful room to come down on a strong offer.
Risks & watch-outs
- Watch-outs: built in 1840 — expect roof / HVAC / electrical / plumbing capex.
Questions for the listing agent
- Built in 1840 — when were the roof, HVAC, electrical panel, plumbing, and water heater last replaced?
- Is there a deadline driving the sale (1031 exchange, divorce, estate, relocation)? That informs how much negotiation room exists.
- Schools are D-rated, which usually means shorter tenancies and higher turnover. Who's the typical renter profile here, and what's been the actual vacancy rate?
- Crime grade is F in this area — have there been break-ins, vandalism, or insurance claims at this property in the last 3 years? What carrier currently insures it and at what premium?
- What's the average days-on-market for RENTAL listings here right now (not sales)? A rising rental-DOM trend means longer vacancies and softer asking-rent achievability than the comps imply.
- What's the recent tenant-quality profile in this submarket — average credit score on applications, eviction rate, late-payment / NSF rate, and stable-employment percentage? A property-management company in the area should have these aggregated.
- How much new for-sale + rental construction is in the pipeline within 1–3 miles? Heavy new supply typically softens prices + rents 12–24 months out; constrained supply supports both.
Investment metrics
- 1% rule
- 1.00% ✗
- Cap rate
- 8.51%
- Cash-on-cash
- 7.90%
- DSCR
- 1.35
- GRM
- 8.3
CMA / ARV
- ARV (on-the-fly)
- $109,872
- Comps found
- 12
Show comp detail 12 sales within ~0.75 mi
| Address | Dist | Beds/Ba | Sqft | Sold | Price | $/sf | Match |
|---|---|---|---|---|---|---|---|
| 1212 Butternut St | 0.33mi | 3/1.0 | 1,000 (-1%) | 5mo | $75,000 | $75 | 79 |
| 164 Berkshire Ave | 0.35mi | 3/1.0 | 1,073 (+6%) | 2mo | $116,900 | $109 | 71 |
| 119 Lawrence St | 0.63mi | 3/1.0 | 1,008 (0%) | 3mo | $130,000 | $129 | 68 |
| 222 Darlington Rd | 0.36mi | 3/1.0 | 1,080 (+7%) | 5mo | $168,500 | $156 | 67 |
| 339 Douglas St | 0.70mi | 3/1.0 | 1,003 (-0%) | 2mo | $55,000 | $55 | 65 |
| 131 Delong Ave | 0.54mi | 2/1.0 (-1) | 984 (-2%) | 5mo | $90,000 | $91 | 61 |
| 231 Grumbach Ave | 0.35mi | 3/1.0 | 1,152 (+14%) | 0mo | $75,000 | $65 | 60 |
| 807 E Division St | 0.52mi | 3/2.0 | 952 (-6%) | 4mo | $70,000 | $74 | 59 |
| 497 Pleasantview Ave | 0.69mi | 3/1.5 | 1,056 (+5%) | 1mo | $189,900 | $180 | 57 |
| 126 Delong Ave | 0.52mi | 2/1.0 (-1) | 912 (-10%) | 3mo | $90,000 | $99 | 52 |
| 400 Kenwick Dr | 0.61mi | 3/1.5 | 1,106 (+10%) | 6mo | $189,900 | $172 | 48 |
| 168 Wainwright Ave | 0.42mi | 2/1.0 (-1) | 863 (-14%) | 7mo | $149,900 | $174 | 46 |
Match score weights: distance 35% · size 25% · config 20% · recency 20%. Top-matched comps best support the ARV.
Projected returns pro-forma
-3.0% appreciation · 8.0% rent growth · sell at horizon
- IRR
- 0.7%
- Equity multiple
- 1.03×
- Total profit
- $1,294
- Equity at exit
- $24,602
- IRR
- 14.5%
- Equity multiple
- 2.42×
- Total profit
- $65,480
- Equity at exit
- $14,266
Cash invested: $46,200 (down + closing). Projections, not guarantees.
Landlord ↔ Tenant lean methodology
- Overall (STATE)
- 15 Strongly Tenant-Friendly
- State New York
- 15 Strongly Tenant-Friendly · D+10
- County
- — inherits STATE
- City
- — inherits STATE
ZIP-level market 13203
- Home prices YoY
- -11.9%
- Rents YoY
- 8.4%
- Active inventory
- 55
- Price-to-rent
- 8.3×
Monthly cashflow live
- Estimated rent
- $1,648 high interval (Pro) →
- Mortgage (P&I)
- −$865
- Tax from tax record
- −$64 /mo · $767/yr
- Insurance
- −$69
- HOA
- −$0
- Vacancy / Maint / Mgmt
- −$346
- Net cashflow
- $304
Break-even live
UW: 25.0% down · 7.5% · 30yr · 1.5% tax · 5.0% vac · 8.0% maint · 8.0% mgmt
Financing live
Cash to close
- Down payment
- $41,250
- Closing costs
- $4,950
- Reserves months
- —
- Total cash needed
- —
Loan-product check · same deal, 3 products live
Conventional
25% down · 7.5% · 30yr
- Down + closing
- —
- Monthly P&I
- —
- Monthly cashflow
- —
- DSCR
- —
- Eligible?
- —
Personal DTI + credit; lowest rate.
DSCR
20% down · 8.5% · 30yr
- Down + closing
- —
- Monthly P&I
- —
- Monthly cashflow
- —
- DSCR
- —
- Eligible?
- —
No personal income docs; deal must DSCR.
Hard money
10% down · 12.0% · 12mo
- Down + closing
- —
- Monthly P&I
- —
- Monthly cashflow
- —
- DSCR
- —
- Eligible?
- —
Short-term bridge; refi at stabilization.
Rent comps 30 comps
| Address | Beds | Baths | Sqft | Rent | $/sqft | DOM | Units | Dist |
|---|---|---|---|---|---|---|---|---|
| 126 Woodruff Ave Syracuse, NY | 3.0 | 1.0 | 1200 | $1,675 | $1.40 | 43d | 1 | 0.15mi |
| 423 Wendell Ter Syracuse, NY | 4.0 | 1.0 | 1312 | $2,500 | $1.91 | 13d | 1 | 0.45mi |
| 286 Ross Park Syracuse, NY | 3.0 | 1.0 | 1100 | $1,500 | $1.36 | 44d | 1 | 0.59mi |
| 912 Park St Unit 1 Syracuse, NY | 3.0 | 1.0 | 1040 | $1,200 | $1.15 | 43d | 1 | 0.63mi |
| 205 Beecher St Unit 3 Syracuse, NY | 2.0 | 1.0 | 815 | $1,100 | $1.35 | 43d | 1 | 0.71mi |
| 746 E Laurel St Unit 2F Syracuse, NY | 2.0 | 1.0 | 800 | $1,100 | $1.38 | 43d | 1 | 0.73mi |
| 746 E Laurel St Unit 1 Syracuse, NY | 4.0 | 2.0 | 1400 | $1,500 | $1.07 | 43d | 1 | 0.73mi |
| 212 Dorchester Ave Syracuse, NY | 1.0–2.0 | 1.0 | 640 | $1,420 | $2.22 | 13d | 15 | 0.74mi |
| 610 E Division St Unit F2 Syracuse, NY | 2.0 | 1.0 | 900 | $1,150 | $1.28 | 43d | 1 | 0.81mi |
| 1618 James St #3 Syracuse, NY | 2.0 | 1.0 | 1150 | $2,200 | $1.91 | 13d | 1 | 0.88mi |
| 1801 James St #2 Syracuse, NY | 3.0 | 1.0 | 1244 | $1,800 | $1.45 | 13d | 1 | 0.94mi |
| 807-13 N Salina St Unit 809A Syracuse, NY | 2.0 | 1.0 | 1020 | $1,325 | $1.30 | 43d | 1 | 1.01mi |
| 517 N Salina St Unit 4 Syracuse, NY | 2.0 | 1.0 | 700 | $1,050 | $1.50 | 13d | 1 | 1.12mi |
| 1140 Wolf St Apt 3 Syracuse, NY | 2.0 | 1.0 | 800 | $1,200 | $1.50 | 43d | 1 | 1.12mi |
| 1132 Wolf St Unit 4 Syracuse, NY | 3.0 | 1.0 | 1041 | $1,350 | $1.30 | 43d | 1 | 1.12mi |
| 204 Mariposa St Unit pvt house Syracuse, NY | 3.0 | 1.0 | 1128 | $2,137 | $1.89 | 13d | 1 | 1.18mi |
| 117 Edtim Rd Syracuse, NY | 1.0–2.0 | 1.0 | 545 | $1,295 | $2.37 | 13d | 1 | 1.20mi |
| 1507 N Salina St Unit 3 Syracuse, NY | 3.0 | 2.0 | 1030 | $1,350 | $1.31 | 43d | 1 | 1.21mi |
| 205A Hawley Ave Unit 213C Syracuse, NY | 3.0 | 2.5 | 1350 | $1,650 | $1.22 | 43d | 1 | 1.22mi |
| 205A Hawley Ave Unit 211C Syracuse, NY | 3.0 | 2.5 | 1350 | $1,675 | $1.24 | 43d | 1 | 1.22mi |
| 721 N Clinton St Unit 105 Syracuse, NY | 2.0 | 2.0 | 1000 | $1,475 | $1.48 | 43d | 1 | 1.23mi |
| 721 N Clinton St Unit 213 Syracuse, NY | 2.0 | 2.0 | 1000 | $1,550 | $1.55 | 43d | 1 | 1.23mi |
| 210 W Division St Unit 24 Syracuse, NY | 2.0 | 2.0 | 1200 | $1,850 | $1.54 | 20d | 1 | 1.23mi |
| 210 W Division St Unit 87 Syracuse, NY | 2.0 | 2.0 | 1200 | $1,750 | $1.46 | 43d | 1 | 1.25mi |
| 416 Pearl St Unit 2 Syracuse, NY | 3.0 | 1.0 | 900 | $2,400 | $2.67 | 13d | 1 | 1.28mi |
| 525 Burnet Ave Unit First Floor Syracuse, NY | 3.0 | 1.0 | 900 | $1,650 | $1.83 | 43d | 1 | 1.29mi |
| 200 Catherine St Apt 5 Syracuse, NY | 2.0 | 1.0 | 850 | $1,550 | $1.82 | 43d | 1 | 1.29mi |
| 225 Marlborough Rd Syracuse, NY | 2.0 | 1.0 | 1040 | $1,800 | $1.73 | 13d | 1 | 1.35mi |
| 297 Norwood Ave Syracuse, NY | 3.0 | 1.0 | 1188 | $2,050 | $1.73 | 20d | 1 | 1.47mi |
| 373 Spencer St Unit 303 Syracuse, NY | 2.0 | 1.5 | 1085 | $1,850 | $1.71 | 43d | 1 | 1.49mi |
Listing history 16 events
-
2026-06-18days on market $165,000 Active 19 DOM
-
2026-06-17days on market $165,000 Active 18 DOM
-
2026-06-16days on market $165,000 Active 17 DOM
-
2026-06-15days on market $165,000 Active 16 DOM
-
2026-06-14days on market $165,000 Active 14 DOM
-
2026-06-13days on market $165,000 Active 13 DOM
-
2026-06-10days on market $165,000 Active 11 DOM
-
2026-06-09days on market $165,000 Active 10 DOM
-
2026-06-08days on market $165,000 Active 9 DOM
-
2026-06-07days on market $165,000 Active 8 DOM
-
2026-06-05days on market $165,000 Active 5 DOM
-
2026-06-02remarks 446-char remark
-
2026-06-02days on market $165,000 Active 3 DOM
-
2026-06-01days on market $165,000 Active 2 DOM
-
2026-05-30remarks 406-char remark
-
2026-05-30$165,000 Active 1 DOM
ⓘ Source: listings_history table (triggers on properties + properties_extension) + one-shot
backfill from property_details.listing_events for pre-trigger history.
Tax reassessment forecast NY · Partial reset (capped growth)
- Current annual tax
- $767 · $64/mo
- Projected year-2 tax
- $1,778 · $148/mo
- Expected delta
- +$1,011/yr (+$84/mo · 131.8%)
ⓘ Screening estimate from a state-policy table — verify with the county assessor before closing.
Climate risk First Street
- Flood 4/10 Moderate FEMA zone X (unshaded) · 22% chance over 30 yrs
- Wildfire 1/10 Low
- Heat 3/10 Moderate 7 d/yr ≥95°F today · 16 d/yr by 30 yrs out
- Wind 1/10 Low 0% chance of damaging wind over 30 yrs
- Air quality 2/10 Low 0 unhealthy d/yr today · 1 by 30 yrs out
Nearby sold comps map
Loading sold comps map…
Walkable amenities ~0.75 mi
Loading nearby amenities…
Taxation est. · year 1
- Rental income
- $19,781
- − Mortgage interest
- −$9,243
- − Property taxes
- −$767
- − Insurance
- −$825
- − Repairs & maintenance
- −$1,583
- − Management
- −$1,583
- − Depreciation
- −$4,800
- Taxable income
- $982
- Est. tax owed @ 24.0%
- −$236
- After-tax cash flow
- $3,416/yr
For passive investors: Depreciation is non-cash, so a rental often shows a tax loss while cash-flowing — sheltering income. Rental losses are passive: they offset passive income freely, and up to $25,000/yr can offset ordinary (W-2) income if you actively participate and your MAGI is under $100k (phasing out to $0 by $150k); unused losses carry forward. On sale, claimed depreciation is recaptured at up to 25%, and gains may owe capital-gains tax (a 1031 exchange can defer both). Figures are a year-1 estimate at your 24.0% rate — not tax advice; consult a CPA.
Schools (NCES district)
- District
- Syracuse City School District
- NCES district ID
- 3628590
- Math proficiency
- 18% ▼ -5.00%
- Reading proficiency
- 26% ▬ 0.00%
- Median HH income
- $32,097
- Composite
- 17.83/100
- National rank
- #9007
- State rank
- #590 of 590 in NY
Livability — Syracuse
- Score
- 77/100
- State rank
- #187
- US rank
- #2869
Category grades
Schools grade is shown separately in the Schools card above.
Census & demographics
- Census place
- Syracuse, NY
- County
- Onondaga County · 247,257 people
- City population
- 152,627
- Metro
- Syracuse, NY
- Population (ZIP)
- 16,180
- Household income
- $46,997
- Rent vs Own
- Severe rent burden
- 1566.0
Population outlook (Onondaga County) Hauer SSP2
- Today (2025)
- 467,894 people
- By 2030
- 463,381 · -1.0%
- By 2040
- 447,697 · -4.3%
- By 2050
- 426,399 · -8.9%
- By 2075
- 373,661 · -20.1%
- By 2100
- 307,967 · -34.2%
Race, ethnicity, and origin ACS 2023
- Neighborhood character
- Diverse neighborhood (Simpson 0.67)
- Race & ethnicity
- White 52% Black 22% Hispanic / Latino 11% Two or more races 9% Asian 7%
- Hispanic origin (detail)
- Puerto Rican 6% Cuban 2%
- Common ancestry
- Romanian 3% Lithuanian 2% Iranian 2%
- Foreign-born
- 13% · Canada, India, Philippines
- Languages at home
- 81% English-only · Spanish 6% Other Indo-European 3% Other Asian/Pacific 3%
Political lean MEDSL · Onondaga
- 2024 margin
- D (+17.3) · D 58.6% · R 41.4%
- 2008→2024 swing
- -3.0pp toward R · 2008: 20.3pp · 2024: 17.3pp
- All cycles
- 2024: D+17.3 2020: D+20.6 2016: D+12.8 2012: D+21.1 2008: D+20.3
Not yet ingested
- Civics
- —
Market trends
- HPI YoY
- ▼ -35.69%
- Current HPI
- 263.2588
- Rent YoY
- ▲ 8.39%
- Metro
- Syracuse, NY
- State GDP YoY
- ▲ 2.60%
- F500 in state
- 92
Industry mix (Fortune 500 HQ in NY)
| Industry | F500 HQs | Revenue |
|---|---|---|
| Financial Services | 10 | $950B |
|
||
| Consumer Goods | 9 | $162B |
|
||
| Insurance | 4 | $225B |
|
||
| Telecommunications | 2 | $144B |
|
||
| Pharmaceuticals | 2 | $112B |
|
||
| Media / Entertainment | 2 | $69B |
|
||
Price history
+266.7% since first listed5 events — show timeline
- 2026-05-30 Listed $165,000 CNYIS
- 2017-01-13 Listing Removed — CNYIS
- 2016-09-01 Contingent — CNYIS
- 2016-08-18 Listed $20,000 CNYIS
- 1995-11-28 Sold (Public Records) $45,000 Public Records
Property tax history
-2.5%/yrLatest (2025): $767 · +0.0% YoY. Source: county tax records.
Cash-flow waterfall
monthlySold comps — $/sqft
last 12 mo · ≤1 miLoading sold comps…