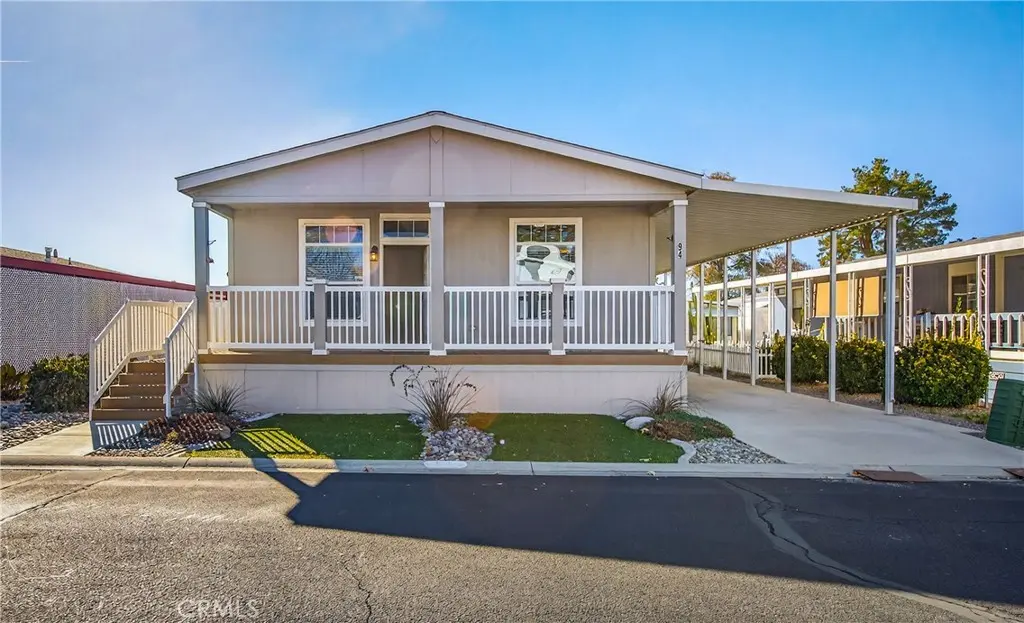
1300 W Menlo Ave #94 · Hemet, CA
Flood risk 1/10 · Minimal
- FEMA flood zone
- A
- Chance of flooding over 30 yrs
- 0.0%
- Est. flood insurance / yr
- $1,009 – $1,996
Fire risk 2/10 · Minimal
- Est. fire insurance / yr
- $659 – $1,223
Heat risk 7/10 · Major
- Hot days now (above 104°F)
- 6 days/yr
- Hot days in 30 yrs
- 16 days/yr
Wind risk 1/10 · Minimal
- Chance of severe wind over 30 yrs
- —
Air-quality risk 6/10 · Moderate
- Unhealthy air days now
- 12 days/yr
- Unhealthy air days in 30 yrs
- 14 days/yr
Risk factors via First Street. Map © Google.
Why this score? — see what drove the C+ grade
The composite is a weighted blend of 9 inputs, each scored 0–100. Each bar is that input's sub-score; the figure is the points it added to the 100-point composite (weight × sub-score).
- Cash flow +30.0/30.0
- 1% rule +10.0/10.0
- DSCR +10.0/10.0
- Rent growth +2.9/5.0
- Livability +2.6/5.0
- Schools +2.5/10.0
- Condition / age +2.5/5.0
- ARV discount +0.5/15.0
- Appreciation +0.0/10.0
$159,900
🖨 Deal sheet 📄 Offer letter ✓ Due diligence
Listing remarks MLS
Very nice 3 bed, 2 bath double wide home in the desired & gated 55+ age restricted community of Heather Estates. Built in 2018, 1612 sqft. , spacious kitchen w/ beautiful cabinets & stainless steel appliances that opens up to the living & dining areas. Bedrooms & bathrooms are good sized. Inside laundry with lots of storage. Full length carport and a shed. Your mornings or evenings can be spent relaxing on the front porch with a wonderful view of the mountains. Enjoy the beautiful pool & spa and pond areas and all the activities in the large clubhouse, including billiards, game room, shuffleboard, hall with full kitchen, library, and exercise room. Put this one on your must see list!
Key facts
- Gated community
- Spacious kitchen
- Front porch
Tags
Neighborhood map
What this means for you Summary
Snapshot
- This is a 3-bed/2.0-bath manufactured listed at $160k.
Deal economics
- At list price, monthly cash flow is $796 ($10k/yr) — positive.
- The deal already cash-flows at list — no discount required.
- Meets the 1% rule at list price ($2k rent vs $160k).
- Recommended offer: $141k (12.0% below list) — sets the bar for market timing.
- Cap rate 13.2% vs local median 4.9% in Hemet — top-decile yield for the area; either an underpriced asset or a hidden risk that comps aren't pricing in. Stress-test before assuming the spread holds.
Location & tenants
- Location reads 51/100 on livability (#1,056 in CA) — a working-class tenant base; expect higher turnover. Strengths: housing A+; Watch: crime D+, schools F, amenities F.
- Hemet Unified (suburban): math 19% / reading 41% proficiency, ranked #360 of 517 in CA (top 70%) — families likely to look elsewhere, expect single-tenant / working-renter base with shorter leases; 66% free/reduced lunch — lower-income household profile, screen leases tightly.
- Market conditions: Rents rising (+1.8%/yr); 264 active listings in the ZIP; 25 comparable units currently listed for rent nearby; rentals at typical pace (median 18d on market — plan ~3-4 weeks tenant-placement turnaround); 9,195 units permitted in Riverside County in 2024 (1,512 in 5+ unit buildings).
- At $2,458/mo this rent would consume 60% of the median local household income ($49k/yr) (locally 2144% of renters already pay >50% of income on rent) — very limited rent-growth headroom before tenants either downsize or default.
Forward outlook
- Local home prices are declining (-3.0%/yr); year-one equity from $1k of loan paydown is wiped out by about $5k of value loss. Plan a longer hold.
- Riverside County population projected at +22% by 2050 — long-run rental-demand tailwind backs the buy-and-hold thesis.
- At projected returns (-3.0% appreciation + 1.8% rent growth), your $45k cash investment doubles in ~7 years — after that, you're playing with house money.
Negotiation context
- It's been on market 152 days — a 12% lower offer ($141k) is reasonable based on typical stale-listing flexibility.
- 3 sale attempts since 13y ago with the ask held roughly flat each time — persistent listings suggest the price (not the market) is what's stuck; bring a comps-based counter.
- Current owner paid $20k; list at $160k implies a 720% gain — meaningful room to come down on a strong offer.
Risks & watch-outs
- Watch-outs: flood insurance adds $125/mo.
- Climate carrying-cost: in FEMA flood zone A (mandatory federal flood insurance); extreme-heat days projected 6→16/yr by 2055 (HVAC capex compounding) — expect insurance premiums to compound above CPI over the hold.
Questions for the listing agent
- It's been on market 152 days. Have you received any prior offers? Is the seller open to a 12% concession, seller financing, or rate buy-down credit?
- What's the actual annual flood-insurance premium (NFIP or private), and is the property in a SFHA with mandatory coverage?
- Why hasn't it sold? Are there any deal-killer items the seller is aware of (foundation, flood, title, zoning, code violations)?
- Is there a deadline driving the sale (1031 exchange, divorce, estate, relocation)? That informs how much negotiation room exists.
- Schools are F-rated, which usually means shorter tenancies and higher turnover. Who's the typical renter profile here, and what's been the actual vacancy rate?
- Crime grade is D in this area — have there been break-ins, vandalism, or insurance claims at this property in the last 3 years? What carrier currently insures it and at what premium?
- What's the average days-on-market for RENTAL listings here right now (not sales)? A rising rental-DOM trend means longer vacancies and softer asking-rent achievability than the comps imply.
- What's the recent tenant-quality profile in this submarket — average credit score on applications, eviction rate, late-payment / NSF rate, and stable-employment percentage? A property-management company in the area should have these aggregated.
- How much new for-sale + rental construction is in the pipeline within 1–3 miles? Heavy new supply typically softens prices + rents 12–24 months out; constrained supply supports both.
Investment metrics
- 1% rule
- 1.54% ✓
- Cap rate
- 13.20%
- Cash-on-cash
- 24.68%
- DSCR
- 2.10
- GRM
- 5.4
CMA / ARV
- ARV (median comp)
- $138,500
- List price
- $159,900
- Delta
- 15.45%
- Verdict
- OVERPRICED
- Comps
- 20 within 1.0 mi
Show comp detail 12 sales within ~0.75 mi
| Address | Dist | Beds/Ba | Sqft | Sold | Price | $/sf | Match |
|---|---|---|---|---|---|---|---|
| 1300 Menlo Ave #81 | 0.09mi | 3/2.0 | 1,612 (0%) | 1mo | $155,000 | $96 | 94 |
| 1580 Cabrillo Dr | 0.45mi | 2/2.0 (-1) | 1,640 (+2%) | 4mo | $235,000 | $143 | 68 |
| 1450 Carlotta | 0.23mi | 2/2.0 (-1) | 1,440 (-11%) | 4mo | $204,000 | $142 | 64 |
| 1250 N Kirby St #77 | 0.57mi | 2/2.0 (-1) | 1,536 (-5%) | 2mo | $91,500 | $60 | 59 |
| 1645 Sonora | 0.36mi | 2/2.0 (-1) | 1,440 (-11%) | 4mo | $199,900 | $139 | 57 |
| 1420 Cabrillo Dr | 0.42mi | 2/2.0 (-1) | 1,440 (-11%) | 1mo | $247,500 | $172 | 57 |
| 1250 N Kirby #194 | 0.57mi | 3/2.0 | 1,440 (-11%) | 4mo | $89,000 | $62 | 53 |
| 542 Castille | 0.44mi | 2/2.0 (-1) | 1,392 (-14%) | 2mo | $239,000 | $172 | 50 |
| 1525 W Oakland Ave #62 | 0.54mi | 2/2.0 (-1) | 1,440 (-11%) | 2mo | $40,000 | $28 | 50 |
| 1250 N Kirby St #151 | 0.57mi | 3/2.0 | 1,404 (-13%) | 5mo | $115,000 | $82 | 48 |
| 1250 N Kirby St #127 | 0.57mi | 2/2.0 (-1) | 1,440 (-11%) | 4mo | $46,500 | $32 | 47 |
| 1250 N Kirby #92 | 0.57mi | 2/2.0 (-1) | 1,440 (-11%) | 5mo | $99,900 | $69 | 46 |
Match score weights: distance 35% · size 25% · config 20% · recency 20%. Top-matched comps best support the ARV.
Projected returns pro-forma
-3.0% appreciation · 1.76% rent growth · sell at horizon
- IRR
- 12.4%
- Equity multiple
- 1.49×
- Total profit
- $21,799
- Equity at exit
- $23,842
- IRR
- 20.4%
- Equity multiple
- 2.62×
- Total profit
- $72,367
- Equity at exit
- $13,825
Cash invested: $44,772 (down + closing). Projections, not guarantees.
Landlord ↔ Tenant lean methodology
- Overall (STATE)
- 18 Strongly Tenant-Friendly
- State California
- 18 Strongly Tenant-Friendly · D+13
- County
- — inherits STATE
- City
- — inherits STATE
ZIP-level market 92543
- Home prices YoY
- -26.7%
- Rents YoY
- 1.8%
- Active inventory
- 264
- Price-to-rent
- 5.4×
Monthly cashflow live
- Estimated rent
- $2,458 high interval (Pro) →
- Mortgage (P&I)
- −$839
- Tax from tax record
- −$116 /mo · $1,387/yr
- Insurance
- −$67
- Flood insurance flood zone
- −$125 /mo · $1,502/yr
- HOA
- −$0
- Vacancy / Maint / Mgmt
- −$516
- Net cashflow
- $796
Break-even live
UW: 25.0% down · 7.5% · 30yr · 1.5% tax · 5.0% vac · 8.0% maint · 8.0% mgmt
Financing live
Cash to close
- Down payment
- $39,975
- Closing costs
- $4,797
- Reserves months
- —
- Total cash needed
- —
Loan-product check · same deal, 3 products live
Conventional
25% down · 7.5% · 30yr
- Down + closing
- —
- Monthly P&I
- —
- Monthly cashflow
- —
- DSCR
- —
- Eligible?
- —
Personal DTI + credit; lowest rate.
DSCR
20% down · 8.5% · 30yr
- Down + closing
- —
- Monthly P&I
- —
- Monthly cashflow
- —
- DSCR
- —
- Eligible?
- —
No personal income docs; deal must DSCR.
Hard money
10% down · 12.0% · 12mo
- Down + closing
- —
- Monthly P&I
- —
- Monthly cashflow
- —
- DSCR
- —
- Eligible?
- —
Short-term bridge; refi at stabilization.
Rent comps 25 comps
| Address | Beds | Baths | Sqft | Rent | $/sqft | DOM | Units | Dist |
|---|---|---|---|---|---|---|---|---|
| 828 Coramdeo Ct Hemet, CA | 3.0 | 2.0 | 1543 | $3,000 | $1.94 | 44d | 1 | 0.09mi |
| 1700 Walden Ln Hemet, CA | 3.0 | 2.0 | 1430 | $2,670 | $1.87 | 24d | 1 | 0.27mi |
| 663 Mariposa Dr Hemet, CA | 2.0 | 2.0 | 1440 | $1,500 | $1.04 | 24d | 1 | 0.29mi |
| 543 La Cresta Dr Hemet, CA | 2.0 | 2.0 | 1544 | $1,595 | $1.03 | 44d | 1 | 0.41mi |
| 2014 Iris Way Hemet, CA | 3.0 | 2.0 | 1192 | $2,850 | $2.39 | 44d | 1 | 0.43mi |
| 914 Haviture Way Hemet, CA | 3.0 | 2.0 | 1935 | $2,900 | $1.50 | 2d | 1 | 0.44mi |
| 2208 El Grande St Hemet, CA | 2.0 | 2.0 | 1327 | $2,100 | $1.58 | 18d | 1 | 0.65mi |
| 1315 W Latham Ave Hemet, CA | 3.0 | 2.5 | 1340 | $2,550 | $1.90 | 44d | 1 | 0.85mi |
| 853 Ensenada Dr Hemet, CA | 2.0 | 2.0 | 1350 | $1,875 | $1.39 | 12d | 1 | 0.89mi |
| 853 Ensenada Dr Hemet, CA | 2.0 | 2.0 | 1350 | $1,875 | $1.39 | 24d | 1 | 0.89mi |
| 811 Alondra Dr Hemet, CA | 2.0 | 2.0 | 1166 | $1,875 | $1.61 | 5d | 1 | 0.94mi |
| 743 Via Linda Dr Hemet, CA | 2.0 | 2.0 | 1206 | $1,995 | $1.65 | 5d | 1 | 1.11mi |
| 1844 Paradise Way San Jacinto, CA | 3.0 | 2.0 | 1540 | $3,000 | $1.95 | 44d | 1 | 1.18mi |
| 1245 Millie Dr Hemet, CA | 3.0 | 2.0 | 1392 | $2,850 | $2.05 | 8d | 1 | 1.22mi |
| 1967 Connor Ln San Jacinto, CA | 3.0 | 2.5 | 1708 | $2,950 | $1.73 | 8d | 1 | 1.25mi |
| 2098 W Acacia Ave Hemet, CA | 1.0–3.0 | 1.0–2.0 | 895 | $2,475 | $2.77 | 2d | 1 | 1.25mi |
| 529 E Latham Ave Hemet, CA | 3.0 | 1.0 | 1226 | $1,950 | $1.59 | 20d | 1 | 1.34mi |
| 415 S Tahquitz Ave Hemet, CA | 3.0 | 2.0 | 1766 | $2,900 | $1.64 | 18d | 1 | 1.37mi |
| 1850 Amberwood Dr Hemet, CA | 2.0 | 2.0 | 1170 | $1,561 | $1.33 | 44d | 1 | 1.38mi |
| 363 S Gilbert St Hemet, CA | 3.0 | 2.0 | 1200 | $1,900 | $1.58 | 4d | 1 | 1.38mi |
| 363 S Gilbert St Unit B Hemet, CA | 3.0 | 2.0 | 1200 | $1,900 | $1.58 | 14d | 1 | 1.38mi |
| 1775 S Santa Fe Ave San Jacinto, CA | 3.0 | 2.0 | 1300 | $2,850 | $2.19 | 2d | 1 | 1.39mi |
| 3471 Dublin Ct Hemet, CA | 3.0 | 2.0 | 1276 | $2,895 | $2.27 | 4d | 1 | 1.40mi |
| 471 Whitney Dr Hemet, CA | 2.0 | 2.0 | 1085 | $1,800 | $1.66 | 5d | 1 | 1.41mi |
| 1555 S Santa Fe Ave San Jacinto, CA | 3.0 | 2.0 | 1161 | $2,300 | $1.98 | 24d | 1 | 1.48mi |
Listing history 19 events
-
2026-06-18days on market $159,900 Active 152 DOM
-
2026-06-17days on market $159,900 Active 151 DOM
-
2026-06-16days on market $159,900 Active 150 DOM
-
2026-06-15days on market $159,900 Active 149 DOM
-
2026-06-13days on market $159,900 Active 147 DOM
-
2026-06-09days on market $159,900 Active 143 DOM
-
2026-06-08days on market $159,900 Active 142 DOM
-
2026-06-07days on market $159,900 Active 141 DOM
-
2026-06-04days on market $159,900 Active 138 DOM
-
2026-06-03days on market $159,900 Active 137 DOM
-
2026-06-02days on market $159,900 Active 136 DOM
-
2026-06-01days on market $159,900 Active 135 DOM
-
2026-05-31days on market $159,900 Active 134 DOM
-
2026-01-17$159,900 Active 722-char remark
Show marketing remark (722 chars)
Very nice 3 bed, 2 bath double wide home in the desired & gated 55+ age restricted community of Heather Estates. Built in 2018, 1612 sqft. , spacious kitchen w/ beautiful cabinets & stainless steel appliances that opens up to the living & dining areas. Bedrooms & bathrooms are good sized. Inside laundry with lots of storage. Full length carport and a shed. Your mornings or evenings can be spent relaxing on the front porch with a wonderful view of the mountains. Enjoy the beautiful pool & spa and pond areas and all the activities in the large clubhouse, including billiards, game room, shuffleboard, hall with full kitchen, library, and exercise room. Put this one on your must see list!
-
2026-01-15historical
-
2025-09-03$165,000 Active
-
2013-08-14soldstatus $19,500 Closed
-
2013-08-05status Pending
-
2013-05-17$22,500 Active
ⓘ Source: listings_history table (triggers on properties + properties_extension) + one-shot
backfill from property_details.listing_events for pre-trigger history.
Tax reassessment forecast CA · Resets to sale price
- Current annual tax
- $1,387 · $116/mo
- Projected year-2 tax
- $1,387 · $116/mo
- Expected delta
- $0/yr ($0/mo · 0.0%)
ⓘ Screening estimate from a state-policy table — verify with the county assessor before closing.
Climate risk First Street
- Flood 1/10 Low FEMA zone A · 0% chance over 30 yrs
- Wildfire 2/10 Low
- Heat 7/10 Severe 6 d/yr ≥104°F today · 16 d/yr by 30 yrs out
- Wind 1/10 Low
- Air quality 6/10 Major 12 unhealthy d/yr today · 14 by 30 yrs out
Nearby sold comps map
Loading sold comps map…
Walkable amenities ~0.75 mi
Loading nearby amenities…
Taxation est. · year 1
- Rental income
- $29,494
- − Mortgage interest
- −$8,957
- − Property taxes
- −$1,387
- − Insurance
- −$2,302
- − Repairs & maintenance
- −$2,359
- − Management
- −$2,359
- − Depreciation
- −$4,652
- Taxable income
- $7,477
- Est. tax owed @ 24.0%
- −$1,794
- After-tax cash flow
- $7,754/yr
For passive investors: Depreciation is non-cash, so a rental often shows a tax loss while cash-flowing — sheltering income. Rental losses are passive: they offset passive income freely, and up to $25,000/yr can offset ordinary (W-2) income if you actively participate and your MAGI is under $100k (phasing out to $0 by $150k); unused losses carry forward. On sale, claimed depreciation is recaptured at up to 25%, and gains may owe capital-gains tax (a 1031 exchange can defer both). Figures are a year-1 estimate at your 24.0% rate — not tax advice; consult a CPA.
Schools (NCES district)
- District
- Hemet Unified
- NCES district ID
- 0616920
- Math proficiency
- 19% ▼ -3.00%
- Reading proficiency
- 41% ▲ 4.00%
- Median HH income
- $39,962
- Composite
- 25.16/100
- National rank
- #7517
- State rank
- #360 of 517 in CA
Livability — Hemet
- Score
- 51/100
- State rank
- #1056
- US rank
- #25208
Category grades
Schools grade is shown separately in the Schools card above.
Census & demographics
- Census place
- Hemet, CA
- County
- Riverside County · 2,287,001 people
- City population
- 137,670
- Metro
- Riverside-San Bernardino-Ontario, CA
- Population (ZIP)
- 39,937
- Household income
- $49,396
- Rent vs Own
- Severe rent burden
- 2144.0
Population outlook (Riverside County) Hauer SSP2
- Today (2025)
- 2,664,475 people
- By 2030
- 2,802,692 · +5.2%
- By 2040
- 3,050,904 · +14.5%
- By 2050
- 3,256,783 · +22.2%
- By 2075
- 3,655,058 · +37.2%
- By 2100
- 3,766,594 · +41.4%
Race, ethnicity, and origin ACS 2023
- Neighborhood character
- Diverse neighborhood (Simpson 0.61)
- Race & ethnicity
- Hispanic / Latino 54% White 30% Two or more races 18% Black 10% Native American 2% Asian 2%
- Hispanic origin (detail)
- Mexican 48% Puerto Rican 1%
- Common ancestry
- Slovak 1% Romanian 1% Portuguese 1%
- Foreign-born
- 21% · Canada
- Languages at home
- 59% English-only · Spanish 38% Arabic 1% Tagalog/Filipino 1%
Political lean MEDSL · Riverside
- 2024 margin
- Toss-up / Even · D 48.0% · R 49.3% · Other 2.6%
- 2008→2024 swing
- -3.6pp toward R · 2008: 2.3pp · 2024: -1.3pp
- All cycles
- 2024: R+1.3 2020: D+8.0 2016: D+4.3 2012: R+0.4 2008: D+2.3
Not yet ingested
- Civics
- —
Market trends
- HPI YoY
- ▼ -147.46%
- Current HPI
- 405.1277
- Rent YoY
- ▲ 1.76%
- Metro
- Riverside-San Bernardino-Ontario, CA
- State GDP YoY
- ▲ 3.21%
- F500 in state
- 116
Industry mix (Fortune 500 HQ in CA)
| Industry | F500 HQs | Revenue |
|---|---|---|
| Technology | 27 | $1,492B |
|
||
| Financial Services | 3 | $174B |
|
||
| Retail | 3 | $44B |
|
||
| Insurance | 3 | $26B |
|
||
| Media / Entertainment | 2 | $115B |
|
||
| Pharmaceuticals / Biotech | 2 | $62B |
|
||
Price history
+610.7% since first listed6 events — show timeline
- 2026-01-17 Listed $159,900 CRMLS
- 2026-01-15 Listing Removed — CRMLS
- 2025-09-03 Listed $165,000 CRMLS
- 2013-08-14 Sold (MLS) $19,500 CRMLS
- 2013-08-05 Pending — CRMLS
- 2013-05-17 Listed $22,500 CRMLS
Property tax history
+6.5%/yrLatest (2025): $1,387 · +2.0% YoY. Source: county tax records.
Cash-flow waterfall
monthlySold comps — $/sqft
last 12 mo · ≤1 miLoading sold comps…