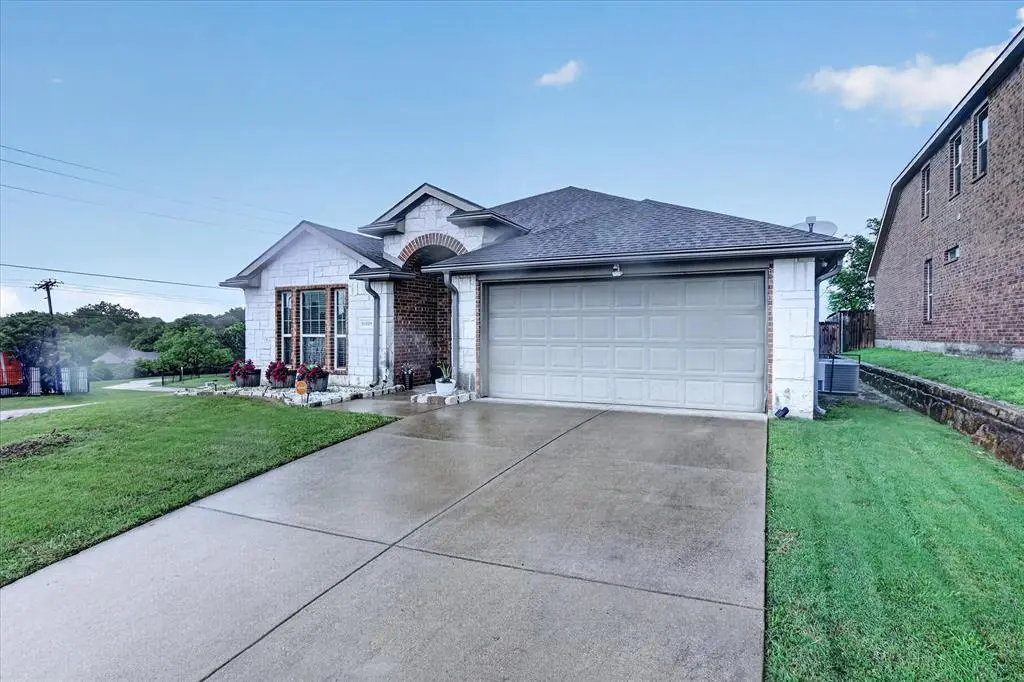
14089 Pioneer Bluffs Rd · Balch Springs, TX
Flood risk 1/10 · Minimal
- FEMA flood zone
- X (unshaded)
- Chance of flooding over 30 yrs
- 0.0%
- Est. flood insurance / yr
- $507 – $1,088
Fire risk 3/10 · Minor
- Est. fire insurance / yr
- $1,222 – $2,270
Heat risk 8/10 · Major
- Hot days now (above 111°F)
- 7 days/yr
- Hot days in 30 yrs
- 24 days/yr
Wind risk 6/10 · Moderate
- Chance of severe wind over 30 yrs
- 27.0%
Air-quality risk 2/10 · Minimal
- Unhealthy air days now
- 1 days/yr
- Unhealthy air days in 30 yrs
- 1 days/yr
Risk factors via First Street. Map © Google.
Why this score? — see what drove the D- grade
The composite is a weighted blend of 9 inputs, each scored 0–100. Each bar is that input's sub-score; the figure is the points it added to the 100-point composite (weight × sub-score).
- ARV discount +12.3/15.0
- Cash flow +8.6/30.0
- 1% rule +4.5/10.0
- Livability +3.4/5.0
- Schools +2.9/10.0
- Rent growth +2.5/5.0
- Condition / age +2.5/5.0
- DSCR +2.4/10.0
- Appreciation +0.0/10.0
$275,000
🖨 Deal sheet 📄 Offer letter ✓ Due diligence
Listing remarks MLS
Very popular 4606 plan in Pioneer Bluffs!! Beautiful home! Gorgeous, huge kitchen with lots of cabinets. Ready for move-in!! Must see!! SEE SHOWING INSTRUCTIONS PLEASE
Key facts
- Large living area
- Walk-in closet
- Primary suite
Tags
Property features AI
Finance
- Financial info: Financing accepted: Cash, Conventional, FHA, VA
- HOA & community: Mandatory HOA with quarterly fee ($60); HOA covers management fees; HOA managed by The Mac Group
Exterior
- Parking: Attached 2-car garage; Covered parking
- Security: Video surveillance present (security camera excluded from sale)
- Utilities: City water; City sewer; Not in a municipal utility district
- Home design: Single family residence; One story; Residential property; Smart home features
- Construction: Built in 2012; Brick construction; Composition roof; Slab foundation
- Exterior features: Wood fencing; Lot less than 0.5 acre
Interior
- Kitchen: Dishwasher; Disposal; Electric oven; Microwave
- Bedrooms: 3 bedrooms; Primary bedroom on main level with walk-in closet
- Bathrooms: 2 full bathrooms
- Interior features: Open floorplan; Pantry; Walk-in closets; One living area; One dining area; Ceiling fans
- Laundry & utility: Electric dryer hookup
Neighborhood map
What this means for you Summary
Snapshot
- This is a 3-bed/2.0-bath single-family listed at $275k.
Deal economics
- At list price, monthly cash flow is $-235 ($-3k/yr) — negative.
- To cash-flow at today's rent, offer at most $233k (15.1% below list).
- To meet the 1% rule (rent ≥ 1% of price), the offer needs to be $260k (5.3% below list).
- Recommended offer: $233k (15.1% below list) — sets the bar for cash-flow.
Location & tenants
- Location reads 68/100 on livability (#487 in TX) — a middle-class / working-renter tenant base. Strengths: cost of living A+, housing A+, health & safety B+; Watch: employment D, crime F, amenities F.
- Mesquite ISD (suburban): math 35% / reading 32% proficiency, ranked #536 of 826 in TX (top 65%) — families likely to look elsewhere, expect single-tenant / working-renter base with shorter leases; 63% free/reduced lunch — lower-income household profile, screen leases tightly.
- Zoned schools: Gentry El (math 34% / reading 40%, grade F, #1,769 of 4,322 statewide, top 44%, 637 students, 79% FRL) — zoned schools average 79% FRL vs 63% district-wide (16 pts higher); higher-poverty schools than district average — tighter screening recommended.
- Market conditions: Rents flat; 590 active listings in the ZIP; 32 comparable units currently listed for rent nearby; rentals at typical pace (median 22d on market — plan ~3-4 weeks tenant-placement turnaround); high-income renter base; 12,577 units permitted in Dallas County in 2024 (6,829 in 5+ unit buildings).
Forward outlook
- Local home prices are declining (-3.0%/yr); year-one equity from $2k of loan paydown is wiped out by about $8k of value loss. Plan a longer hold.
- Dallas County population projected at +35% by 2050 — long-run rental-demand tailwind backs the buy-and-hold thesis.
Negotiation context
- It's been on market 51 days — a 3% lower offer ($267k) is reasonable based on typical stale-listing flexibility.
- 2 sale attempts since 13y ago; this cycle's ask has dropped $45k (14%) from the opening price — seller is motivated, your offer sets the floor, not the list.
Risks & watch-outs
- Watch-outs: property tax is 3.1% of price.
- Climate carrying-cost: major wind risk, 27% chance of damaging wind over 30y; extreme-heat days projected 7→24/yr by 2055 (HVAC capex compounding) — expect insurance premiums to compound above CPI over the hold.
Questions for the listing agent
- What do current leases actually rent for vs. the listed asking? Can we see a recent rent roll and the last 12 months of T-12 income?
- It's been on market 51 days. Have you received any prior offers? Is the seller open to a 15% concession, seller financing, or rate buy-down credit?
- Property tax is high relative to price — has the assessment been appealed recently, and will the sale trigger a re-assessment?
- What does the HOA fee cover, when was the last increase, and are there any pending special assessments or reserve-fund shortfalls?
- Is there a deadline driving the sale (1031 exchange, divorce, estate, relocation)? That informs how much negotiation room exists.
- Schools are F-rated, which usually means shorter tenancies and higher turnover. Who's the typical renter profile here, and what's been the actual vacancy rate?
- Crime grade is F in this area — have there been break-ins, vandalism, or insurance claims at this property in the last 3 years? What carrier currently insures it and at what premium?
- The area grade is low — what's the realistic commute time and amenity access for the typical tenant pool here? Any planned neighborhood developments (good or bad) we should know about?
- What's the average days-on-market for RENTAL listings here right now (not sales)? A rising rental-DOM trend means longer vacancies and softer asking-rent achievability than the comps imply.
- What's the recent tenant-quality profile in this submarket — average credit score on applications, eviction rate, late-payment / NSF rate, and stable-employment percentage? A property-management company in the area should have these aggregated.
- How much new for-sale + rental construction is in the pipeline within 1–3 miles? Heavy new supply typically softens prices + rents 12–24 months out; constrained supply supports both.
Investment metrics
- 1% rule
- 0.95% ✗
- Cap rate
- 5.27%
- Cash-on-cash
- -3.66%
- DSCR
- 0.84
- GRM
- 8.8
CMA / ARV
- ARV (median comp)
- $307,661
- List price
- $275,000
- Delta
- -10.62%
- Verdict
- UNDERPRICED
- Comps
- 20 within 1.0 mi
Show comp detail 12 sales within ~0.75 mi
| Address | Dist | Beds/Ba | Sqft | Sold | Price | $/sf | Match |
|---|---|---|---|---|---|---|---|
| 14104 Golden Pass Rd | 0.21mi | 3/2.0 | 1,875 (+2%) | 6mo | $293,500 | $157 | 82 |
| 2133 Spring Mills Rd | 0.31mi | 3/2.0 | 1,925 (+4%) | 2mo | $315,000 | $164 | 76 |
| 2012 Valley Falls Ave | 0.17mi | 4/2.0 (+1) | 1,986 (+8%) | 5mo | $339,999 | $171 | 70 |
| 2124 Valley Falls Ave | 0.24mi | 3/2.0 | 1,986 (+8%) | 8mo | $334,000 | $168 | 69 |
| 1757 Patrick Cir | 0.56mi | 4/2.5 (+1) | 1,839 (-0%) | 2mo | $369,000 | $201 | 65 |
| 2656 Cumberland Trl | 0.31mi | 3/2.0 | 1,593 (-14%) | 1mo | $272,500 | $171 | 62 |
| 2200 Spring Mills Rd | 0.29mi | 3/2.5 | 2,070 (+12%) | 6mo | $314,990 | $152 | 60 |
| 1714 Brooksview Ln | 0.65mi | 4/2.5 (+1) | 1,820 (-1%) | 2mo | $289,900 | $159 | 59 |
| 2668 Pioneer Bluffs Rd | 0.36mi | 4/2.0 (+1) | 2,005 (+9%) | 6mo | $310,000 | $155 | 59 |
| 12848 Hilltop Dr | 0.64mi | 4/3.5 (+1) | 1,886 (+2%) | 10mo | $309,000 | $164 | 47 |
| 12802 Park Hill Ct | 0.64mi | 3/2.5 | 1,624 (-12%) | 6mo | $249,999 | $154 | 44 |
| 12632 Ridgeside Dr | 0.72mi | 4/2.5 (+1) | 1,981 (+7%) | 11mo | $279,900 | $141 | 38 |
Match score weights: distance 35% · size 25% · config 20% · recency 20%. Top-matched comps best support the ARV.
Projected returns pro-forma
-3.0% appreciation · 0.07% rent growth · sell at horizon
- IRR
- -26.4%
- Equity multiple
- 0.13×
- Total profit
- $-66,706
- Equity at exit
- $41,003
- IRR
- -42.5%
- Equity multiple
- -0.36×
- Total profit
- $-105,080
- Equity at exit
- $23,777
Cash invested: $77,000 (down + closing). Projections, not guarantees.
Landlord ↔ Tenant lean methodology
- Overall (STATE)
- 87 Strongly Landlord-Friendly
- State Texas
- 87 Strongly Landlord-Friendly · R+5
- County
- — inherits STATE
- City
- — inherits STATE
ZIP-level market 75181
- Home prices YoY
- -9.4%
- Rents YoY
- 0.1%
- Active inventory
- 590
- Price-to-rent
- 8.8×
Monthly cashflow live
- Estimated rent
- $2,603 high interval (Pro) →
- Mortgage (P&I)
- −$1,442
- Tax from tax record
- −$715 /mo · $8,580/yr
- Insurance
- −$115
- HOA
- −$20
- Vacancy / Maint / Mgmt
- −$547
- Net cashflow
- $-235
Break-even live
UW: 25.0% down · 7.5% · 30yr · 1.5% tax · 5.0% vac · 8.0% maint · 8.0% mgmt
Financing live
Cash to close
- Down payment
- $68,750
- Closing costs
- $8,250
- Reserves months
- —
- Total cash needed
- —
Loan-product check · same deal, 3 products live
Conventional
25% down · 7.5% · 30yr
- Down + closing
- —
- Monthly P&I
- —
- Monthly cashflow
- —
- DSCR
- —
- Eligible?
- —
Personal DTI + credit; lowest rate.
DSCR
20% down · 8.5% · 30yr
- Down + closing
- —
- Monthly P&I
- —
- Monthly cashflow
- —
- DSCR
- —
- Eligible?
- —
No personal income docs; deal must DSCR.
Hard money
10% down · 12.0% · 12mo
- Down + closing
- —
- Monthly P&I
- —
- Monthly cashflow
- —
- DSCR
- —
- Eligible?
- —
Short-term bridge; refi at stabilization.
Rent comps 32 comps
| Address | Beds | Baths | Sqft | Rent | $/sqft | DOM | Units | Dist |
|---|---|---|---|---|---|---|---|---|
| 2008 Valley Falls Ave Mesquite, TX | 3.0 | 2.0 | 1674 | $2,350 | $1.40 | 1d | 1 | 0.16mi |
| 2636 Cumberland Trl Balch Springs, TX | 3.0 | 2.0 | 2059 | $2,900 | $1.41 | 12d | 1 | 0.24mi |
| 2113 Spring Mills Rd Mesquite, TX | 4.0 | 3.0 | 1643 | $3,500 | $2.13 | 7d | 1 | 0.28mi |
| 2724 Windswept Ln Mesquite, TX | 3.0 | 2.0 | 1402 | $2,300 | $1.64 | 24d | 1 | 0.46mi |
| 716 Elm Falls Pl Mesquite, TX | 3.0 | 2.0 | 2444 | $2,300 | $0.94 | 20d | 1 | 0.53mi |
| 2800 Crockett Pl Mesquite, TX | 3.0 | 2.0 | 1660 | $1,895 | $1.14 | 21d | 1 | 0.58mi |
| 2801 Sonora Ln Mesquite, TX | 4.0 | 2.0 | 1938 | $2,245 | $1.16 | 24d | 1 | 0.60mi |
| 2805 Cameron Way Mesquite, TX | 3.0 | 2.0 | 1660 | $2,150 | $1.30 | 12d | 1 | 0.69mi |
| 12719 Bluffview Dr Balch Springs, TX | 3.0 | 2.5 | 1788 | $2,300 | $1.29 | 43d | 1 | 0.75mi |
| 12931 Parker Ct Balch Springs, TX | 3.0 | 2.0 | 1338 | $2,155 | $1.61 | 7d | 1 | 0.77mi |
| 2829 Kerrville Dr Mesquite, TX | 4.0 | 2.5 | 2349 | $2,700 | $1.15 | 4d | 1 | 0.79mi |
| 1801 Wilkinson Rd Mesquite, TX | 2.0 | 1.0 | 1396 | $1,550 | $1.11 | 44d | 1 | 0.82mi |
| 815 Valleycreek Rd Mesquite, TX | 3.0 | 2.0 | 1788 | $2,500 | $1.40 | 43d | 1 | 0.84mi |
| 3521 Vicki Ln Balch Springs, TX | 4.0 | 2.0 | 1639 | $1,999 | $1.22 | 43d | 1 | 0.87mi |
| 2749 Ingram Cir Mesquite, TX | 3.0 | 2.0 | 1791 | $2,119 | $1.18 | 2d | 1 | 0.88mi |
| 1309 Dawson Way Mesquite, TX | 4.0 | 2.0 | 1952 | $2,222 | $1.14 | 7d | 1 | 0.99mi |
| 1308 Dawson Way Mesquite, TX | 4.0 | 2.5 | 2476 | $3,573 | $1.44 | 24d | 1 | 1.00mi |
| 1513 Colborne Dr Mesquite, TX | 3.0 | 2.0 | 1805 | $2,045 | $1.13 | 43d | 1 | 1.00mi |
| 1400 Long Shadow Ln Mesquite, TX | 4.0 | 2.0 | 1474 | $2,250 | $1.53 | 7d | 1 | 1.01mi |
| 1626 Rancho Dr Mesquite, TX | 4.0 | 2.0 | 2562 | $2,419 | $0.94 | 24d | 1 | 1.06mi |
| 3505 Vicki Ln Balch Springs, TX | 4.0 | 2.5 | 2399 | $2,435 | $1.02 | 43d | 1 | 1.07mi |
| 1332 Nimitz Way Mesquite, TX | 4.0 | 2.0 | 2109 | $2,280 | $1.08 | 20d | 1 | 1.09mi |
| 1128 Catalan Trl Mesquite, TX | 3.0 | 2.5 | 1600 | $2,300 | $1.44 | 43d | 1 | 1.28mi |
| 1104 Ashland Dr Mesquite, TX | 3.0 | 1.0 | 1250 | $1,625 | $1.30 | 7d | 1 | 1.31mi |
| 3808 Kenzie Ct Balch Springs, TX | 3.0 | 2.0 | 1690 | $2,085 | $1.23 | 1d | 1 | 1.32mi |
| 11815 Sunrise Dr Balch Springs, TX | 3.0 | 2.0 | 1719 | $1,895 | $1.10 | 5d | 1 | 1.33mi |
| 1101 La Esperanza Dr Mesquite, TX | 3.0 | 2.0 | 1697 | $2,700 | $1.59 | 1d | 1 | 1.35mi |
| 1029 Kory Dr Mesquite, TX | 3.0 | 2.0 | 1463 | $1,950 | $1.33 | 43d | 1 | 1.35mi |
| 13131 Rocky Ledge Dr Balch Springs, TX | 3.0 | 2.0 | 1565 | $1,883 | $1.20 | 2d | 1 | 1.37mi |
| 1416 Poplar Dr Mesquite, TX | 4.0 | 2.5 | 2052 | $2,400 | $1.17 | 43d | 1 | 1.40mi |
| 1005 Chelsea Dr Mesquite, TX | 3.0 | 2.0 | 1861 | $2,200 | $1.18 | 24d | 1 | 1.42mi |
| 1002 Majors Dr Mesquite, TX | 3.0 | 2.0 | 1636 | $1,895 | $1.16 | 43d | 1 | 1.44mi |
HOA detail
- Monthly dues
- $20 · $240/yr
Listing history 20 events
-
2026-06-18days on market $275,000 Active 51 DOM
-
2026-06-17days on market $275,000 Active 50 DOM
-
2026-06-16days on market $275,000 Active 49 DOM
-
2026-06-15days on market $275,000 Active 48 DOM
-
2026-06-13days on market $275,000 Active 46 DOM
-
2026-06-13days on market $275,000 Active 45 DOM
-
2026-06-10price $275,000 Active 42 DOM
-
2026-06-09days on market $320,000 Active 42 DOM
-
2026-06-08days on market $320,000 Active 41 DOM
-
2026-06-07days on market $320,000 Active 40 DOM
-
2026-06-04days on market $320,000 Active 37 DOM
-
2026-06-03days on market $320,000 Active 36 DOM
-
2026-06-02days on market $320,000 Active 35 DOM
-
2026-06-01days on market $320,000 Active 34 DOM
-
2026-05-31days on market $320,000 Active 33 DOM
-
2026-04-27$320,000 Active 579-char remark
-
2013-03-25historical 167-char remark
Show marketing remark (167 chars)
Very popular 4606 plan in Pioneer Bluffs!! Beautiful home! Gorgeous, huge kitchen with lots of cabinets. Ready for move-in!! Must see!! SEE SHOWING INSTRUCTIONS PLEASE
-
2013-03-22soldstatus Closed 167-char remark
Show marketing remark (167 chars)
Very popular 4606 plan in Pioneer Bluffs!! Beautiful home! Gorgeous, huge kitchen with lots of cabinets. Ready for move-in!! Must see!! SEE SHOWING INSTRUCTIONS PLEASE
-
2013-02-22status Pending 167-char remark
Show marketing remark (167 chars)
Very popular 4606 plan in Pioneer Bluffs!! Beautiful home! Gorgeous, huge kitchen with lots of cabinets. Ready for move-in!! Must see!! SEE SHOWING INSTRUCTIONS PLEASE
-
2013-01-22$139,990 Active 167-char remark
Show marketing remark (167 chars)
Very popular 4606 plan in Pioneer Bluffs!! Beautiful home! Gorgeous, huge kitchen with lots of cabinets. Ready for move-in!! Must see!! SEE SHOWING INSTRUCTIONS PLEASE
ⓘ Source: listings_history table (triggers on properties + properties_extension) + one-shot
backfill from property_details.listing_events for pre-trigger history.
Tax reassessment forecast TX · Resets to sale price
- Current annual tax
- $8,580 · $715/mo
- Projected year-2 tax
- $8,580 · $715/mo
- Expected delta
- $0/yr ($0/mo · 0.0%)
ⓘ Screening estimate from a state-policy table — verify with the county assessor before closing.
Climate risk First Street
- Flood 1/10 Low FEMA zone X (unshaded) · 0% chance over 30 yrs
- Wildfire 3/10 Moderate
- Heat 8/10 Severe 7 d/yr ≥111°F today · 24 d/yr by 30 yrs out
- Wind 6/10 Major 27% chance of damaging wind over 30 yrs
- Air quality 2/10 Low 1 unhealthy d/yr today · 1 by 30 yrs out
Nearby sold comps map
Loading sold comps map…
Walkable amenities ~0.75 mi
Loading nearby amenities…
Taxation est. · year 1
- Rental income
- $31,242
- − Mortgage interest
- −$15,404
- − Property taxes
- −$8,580
- − Insurance
- −$1,375
- − Repairs & maintenance
- −$2,499
- − Management
- −$2,499
- − HOA
- −$240
- − Depreciation
- −$8,000
- Taxable loss
- −$7,357
- Est. tax savings @ 24.0%
- +$1,766
- After-tax cash flow
- $-1,054/yr
For passive investors: Depreciation is non-cash, so a rental often shows a tax loss while cash-flowing — sheltering income. Rental losses are passive: they offset passive income freely, and up to $25,000/yr can offset ordinary (W-2) income if you actively participate and your MAGI is under $100k (phasing out to $0 by $150k); unused losses carry forward. On sale, claimed depreciation is recaptured at up to 25%, and gains may owe capital-gains tax (a 1031 exchange can defer both). Figures are a year-1 estimate at your 24.0% rate — not tax advice; consult a CPA.
Schools (NCES district)
- District
- Mesquite ISD
- NCES district ID
- 4830390
- Math proficiency
- 35% ▼ -11.00%
- Reading proficiency
- 32% ▼ -7.00%
- Median HH income
- $49,372
- Composite
- 29.06/100
- National rank
- #6606
- State rank
- #536 of 826 in TX
Livability — Balch Springs
- Score
- 68/100
- State rank
- #487
- US rank
- #9673
Category grades
Schools grade is shown separately in the Schools card above.
Census & demographics
- Census place
- Balch Springs, TX
- County
- Dallas County · 2,612,404 people
- City population
- 26,455
- Metro
- Dallas-Fort Worth-Arlington, TX
- Population (ZIP)
- 29,788
- Household income
- $111,052
- Rent vs Own
- Severe rent burden
- 857.0
Population outlook (Dallas County) Hauer SSP2
- Today (2025)
- 2,979,839 people
- By 2030
- 3,191,823 · +7.1%
- By 2040
- 3,619,611 · +21.5%
- By 2050
- 4,026,915 · +35.1%
- By 2075
- 4,957,073 · +66.4%
- By 2100
- 5,508,725 · +84.9%
Race, ethnicity, and origin ACS 2023
- Neighborhood character
- Highly diverse neighborhood (Simpson 0.71)
- Race & ethnicity
- Black 39% Hispanic / Latino 32% Two or more races 21% White 16% Asian 5% Native American 1%
- Hispanic origin (detail)
- Mexican 27% Puerto Rican 1%
- Common ancestry
- Slovak 2% Italian 1%
- Foreign-born
- 22% · Canada, Vietnam
- Languages at home
- 64% English-only · Spanish 27% Tagalog/Filipino 3% Other Asian/Pacific 1%
Political lean MEDSL · Dallas
- 2024 margin
- Strong D (+22.2) · D 60.2% · R 38.0% · Other 1.8%
- 2008→2024 swing
- +6.9pp toward D · 2008: 15.3pp · 2024: 22.2pp
- All cycles
- 2024: D+22.2 2020: D+31.6 2016: D+26.2 2012: D+15.4 2008: D+15.3
Not yet ingested
- Civics
- —
Market trends
- HPI YoY
- ▼ -26.63%
- Current HPI
- 257.0959
- Rent YoY
- ▲ 0.07%
- Metro
- Dallas-Fort Worth-Arlington, TX
- State GDP YoY
- ▲ 3.95%
- F500 in state
- 110
Industry mix (Fortune 500 HQ in TX)
| Industry | F500 HQs | Revenue |
|---|---|---|
| Energy | 16 | $1,198B |
|
||
| Technology | 5 | $198B |
|
||
| Engineering / Construction | 4 | $72B |
|
||
| Energy Services | 3 | $60B |
|
||
| Utilities | 3 | $41B |
|
||
| Healthcare | 2 | $330B |
|
||
Price history
+96.4% since first listed6 events — show timeline
- 2026-06-09 Price Changed $275,000 NTREIS
- 2026-04-27 Listed $320,000 NTREIS
- 2013-03-25 Listing Removed — NTREIS
- 2013-03-22 Sold (MLS) — NTREIS
- 2013-02-22 Pending — NTREIS
- 2013-01-22 Listed $139,990 NTREIS
Property tax history
+20.4%/yrLatest (2025): $8,580 · +13.5% YoY. Source: county tax records.
Cash-flow waterfall
monthlySold comps — $/sqft
last 12 mo · ≤1 miLoading sold comps…